Part 1 : PE-bags with Ethylene Removers Stored at 5
0C±2
0C
Part 2 : PE-bags with Ethylene Removers stored at 10
0C±2
0C
By
Nurpilihan Bafdal
Carmencita Tjahjadi
Seok-In Hong
Dongman Kim
Debby Sumanti Moody
Totok Pujianto
Joint Research Between
The Padjadjaran University
and
The Korea Research Institute
1
commodity becomes unsalable when the flowers begin to open or turn yellow.
The yellowing of broccoli occurs in three days at room temperature and is the
main problem in its prepackaging (Salunkhe & Desai, 1984).
Reduction of green pigmentation and consequently the predominance of
yellow pigments is a normal process in ripening or senescence of many fruits and
vegetable ; such changes can be accelerated by ethylene (Garcia & Barret, 2002).
Broccoli emits a significant amount of ethylene in storage. The production
of ethylene and the subsequent yellowing are important factors in the post-harvest
handling of broccoli (Salunkhe & Desai, 1984).
The refrigeration of packaged broccoli reduces the production of ethylene
considerably (Salunkhe & Desai, 1984). Thompson & Kelly (1975) vide Salunkhe
& Desai (1984) stated that packaging of broccoli did not eliminate the need for
refrigeration, but accentuated the need for refrigeration to keep the produce
constantly cold. Broccoli is generally hydro-cooled to 4.4oC and then packed with ice in the crate and stored in refrigerators for later sale (Salunkhe & Desai, 1984).
According to Reid (1992), a number of techniques have been developed to
protect sensitive commodities from the effect of ethylene. Selection of the
appropriate method depends on the commodity and the handling techniques used
in its marketing.
Removing of ethylene from the atmosphere around the commodity is the
preferable method of preventing deterioration of ethylene-sensitive produce. The
main methods are : 1). eliminating sources of ethylene such as avoiding the use of
internal combustion engine vehicles, or fitting them with engine exhausts with
catalytic convertors, and removal of overripe or rotting produce, 2). good
ventilation, 3). chemical removal using potassium-permanganate, ultraviolet
lamps, activated or brominated charcoal, catalytic oxidizers or bacterial systems,
4). hypobaric storage (Reid, 1992).
Potassium-permanganate oxidizes ethylene to CO2 and H2O. The
requirements of such techniques are a high surface area coated with the
used to manufacture permanganate absorbers, such as vermiculite, pumice and
brick. Activated or brominated charcoal can absorb ethylene from the air. This
method is confined to laboratory use because potassium permanganate absorbers
are cheaper and widely available (Reid, 1992).
The effect of ethylene could also be inhibited by reducing spiration rate,
production of ethylene and other metabolic processes through controlled
atmosphere or modified atmosphere packaging. For example, bananas transported
in polyethylene-lined boxes containing K-permanganate absorbers at 15-25oC arrive in better condition due to the effect of accumulated CO2 produced by the
fruit on preventing the action of ethylene (Reid, 1992).
The objective of this experiment was to find a feasible method to delay
yellowing of broccoli curds using low temperature storage respectively at
50C±20C (Part 1), and 100C±20C (Part 2), modified atmosphere packaging in PE-bags with and without holes and chemicals to remove ethylene from the
atmosphere within the package by potassium-permanganate and active coal.
II. Time and Place of Research
The first part of the experiment was conducted at the Food Process
Engineering and the Post-harvest Technology Laboratories of The Faculty of
Agriculture Industrial Technology of The Padjadjaran University at Jatinangor,
West-Java from August 9 up to August 23, 2007 at 50C±20C, followed by removal from cold storage and further observation for 2 successive days at ambient
temperature.
The second part of the experiment was carried out at the same laboratories
at 100C±20C, from August 26th up to September 10th, 2007.
III. Materials and Methods
Materials :
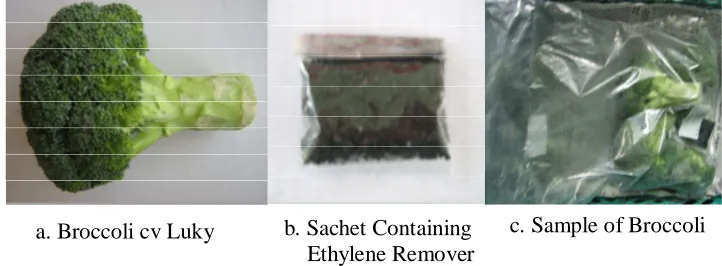
Broccoli (Brassica oleracea gp Italica) cv Luky (From the Bejo Company,
the Netherlands) harvested at two months after planting and possessing curds of
15 cm diameter, dark green in color, and compact was used. Others materials
polypropylene sachets (15 cm x 7 cm) for the ethylene removers, respectively
potassium-permanganate (pp) and active coal (ac) of technical grade.
Equipments
Film-bag sealer, paper perforator, electric balance, Canon digital camera,
sling hygrometer, sensory evaluation lab-equipments and a sensory panel
consisting of trained panelists.
Methods
A descriptive experimental method in triplicates, followed by regression
analyses consisting of two variables (dependent and independent variables) was
employed. Four broccoli curds were put into a perforated/un-perforated PE-bag,
together with/without a sachet containing ethylene removing substance/substances
(Fig. 1) according to treatment given. Either 10 g potassium-permanganate or
active coal and a mixture of 5 g potassium-permanganate and 5 g of active coal
were used.
Fig 1. Sample of Package Holding Broccoli Curd and Sachet Containing Ethylene Remover
The treatments in Part (1) of the experiment were :
A. PE bag without holes
B. PE bag without holes and an active coal sachet (10 g)
C. PE bag without holes and a potassium-permanganate sachet (10 g)
D. PE bag without holes and a sachet containing potassium-permanganate
(5 g) and active coal (5 g)
E. PE bag with 4 holes (control)
F. PE bag with 4 holes and an active coal sachet (10 g) a. Broccoli cv Luky b. Sachet Containing
Ethylene Remover
G. PE bag with 4 holes and a potassium-permanganate (10 g)
H. PE bag with 4 holes and a sachet containing potassium-permanganate (5 g)
and active coal (5 g)
The treatments in Part (2) of the experiment were:
A. PE bag without holes
B. PE bag without holes and a K-permanganate sachet (10 g)
C. PE bag without holes and an active coal sachet (10 g)
D. PE bag without holes and a sachet containing K-permanganate (5 g) and
active coal (5 g)
E. PE bag with 4 holes
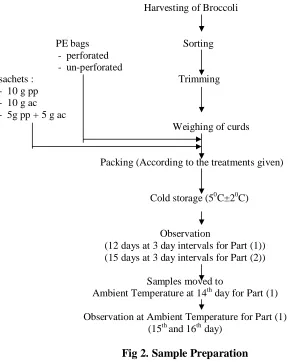
The procedure of sample preparation for the Part (1) and (2) experiments is shown in Fig. 2.
Harvesting of Broccoli
PE bags Sorting - perforated
- un-perforated
sachets : Trimming
- 10 g pp
- 10 g ac
- 5g pp + 5 g ac
Weighing of curds
Packing (According to the treatments given)
Cold storage (50C±20C)
Observation
(12 days at 3 day intervals for Part (1)) (15 days at 3 day intervals for Part (2))
Samples moved to
Ambient Temperature at 14th day for Part (1)
Observation at Ambient Temperature for Part (1) (15th and 16th day)
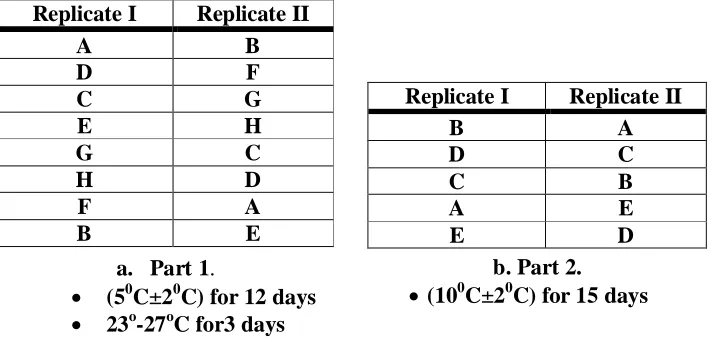
The samples of the Part (1) experiment were then stacked in columns and
stored at 50C±20C for 12 days and then removed to ambient temperature for 3days. The samples of the Part (2) experiment were stored at 100C±20C for 15 days. The experimental lay out is presented in Fig. 3.
Replicate I Replicate II
A B
D F
C G
E H
G C
H D
F A
B E
Fig. 3. Experiment lay-out: a. Part 1; b. Part 2
Observation were carried out at three day intervals, consisting of :
1. Curd surface color by the CIE-lab method
2. Sensory test using a panel of experienced panelists to evaluate :
a. Discoloration, Wilting and Decay. A 9 point-scale, respectively 1 (none), 3
(slight), 5 (moderate), 7 (severe) and 9 (extreme) was employed
b. Overall visual quality, which were rated also on a 9 point-scale
respectively, 1 (extremely poor), 3 (poor), 5 (fair), 7 (good) and 9
(excellent).
3. Incidence of soft rot (% no of samples)
4. Weight loss (% of initial weight)
Considering no yellowing of curds were detected, the cold storage
experiment was terminated at day 12. The samples were then transferred to
ambient temperature on the 14th day; and storage continued for 3 more days. Observation as the above was continued respectively on the 15th and 16th day. Due to these results the Part (2) experiment was stored at 100C±20C.
Replicate I Replicate II
B A
D C
C B
A E
E D
a. Part 1.
(50C±20C) for 12 days
23o-27oC for3 days
b. Part 2.
IV. Results and Discussion
Part 1. of the Experiment : Storage at 50C±20C for 12 days and at ambient temperature for 3 days.
4.1.Cold Storage (day 0-12)
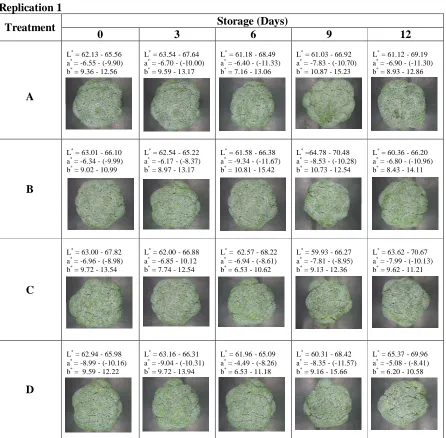
4.1.1. Curd Surface Color
Replication 2
a. Low-temperature storage (3.80C)
Lougheed, Murr and Toivonen (1987) said that the many effects of ethylene
upon vegetables in storage are reduced by low temperatures.
Barth et al., (1993) reported that retention of green color was attained by
modified atmosphere packaging and storage at 100C. These authors reported that within 48 hours CO2 concentration in broccoli packages reached
equilibrium at 8% and oxygen content at 10%. Lougheed et al., (1987) stated
that retention of green color in vegetable stored in controlled atmosphere was
due to competitive inhibition of ethylene action by CO2 and reduced ethylene
synthesis at low oxygen partial pressures.
c. Chemical Removal of Ethylene
The low concentration of ethylene within the packages maybe oxidized to CO2
and H2O by potassium-permanganate and/or absorbed by the active coal
included within each package of broccoli (Reid, 1992).
d. The Cultivar Luky (From the Bejo Company, The Netherlands)
Although the production of ethylene by edible floral parts, such as broccoli
and cauliflower maybe quit high, some cultivars may produce variable
amounts of this substance. Moreover, there may also be a genetic control of
chlorophyll loss in harvested vegetables, for example some cabbage cultivars
are able to retain their green color longer, although it is not related to
endogenous rates of ethylene production (Lougheed, et al., 1987). In this
experiment the broccoli cultivar used was Luky; which is greener in color than
other cultivars and likely more resistent to yellowing / degreening.
Due to these results, the experiment at low temperature storage was
terminated at day 12; and the same experiment was then continued at ambient
temperature for 3 more days starting from day 14.
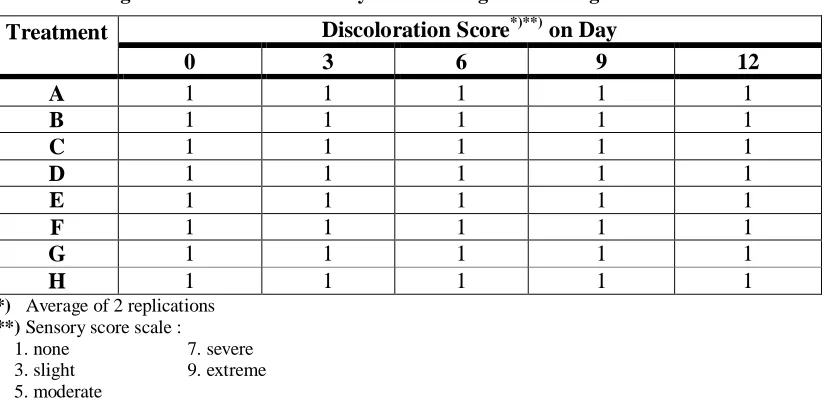
4.1.2. Changes in Sensory Score Scores during Cold Storage at 3.8oC
Changes in sensory discoloration, wilting, decay and overall quality during
Table 2. Changes in Discoloration Sensory Score during Cold Storage at 3.8o C
Discoloration Score*)**) on Day Treatment
0 3 6 9 12
A 1 1 1 1 1
B 1 1 1 1 1
C 1 1 1 1 1
D 1 1 1 1 1
E 1 1 1 1 1
F 1 1 1 1 1
G 1 1 1 1 1
H 1 1 1 1 1
*) Average of 2 replications **) Sensory score scale :
1. none 7. severe 3. slight 9. extreme 5. moderate
Table 3. Changes in Wilting Sensory Score during Cold Storage at 3.8oC
Wilting Sensory Score*)**) on Day Treatment
0 3 6 9 12
A 1 1 1 1 1-3
B 1 1 1 1 1-3
C 1 1 1 1 1-3
D 1 1 1 1-3 1-3
E 1 1 1 1-3 1-3
F 1 1 1 1-3 1-3
G 1 1 1 1 1
H 1 1 1 1 1
*) Average of 2 replications **) Sensory score scale :
Table 4. Changes in Decay Sensory Score during Cold Storage at 3.8oC
Decay Score*)**) on Day Treatment
0 3 6 9 12
A 1 1 1 1 1
B 1 1 1 1 1
C 1 1 1 1 1
D 1 1 1 1 1
E 1 1 1 1 1
F 1 1 1 1 1
G 1 1 1 1 1
H 1 1 1 1 1
*) Average of 2 replications **) Sensory score scale :
1. none 7. severe
3. slight 9. extreme 5. moderate
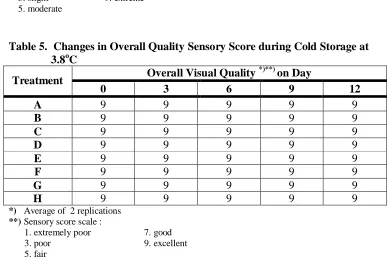
Table 5. Changes in Overall Quality Sensory Score during Cold Storage at 3.8oC
Overall Visual Quality *)**) on Day Treatment
0 3 6 9 12
A 9 9 9 9 9
B 9 9 9 9 9
C 9 9 9 9 9
D 9 9 9 9 9
E 9 9 9 9 9
F 9 9 9 9 9
G 9 9 9 9 9
H 9 9 9 9 9
*) Average of 2 replications **) Sensory score scale :
1. extremely poor 7. good
3. poor 9. excellent
5. fair
Practically no changes in discoloration, decay and overall quality sensory
scores were observed during the 12 day cold storage, except for wilting score
which showed some slight changes on day 9 and 12. The reasons for these results
were already discussed in point 4.1.1 – 4.1.3.
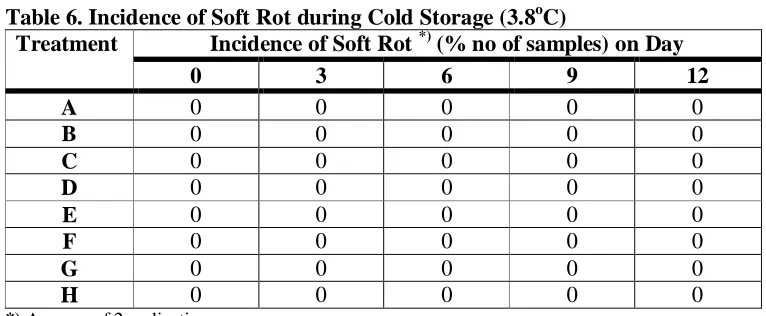
4.1.3. Incidence of Soft Rot
Incidence of soft rot during the 12 day low temperature storage is
Table 6. Incidence of Soft Rot during Cold Storage (3.8oC)
Incidence of Soft Rot *) (% no of samples) on Day Treatment
0 3 6 9 12
A 0 0 0 0 0
B 0 0 0 0 0
C 0 0 0 0 0
D 0 0 0 0 0
E 0 0 0 0 0
F 0 0 0 0 0
G 0 0 0 0 0
H 0 0 0 0 0
*) Average of 2 replications
No Soft rot was observed during the cold storage period. Broccoli is often
infected by gray mold rot (Botrytis cinerea), downy mildew (Peronospora
parastica), and black rot (Xanthomonas campestris) (Salunkhe and Desai, 1984).
This experiment was conducted in the dry monsoon of the year 2007, and in West
Java the current dry monsoon is more severe than normal; this might be the reason
there is no incidence of rot observed.
4.1.4. Weight Loss
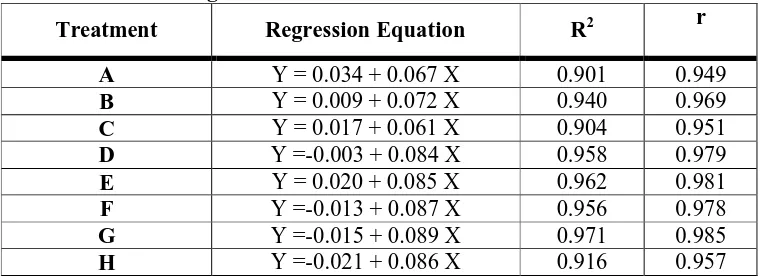
Result of regression analyses showed there is a very close linear
relationship between weight loss and storage time in all treatments. Regression
curves are presented in Figure 4 while regression equations and coefficients of
determination and coefficients of correlation are presented in Table 7.
Figure 4. Regression Curves of Weight Loss during Cold Storage at 3.8oC
Table 7. Regression Equations of Weight Loss (% Initial Weight) during Cold Storage at 3.8oC
Treatment Regression Equation R2 r
A Y = 0.034 + 0.067 X 0.901 0.949
B Y = 0.009 + 0.072 X 0.940 0.969
C Y = 0.017 + 0.061 X 0.904 0.951
D Y =-0.003 + 0.084 X 0.958 0.979
E Y = 0.020 + 0.085 X 0.962 0.981
F Y =-0.013 + 0.087 X 0.956 0.978
G Y =-0.015 + 0.089 X 0.971 0.985
H Y =-0.021 + 0.086 X 0.916 0.957
At the end of the 12 day cold storage at 3.80C , weight loss in the perforated bags (E to H) ranged between 0.99% - 1.09% as compared to
0.78% - 1.04% in the un-perforated ones (A to D). The perforations were designed
to maintain RH in the bags at about 90% - 95%, but they also allow some air
movement, including moisture vapor, into the environment. However, RH in the
cold storage during this experiment was 94% - 99%, which is slightly higher than
is recommended for vegetable storage and transport, respectively 90% - 98%
(Kader, 1992), causing some moisture vapor loss into the surrounding atmosphere
from the perforations. Moisture vapor loss also occurred due to the permeability
of the LDPE film to moisture vapor, which at 230C, 85% RH is about 3000 ml.m-2. per 24 h (Fellows, 2000). Consequently, weight loss values for both
perforated and un-perforated packs were close to one another.
A, B, C D, E, F,G,H
0 0.2 0.4 0.6 0.8 1 1.2 1.4 1.6 1.8 2
0 3 6 9 12 15
Storage Time (days)
Weight Loss (%
)
The chemicals to remove ethylene in the bags, respectively
potassium-permanganate, active coal and their combination, did not seem to affect weight
loss. The perforations do exert greater effect than these substances on weight loss.
4.2.Ambient Temperature Storage (day 14-16)
4.2.1. Weight Loss
Average weight loss during the 3 day room-temperature storage is presented
in Table 8.
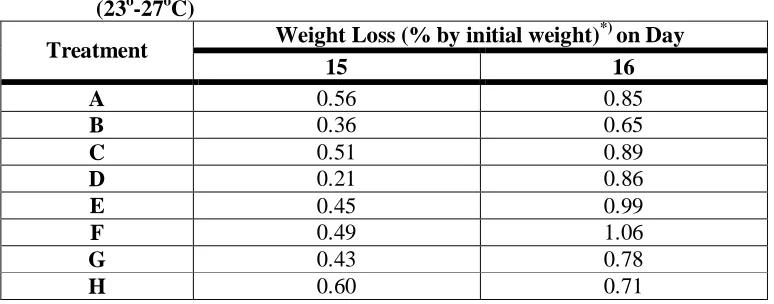
Table 8. Average Weight Loss at Day 15 and 16 at Ambient Temperature (23o-27oC)
Weight Loss (% by initial weight)*) on Day Treatment
15 16
A 0.56 0.85
B 0.36 0.65
C 0.51 0.89
D 0.21 0.86
E 0.45 0.99
F 0.49 1.06
G 0.43 0.78
H 0.60 0.71
*)Average of 2 replicates
Average weight loss on day 15 and 16 were higher in the perforated
poly-bags than in the un-perforated ones. This is possibly due to the free movement of
air from the packages into the environment, resulting greater evaporation of
moisture from the commodity.
The ethylene removing chemicals within the poly-bags, however, did not
show consistent effects on average weight loss.
4.2.2. Curd Surface Color
Curd surface color changes during the 3 day storage at ambient
Table. 9 Curds Surface Color Changes during Ambient Storage (23o-27oC)
perforated ones did not change much when compared to day 14. However on day
16 both showed significant yellowing. Yellowing of curds were more severe in
the perforated poly-bags (A to H) than in the un-perforated ones (A-D).
Less severe yellowing in the un-perforated bags might be related to the
modified atmosphere packaging. Salunkhe and Desai (1984) reported that
modified atmospheres containing 10%, 5%, 2.5% or 1% oxygen flushed over
broccoli at 23.90C for 3 days, significantly reduced respiration rate and completely stopped yellowing of the curd. In this experiment yellowing still
occurred, but was less intense. No different effect on yellowing could be detected
among the different ethylene removing substances used.
The more severe yellowing in the perforated bags could be caused by the
room temperature of 230-270C. Ambient temperature increased both rate of respiration and other metabolic processes, including ethylene synthesis. These
resulted in rapid loss of chlorophyll and the green color of the curd (Reid, 1992).
Moreover, normal O2 and CO2 concentrations within the perforated package
promote ethylene production (Reid, 1992), while normal CO2 concentration
accelerated ethylene induced chlorophyll degradation and thus yellowing of the
curd (Barth et al., 1993).
4.2.3. Incidence of Soft rot
Average incidence of soft rot (% no. of samples) during the 3 day room
temperature storage is presented in Table 10.
Table 10. Incidence of soft rot (% no. of samples) during Room Temperature Storage (230C-270C)
Average Incidence of Soft Rot *) (% no. of samples) on Day
Treatment
14 15 16
A 0 0 0
B 0 0 0
C 0 0 0
D 0 0 0
E 0 0 0
F 0 0 0
G 0 0 0
H 0 0 0
*)Average of 2 replications
No soft rot incidence was observed during the 3 day room temperature
the dry monsoon and the low RH of 50-63% in the storage room at the time of the
experiment.
4.2.4. Sensory Score Changes
Average sensory score changes for discoloration, wilting, decay and
overall quality at room temperature storage is presented in Table 11, 12, 13, and
14.
Table 11. Average Discoloration Sensory Score during Room Storage (23o-27oC) Discoloration Score *)**) on Day
Treatment 14 15 16
A 1 1 1
B 1 1 1
C 1 1 1
D 1 1 1
E 1 1-3 1-3
F 1 1-3 1-3
G 1 1-3 1-3
H 1 1-3 1-3
*) Average of 2 replications **) Sensory score scale :
1. none 7. severe
3. slight 9. extreme
5. moderate
Table 12. Average Sensory Wilting Score during Room Temperature Storage (230-270C)
Average Wilting Score*)**) on Day
Treatment 14 15 16
A 1 1 1
B 1 1 1
C 1 1 1
D 1 1 1
E 1 1 1
F 1 1 1
G 1 1 1
H 1 1 1
*)Average of 2 replications **)Sensory score scale :
1. none 7. severe
3. slight 9. extreme
Table 13. Average Sensory Decay Score during Room Temperature Storage (23o-27oC)
Average Decay Score*)**) on Day
Treatment 14 15 16
A 1 1 1
B 1 1 1
C 1 1 1
D 1 1 1
E 1 1 1
F 1 1 1
G 1 1 1
H 1 1 1
*)Average of 2 replications **)Sensory score scale :
1. none 7. severe
3. slight 9. extreme
5. moderate
Table 14. Overall Quality Sensory Score during Room Temperature Storage (23o-27oC)
Overall Quality Score*)**) on Day
Treatment 14 15 16
A 9 9 9
B 9 9 9
C 9 9 9
D 9 9 9
E 9 7-9 7-9
F 9 7-9 7-9
G 9 7-9 7-9
H 9 7-9 7-9
*)Average of 2 replications **)Sensory score scale :
1. extremely poor 7. good
3. poor 9. excellent
5. fair
Average discoloration sensory scores (Table 11) showed that broccoli
curds in the un-perforated bags (A to D) on both day 15 and 16 were not
discolored (score 1), but those in the perforated bags (E to H) showed some
yellowing (score 1-3). This may be due to:
a) The normal room temperature of 23o-27oC increased respiration rate and other metabolic processes including ethylene production (Salunkhe and
b) The normal O2 and CO2 concentration within the package due to the
perforations. Normal O2 concentration may cause ethylene production to
go back to normal (Reid, 1992) while the normal CO2 concentration of the
atmosphere promoted chlorophyll degradation and thus increased
yellowing (Bartth et al., 1993).
Average wilting sensory scores (Table 12) revealed that no wilting was
observed on day 15 and 16 in all treatments. The PE-bags with and without
perforations probably provided sufficient barrier to moisture loss in all treatments.
Similar results were also observed in decay sensory scores (Table 13). The
low mold and mildew contamination rate in the dry monsoon, the low RH in the
storage room (RH 50-63 %) and the very short observation period (3 days) were
probably the reason.
The overall quality sensory scores (Table 14) on day 15 and 16 gave
excellent scores (score 9) for the un-perforated packs (A to D) and good scores for
the perforated ones (E to H). Scores were affected primarily by the yellowing of
the curd (Table 11).
4.3 Part 2 of the Experiment : storage at 100C±20C for 15 days.
4.3.1. Curd Surface Color
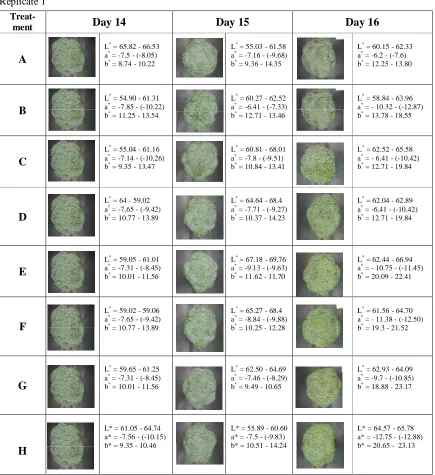
Table 15 Broccoli Curd Surface Color during Cold Storage at 100C±20C Replicate I
Replicate 2
Photos in Table 15 show that for treatment A, B, C and D green color of
the broccoli curds could be maintained for 15 days, although some slight
yellowing was evident in treatment A on day 12 and 15. On day 12 there was
power failure causing a rise in cold storage temperature to 220C. Treatment E, however, started to turn yellowish after day 9, while on day 12 was already yellow
and on day 15 was brownish yellow. This might be related to Breene’s (1976)
statement that quality of fresh produce could be maintained at higher storage
temperature in controlled or modified atmospheres.
Evidently modified atmosphere within the package in treatment A
(0 holes) was able to inhibit yellowing considerably when compared to E
(4 holes). Modified atmosphere plus ethylene removers in treatment B, C and D
were able to inhibit yellowing to a greater extent than MAP only (A).
Furthermore, active coal (C) seemed to be best in preventing yellowing of the
curds, followed by the mixture of Permanganate and active coal, and finally
K-Permanganate; however the difference in yellowing among the three ethylene
removers was very small.
4.3.2. Changes in Sensory Scores for Discoloration, Wilting, Decay and Overall Quality during Cold Storage at 10oC ± 2oC
Changes in sensory discoloration, wilting, decay and overall quality
during cold storage are presented in Table 16, 17, 18, and 19. Regression
equations for all parameters were undefined
Table 16. Discoloration Score during Cold Storage at 10oC ± 2oC
Discoloration Score*)**) on Day Treatment
0 3 6 9 12 15
A 1 1 1 3 1-5 1-3
B 1 1 1-3 1-3 1-5 3-5
C 1 1 1 1 1 1-3
D 1 1 1-3 1-3 1-3 1-3
E 1 1 1-5 5-7 9 7-9
*) Average of 2 replications **) Sensory score scale :
1. none 7. severe
Table 16 shows that:
a. The unperforated bag (A) gave better results than the perforated one (E) which
was the worst among the 5 treatments
b. Inspite of power failure on day 12, treatment C (0 holes + ac) was best among
the 5 treatments tested because during the first 12 days there was no yellowing
observed, but on day 15 slight yellowing was evident. Treatment B (0 holes + pp)
gave similar results as treatment D (0 holes + mixture pp + ac) for 9 days i.e. no
discoloration on day 3 followed by some slight yellowing on day 6 and 9.
However, on day 12 and 15, treatment D (0 holes + pp + ac) gave better results
i.e. discoloration was stable at 1-3 (none-slight); but B (0 holes + pp) showed
increase of yellowing from slight to moderate (3-5).
Table 17. Wilting Sensory Score during Cold Storage at 10oC ± 2oC Wilting Sensory Score*)**) on Day Treatment
0 3 6 9 12 15
A 1 1 1 1-3 5 3-7
B 1 1 1 1-3 1-3 5
C 1 1 1 1-3 3-5 3
D 1 1 1 1-3 1-5 1-5
E 1 1 1 5 3 3-5
*) Average of 2 replication **) Sensory score scale :
1. none 7. severe
3. slight 9. extreme
5. moderate
Table 17 shows that:
a. All treatments tested were able to prevent wilting up to 6 days
b. On day 9, treatments A to D (no holes) was better than E (with 4 holes)
c. Among the ethylene removers active coal showed larger wilting scores than
the two others starting from day 12 onwards. This could be because active
coal absorbs not only ethylene but also other gases, such as water vapor; on
other hand K-permanganate works on just ethylene, i.e. as ethylene
Table 18. Decay Sensory Score during Cold Storage at 10oC ± 2oC Wilting Sensory Score*)**) on Day Treatment
0 3 6 9 12 15
A 1 1 1 1 7 7
B 1 1 1 1 5 7
C 1 1 1 1 5-7 7
D 1 1 1 1 5-7 7
E 1 1 1 1 7-9 7-9
*) Average of 2 replication **) Sensory score scale :
1. none 7. severe
3. slight 9. extreme
5. moderate
Table 18 shows that all treatments were able to inhibit decay score up to day 9.
however, on day 12 and 15 decay scores soared from none to severe/extreme in
treatment A and E, while in treatment B, C, and D decay score ranged between
moderate and severe. The results on day 12 and 15 are biased due to power failure
on day 12, causing temperature to rise to 220C. Pantastico et al., (1975) reported that in tropical climates CA-storage and use of PE-bags without refrigeration
cause fast deterioration of fresh produce as a result of heat and CO2 built-up
within the package.
Table 19. Overall Quality Score during Cold Storage at 10oC ± 2oC Overall Quality Score*)**) on Day Treatment
0 3 6 9 12 15
A 9 9 9 7 5 5
B 9 9 9 9 7 5
C 9 9 9 9 7 7
D 9 9 9 9 7 7
E 9 9 9 5 1 1
*) Average of 2 replications **) Sensory score scale :
1. extremely poor 7. good
Table 19 shows that:
a. All treatments could maintain overall quality score of curds in excellent
condition for 6 days.
b. On day 9-15 overall quality score of treatment E (with holes) declined
rapidly and became poor to extremely poor, treatment A (without holes)
also declined but at less severe level, respectively good to fair. The
treatments with ethylene removers were all higher in overall quality score,
with C and D about equal i.e excellent to good and B excellent to fair.
Thus, for storage at 100C±20C MAP with active coal as ethylene remover (C) was the best.
4.3.3. Incidence of Soft Rot
Incidence of soft rot during the 15 day low temperature storage is
presented in Table 20. Regression equations however were undefined.
Table 20. Incidence of Soft Rot at Cold Storage at 100C±20C
Incidence of Soft Rot *) (% no of samples) on Day Treatment
0 3 6 9 12** 15**
A 0 0 0 0 100 100
B 0 0 0 0 100 100
C 0 0 0 0 100 100
D 0 0 0 0 100 100
E 0 0 0 0 100 100
*) Average of 2 replications
**) Power failure overnight (± 15 hours)
All treatment were free of soft-rot up to day 9, but soared up to 100% on
day 12 and 15. On day 12, power failure occurred causing a rise in temperature to
220C, which triggered growth of fungus.
4.3.4. Weight Loss
Weight Loss could not be observed longer than day 9 because on day 12
all treatments showed extensive soft rot of the curd’s stems. This could be the
result of power failure on day 12. Result of regression analyses showed there is
linear relationship between weight loss and storage time in treatment A and D, but
none exist in B, C and E. Regression curves are presented in Figure 5 while
correlation are presented in Table 21. Coefficient of Determination (R2) for A and D ranged between 0.826-0.876 showing sufficiently good fit.
Figure 5. Regression Curves of Weight Loss during Cold Storage at 100C 20C
Table 21. Regression Equations of Weight Loss (% Initial Weight) during Cold Storage at 100C+20C
Treatment Regression Equation R2 r
A Y = 0.103x-0.014 0.876
B Undefined - -
C Undefined - -
D Y =0.071x+0.012 0.826
V. Conclusion
Part (1) : Storage at 3.80C
1. Cold Storage at 3.80C for 12 days of broccoli packed in perforated and
un-perforated poly-bags and each provided with sachet containing
K-permanganate, active coal or K-permanganate and active coal, gave
excellent results, in terms of :
a. Curd surface color: Dark Green (No discoloration/yellowing)
b. Incidence of soft rot : 0% (none)
c. Sensory score
Discoloration : 1 (None)
Decay sensory score : 1-3 (None to slight)
Wilting sensory score : 1-3 (None to slight)
Overall quality sensory score : 9-7 (Extremely good to good) d. Weight loss : low (0.78% – 1.09%)
2. Room Temperature storage (230-270C) for 3 days showed that :
a. Slight curd surface yellowing occurred in both perforated and
un-perforated poly-bags, with slightly more severe yellowing in the former
b. No incidence of soft rot
c. Sensory scores for discoloration, wilting, and decay were lower and
overall quality was higher in the un-perforated bags than in the
perforated ones
d. The ethylene removing chemicals respectively K-permanganate, active
coal and their mixture did not affect yellowing of curd, incidence of soft
rot and sensory scores
Part 2 : Storage at 100C±20C.
1. Curd Surface Color
a) Un-perforated bags inhibited yellowing better
Un-perforated bags : slight yellowing on day 12 and 15
Perforated bags : - yellowing on day 9 and become more severe on day 12 and 15
b) MAP + ethylene removers better than MAP alone
Active coal : best, no yellowing on day 15
Active coal and permanganate : second best, very slight yellowing on day 9, 12 and 15
K-Permanganate : Third best, slight yellowing on day 9, 12 and 15 2. Sensory Scores
a. Discoloration score : - Perforated package worst, on day 6 : 1-5
- Un-perforated + ac best, on day 15 : 1-3
b. Wilting score : - Wilting evident on day 6
- Un-perforated bags better, on day 9 : 1-3
- Active coal higher, wilting score on day 12 : 3-5
c. Decay score : - No decay up to day 9
- Power failure on day 12 increase decay score : 5-7-9
d. Overall quality score : - Un-perforated + ac : best
- Un-perforated better than perforated
- Difference among ethylene removers : very
small
3. Incidence of Soft Rot Score
- Soft rot score up to day 9 : none
- On day 12-15 due to power failure : 100 % soft rot
4. Weight Loss
- Observation limited to day 9 due to soft rot of stems