THE FRONTIER OF SOYBEAN DEVELOPMENT POLICY
Dewa Ketut Sadra Swastika
Pusat Penelitian dan Pengembangan Sosial Ekonomi Pertanian, Jl. A. Yani 70 Bogor
INTRODUCTION
Soybean is the third important food crops after rice and maize. It is a source of healthy vegetable protein. The FAO data showed that per capita consumption of soybean (equivalent dry grain) was decreasing from about 11.38 kg/capita in 1990 to about 8.97 kg/capita in 2004. Nevertheless, the total domestic demand is continuously increasing due to both the food industry and population growths. On the other hands, its production was declining, hence soybean deficit is estimated to steadily increasing. For example, the domestic demand for soybean in 2004 was about 2.02 million tons, while its production was only 0.71 million tons. This condition will likely be continue to happen. In other words, Indonesia will be continuously dependent upon import.
Historically, Indonesia was self sufficient in soybean until 1974, with the sufficiency indices higher than one (Swastika, 1997). After that, Indonesia has become an importing country on soybean, although production was increasing until 1992. The area planted to soybean and production reached their peaks in 1992 about 1.67 million ha and 1.87 million tons, respectively. Since then, the area and production continuously declining. There should be some breakthroughs in order to lowering the dependency of Indonesia on soybean import.
This paper is aimed to describe the past and current status of soybean supply and demand as well as the prospect of soybean development. Another objective is to propose an alternative of policy direction to develop soybean production system.
DOMESTIC PRODUCTION AND CONSUMPTION
Area and Production of Soybean
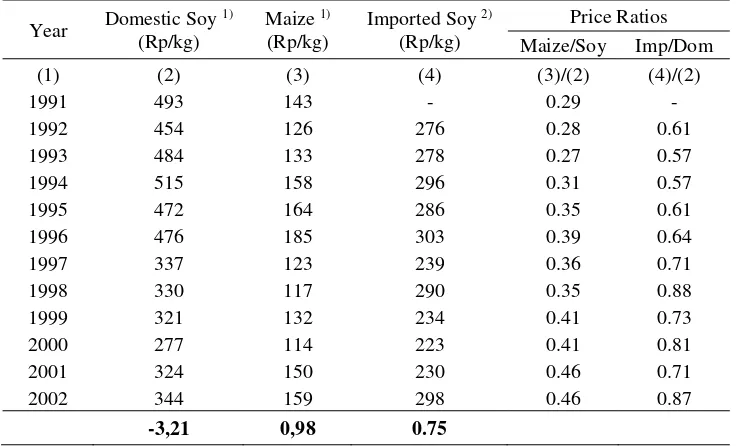
ratio between imported soybeans and domestically produced soybeans during the last decade (1992-2002) always less than one, although tended to increase. The lower price of imported soybean have encouraged increasing import of soybean. As a result, price of domestically produced soybean was declining. This situation discouraged farmers to grow soybean.
Compared to maize (as one of competitive crop), maize price tended to increase at a low rate (0.98%/year), while soybeans price tended to decline by 3.21 percent per year during the same period. This phenomenon indicated that there was an increasing trend of maize competitiveness relative to that of soybean.
The study of Gonzales et al. (1993) showed that soybean was less competitive compared to maize. The study of Ramli and Swastika (2005) reported that soybean in Central Kalimantan was less competitive compared to other secondary crops such as maize, peanuts and sweet potato. Hence, farmers tend to grow other secondary crops since they are more competitive rather than soybean. Therefore, area planted to soybean tends to decline. As shown in Tabel 1, the average growth of area planted to soybean for the last 15 years was –0.02 percent per year.
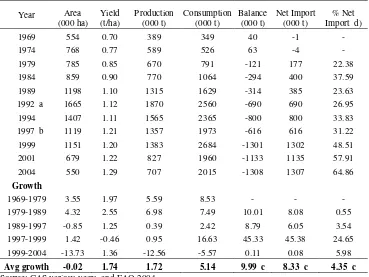
Tabel 1. Soybean Production and Consumption Balance in Indonesia, 1969-2004
Year Area
Source: CAS various years, and FAO 2004.
Similarly to area, the total national soybean production was also fluctuating, and reached its peak about 1.87 million tons in 1992. After then, the national production sharply declined to about 0.71 million tons in 2004. However, in general it was growing at a rate of 1.72 percent per year during the period of 1969-2004, due to yield growth of 1.74 percent per annum.
Table 2. Prices of Soybean and Maize in Indonesia, 1991-2002.
Year Domestic Soy 1) (Rp/kg)
Maize 1) (Rp/kg)
Imported Soy 2) (Rp/kg)
Price Ratios Maize/Soy Imp/Dom
(1) (2) (3) (4) (3)/(2) (4)/(2)
1991 493 143 - 0.29 -
1992 454 126 276 0.28 0.61
1993 484 133 278 0.27 0.57
1994 515 158 296 0.31 0.57
1995 472 164 286 0.35 0.61
1996 476 185 303 0.39 0.64
1997 337 123 239 0.36 0.71
1998 330 117 290 0.35 0.88
1999 321 132 234 0.41 0.73
2000 277 114 223 0.41 0.81
2001 324 150 230 0.46 0.71
2002 344 159 298 0.46 0.87
-3,21 0,98 0.75
Source: 1) FAO, 2005; 2) Ditjentan, 2004.
Consumption
Almost all of soybean (about 94%) in Indonesia is consumed as processed food, consists of fermented and non-fermented products (Swastika et al., 2005). Among fermented products are tempe, soy-sauce, tauco, etc, and the non-fermented products are tofu, soy-milk, soy-oil, snacks, etc. The soybean meal is used for feed, which occupy about 15-20 percent of feed ingredient (Tangendjaja et al., 2003).
per year. Currently, the net import of soybean was about 65 percent to the total domestic demand. On the other hands, soybean meal for feed industry was fully imported.
SOYBEAN DEVELOPMENT POLICY
There is an interesting lesson to learn from the past and current status of soybean production and consumption. It seems that Indonesia in the short and medium terms will not be able to achieve self-sufficiency, although it was obtained before 1975. It is very hard to get back the area planted to soybean more than 1 million ha per year, since in 2004 it was only 0.55 million ha. Similarly, it is also very hard to attain the average yield more than 1.5 tons per ha, since the use of good quality (certified) seed is very limited. Singh (1995) in Nugraha (1996) reported that the use of certified soybean seed in Indonesia was only about 2 percent. Furthermore, Seed Directorate in Siregar (1999) reported that the use of certified soybean seed during 1984-1996 was about 6 percent on average, consisted of blue and orange labels. That is one among other reasons, why the national average yield and production of soybean at national level is still low. On the other hands, the demand for soybean in 2004 was 2.02 million tons, and tends to increase in the future.
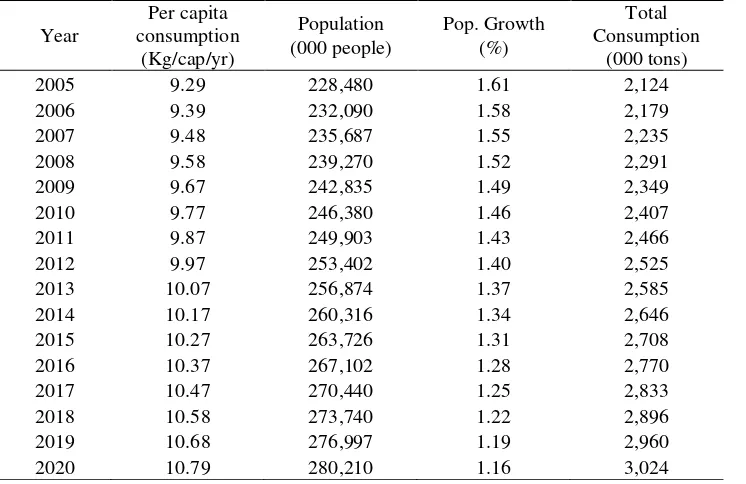
By using the prices and income elasticities resulted from the study of Simatupang et al. (2003), combining with population growth, the projected per capita consumption and total domestic demand for soybean is as depicted in Tabel 3.
As shown in Table 3, the demand for soybean will be increasing from about 2.12 million tons in 2005 to about 2.41 million tons in 2010 and 3.02 million tons in 2020. Let assume that Indonesia needs about 2.5 million tons of maize on average, and an intensive introduction of high yielding varieties resulting into national average yield of 1.5 ton/ha. In this scenario, the area planted to soybean should reach 1.67 million ha, or similar to area in 1992. How to increase area from 0.55 million ha to 1.67 million ha or three times compared to current existing area, is a big question. So that, forcing the program to produce soybean at all cost to obtain self sufficiency is seems to be unrealistic.
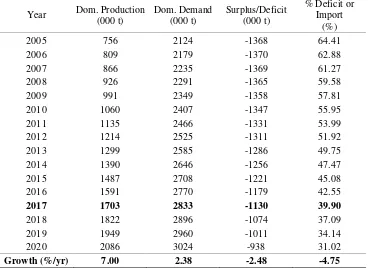
Table 3. The Projected Demand for Soybean in Indonesia, 2005-2020 percent domestic production or 40 percent import will be achieved in 2017, where production is projected to reach 1.70 million tons, while consumption is projected to be 2.88 million tons (Table 4).
The next question is how to achieve this particular production growth? There are two strategic policy to obtain this target, i.e. yield improvement and area expansion. The yield improvement should be done through intensive research and development, in order to create the new high yielding varieties (HYVs). During the 2001-1004 period, at least 11 HYVs have been released by the Indonesian Centre for Food Crops Research and Development (ICFORD), and another two HYVs released by other institutions, as shown in Table 5. In fact, most of area planted to soybean (70%) have used HYVs (Siregar, 1999). However, due to improper quality of seed, the average yield is still low.
Table 4. Projected Production and Consumption of Soybean in Indonesia, 2005-2020
The area expansion on the other hands, should be done through improvement of cropping intensity on irrigated lowland, rain-fed lowland and upland, as well as the use of idle land that potential for soybean cultivation. The location quotient (LQ) could be used as an indicator to find out the suitable land for soybean cultivation, for both improvement of cropping intensity and the use of idle land. Based on this indicator, Yogyakarta, East Java, NTB, Aceh, Lampung, West Java, Central Java, and South Sulawesi are the provinces where area expansion for soybean production could be promoted. These provinces are currently the main production area of soybean.
To support those above strategy, there should be some police efforts, such as:
(1) Provide seed growers, soybean farmers, and small industry (who use soybean as a raw material) with a soft and simple procedure credit.
(2) Speeding up transfer of technology in seed production as well as soybean farming by revitalizing extension services and farmers field training.
(3) Macro policy, i.e imposing import tariff in order to give an incentive for the farmers to grow soybean.
(4) Provide farmers and other businessmen in agriculture with sufficient infrastructures in order to create a good and efficient agribusiness system. (5) Promote more research on development of new high yielding varieties of
soybean, suitable for some agro-ecosystem and tolerant to some biotic and non-biotic stresses.
CONCLUSIONS AND POLICY IMPLICATIONS
From the above discussion, there are some following conclusions and policy implication can be drawn.
1. Based on the past and current status of soybean production and consumption, it seems unrealistic to expect Indonesia achieving self sufficient on soybean in the short and medium terms. Reducing import from about 65 percent to about 40 percent is likely the more applicable as the frontier of policy on soybean production development in the medium even the long terms.
3. To encourage farmers to grow more soybean with a good quality of seed, there should be some policy efforts, such as: provide incentives for seed growers, soybean farmers, and small industry, by imposing import tariff and providing them with soft and simple procedure credit.
4. To promote a well running of agribusiness, the agricultural development should be supported by the development of infrastructures in rural areas.
REFERENCES
Anonimous, 2004. Dukungan Inovasi Teknologi dalam Program Bangkit Kedelai. Puslitbang Tanaman Pangan. Bogor. 36 p.
Anonimous, 2005. Program Pengembangan Kedelai Tahun 2005-2009 dalam Peningkatan Produksi Tanaman Pangan Strategis. Direktorat Jendral Bina Produksi Tanaman pangan. Jakarta.
Gonzales, L.A. , F. Kasryno, N.D. Perez and M.W. Rosegrant. 1993. Economic Incentives and Comparative Advantage in Indonesian Food Crop Production. Reseacrh Report 93. Int’l. Food Policy. Resch. Inst. Washinton.DC.
Nugraha.U.S. 1996. Produksi Benih Kedelai Bermutu Melalui Sistem JABAL dan Partisipasi Petani. Jurnal Penelitian dan Pengembangan Pertanian Vol. XV(2) : 27–35. Badan Litbang Pertanian. Jakarta.
Ramli, R. and D.K.S. Swastika. 2005. Analisis Keunggulan Kompetitif Beberapa Tanaman Palawija di Lahan Pasang Surut Kalimantan Tengah. Jurnal Pengkajian dan Pengembangan Teknologi Pertanian. Vol. 8 (1). Puslitbang Sosial Ekonomi Pertanian. Bogor.
Simatupang, P., B. Sayaka, Saktyannu K.D., S. Mardianto, M. Ariani dan N. Syafa`at. 2003. Analisis Kebijakan Ketahanan Pangan dalam era Globalisasi dan otonomi Daerah. Makalah disampaikan pada Prawidyakarya Nasional Pangan dan Gizi VIII. 14–15 Oktober 2003. Jakarta.
Siregar, M. 1999. Pembinaan Sistem Perbenihan Terpadu. Kasus Komoditas Kedelai. (Improvement of Integrated Seed System : Case Study of Soybean) Forum of Agro-Economic Research. Vol 17(1). Puslitbang Sosial Ekonomi Pertanian. Bogor.
Swastika, D.K.S. 2003. Soybean self-sufficiency in Indonesia: Dream or Reality? Short Article. CGPRT-Flash. Vol.1 (5): UN-ESCAP. Bogor.