CHAPTER III
RESEARCH METHOD
3.1 Research Design
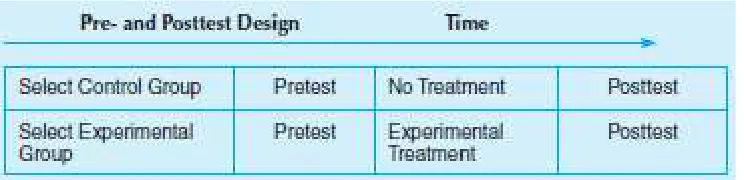
The method was used in this research is quasi-experimental research method with one experimental and control class. The aim of this method was to find out the effect of the systematic manipulation of the one variable and another variable. Creswell (2012:309) defined that the quasi-experimental has pre-test and post-test experimental and control groups, but not random assignment of subjects. A group was given the treatment is experimental group, whereas the other group that have no treatment is control group. This research focused on the result of comparing an experimental class using English cartoon movie as a treatment with the control class did not get a treatment.
Table 3.1 Quasi-Experimental Design
3.2 Location of the Research
The location of this research was in SMP Negeri 01 Kabupaten Tebo. It was one of the Junior High School at Desa Baru in Kabupaten Tebo Regency. The writer chose this school because it is the place where the writer’s graduated.
3.3 Population
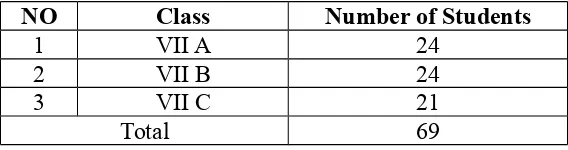
A population is whole element of the object as a data source with a certain characteristic in a research (Tanzeh, 2009:91). It means that population is all subject of the research. The populations of this research are students taken from seventh grade of SMP Negeri 01 Kabupaten Tebo in academic year 2017/2018. The seventh grade consists of 3 classes. The number of the research population was 69 students. The students were divided into three classes; VII A has 24 students, VII B has 24 students, and VII C has 21 students. The research population was in table 3.2 as follows:
Table 3.2 The Population of the Research
NO Class Number of Students
1 VII A 24
2 VII B 24
3 VII C 21
Total 69
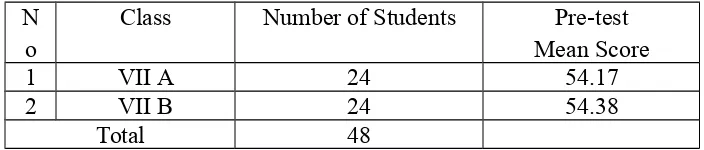
The sample is part of population of the object research (Arikunto, 2006:118). The writer used cluster sampling, because the sample has been group naturally. The writer gave the pre-test to all the classes of the seventh grade students at SMP Negeri 01 Kabupaten Tebo to find out the two classes that have equal score, one class as experimental class and the other class as control class. The writer used compare mean in SPSS v.16 for windows program. The mean score of pre-test result was in table 3.3 below:
Table 3.3 Mean Score of Pre-test Result
Group Mean N
VIII A 54.17 24
VIII B 54.38 24
VIII C 52.12 21
Total 53.57 69
From the table 3.3 the pre-test mean score of three classes of the seventh grade at SMP Negeri 01 Kabupaten Tebo. The mean score of VII A class was 54.17, VII B was 54.38 and VII C was 52.12. Based on the table 3.3, the writer decided that VIIA and VII B had equal mean score. Then, the writer determined VII A as experimental class and VII B as control class.
The sample of the research was in table 3.4 as follows:
According to Freankel and Wallen (2003:41) Variable is something that may vary or differ. Based on explanation above variable is an attribute, characteristic, value of people, object or activity that have certain variation decided by the researcher to learn and conclude. There were two variables in this research. They were Independent Variable (X) and Dependent Variable (Y). This research used English cartoon movie as a medium in teaching of vocabulary had two variables. Those variables are:
1. The independent variable was the teaching through English cartoon movie. 2. The dependent variable was the students’ score of vocabulary test about
the material of vocabulary.
3.5 Procedure of Data Collection
This research was used quantitative data that related to the problem. The data of this research was the student’ score in vocabulary. There are some ways of data collection as follows:
1. The writer administered the try-out test to establish reliability of test items. The try-out tested to VII D at SMP Negeri 01 Kabupaten Tebo as one of the classes which was not include as the research sample.
3. The writer used English cartoon movie as media as treatment to experimental class whereas the control class was not be used English cartoon movie as media to learn vocabulary. The writer gave the treatments to experimental and control class in four meeting.
4. The writer gave the post-test to the experimental and control class in the last meeting to get the result after the treatment given.
5. The writer used Descriptive Statistic and Paired Sample T-test in SPSS v.16 program for windows to analyze the result of pre-test and post-test of the experimental and control class.
6. The writer used Independent Sample T-test of 5% significant level in SPSS v.16 program for windows to analyze the result of post-test, to find out there is any significant effect values of experimental and control class.
3.6 Research Instrument
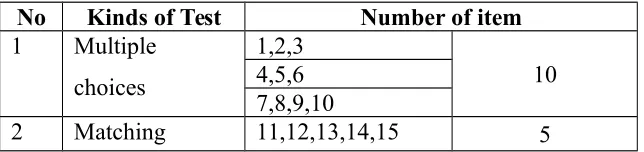
The writer used a test instruments to collect the data. The writer organized the appropriated test on the seventh grade students’ material. The instruments of this research are objective test through vocabulary test, those are pre-test and post-test that consists of 20 items. The specification of post-test items is describes as follows:
Table 3.5 the Specification of the Test
No Kinds of Test Number of item
3 Fill in the blank 16,17,18,19,20 5
Total 20
3.7 Validity and Reliability
The validity was used to analyze the accuracy of this research is content validity because content validity is the degree of a test measure an intended content area. A test may has content validity if it measures special purpose that related to the material given (Arikunto, 2007). The content was called valid if the test represent the lesson material in the seventh grade students at SMP Negeri 01 Kabupaten Tebo, and the test was checked by English teacher of SMP Negeri 01 Kabupaten Tebo. The writer constructed the test with different theme in every meeting. In other word, the writer considered the curriculum which was applied at the school.
This research, the writer investigated the students’ vocabulary mastery. The vocabulary test was in written form. The writer made the appropriated themes of vocabulary test with the material lesson in treatment process in experimental class and control class.
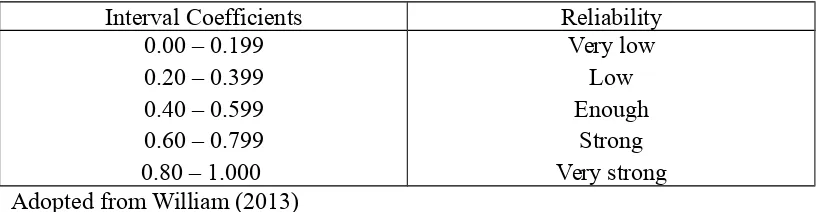
The writer used Cronbach’s Alpha in SPSS v.16 for windows program to measure the reliability coefficients of the test instrument. The instrument is called reliable when the result of Cronbach’s Alpha is equal or more than 0.7. If the result of Cronbach’s Alpha is less than 0.7, it is not reliable. According to William (2013), interpret the coefficients of stability that are between 1 and 0. The interpretation of correlation coefficients was in table 3.6 as follows:
Table 3.6 Interpretation of Correlation Coefficients
The reliability of the test was tried-out to VII D which was not a sample of the research on Thursday 12th October 2017 at. There were 22 students following
the test. The result of test reliability was in table 3.7 as follows:
Table 3.7 Reliability Statistics
Cronbach’s Alpha N of Items
.831 20
3.8 Data Analysis
In experimental research, the data analysis is experimental class and control class that used pre-test and post-test design. It means that there are two variables was investigated in this research, the experiment class is using English cartoon movie as media, and the control class using whiteboard as media. This investigation was known the significant effect before and after teaching by using English cartoon movie as media.
The data obtained input to Statistical Package for the Social Sciences (SPSS). SPSS is a program to statistical in social process. There were some processes to analyze the data in SPSS as follows:
3.8.1 Descriptive Analysis
This research procedure was obtaining descriptive statistic data such as mean, description finding of pre-test and post-test, and standard deviations and description of the demographic finding.
3.8.2 Hypotheses Testing
will be rejected. To test the hypotheses, the researcher used Independent Sample T-test to found out whether there was statistically significant different between the outcomes of post-test between experimental and control class.