UNDERGRADUATE THESIS
This undergraduate thesis is submitted to fulfill of the requirements to obtain the Degree of Bachelor of Education in Faculty of Economics
Yogyakarta State University
By:
Noorrachma Chandra Novianti 11403244020
ACCOUNTING EDUCATION DEPARTMENT FACULTY OF ECONOMICS
i
UNDERGRADUATE THESIS
This undergraduate thesis is submitted to fulfill of the requirements to obtain the Degree of Bachelor of Education in Faculty of Economics
Yogyakarta State University
By:
Noorrachma Chandra Novianti 11403244020
ACCOUNTING EDUCATION DEPARTMENT FACULTY OF ECONOMICS
ii
UNDERGRADUATE THESIS
By:
Noorrachma Chandra Novianti 11403244020
This undergraduate thesis had been approved and validated on September 17th, 2015
To be examined by the Team of Undergraduate Thesis Examination Accounting Education Study Program
Accounting Education Department Faculty of Economics Yogyakarta State University
Approved By: Supervisor,
iii
TEST ITEM ANALYSIS OF THE FINAL EXAMINATION ON ECONOMICS SUBJECT IN GRADE XII IPS SMA NEGERI 1
WONOSARI ACADEMIC YEAR OF 2014/2015
By:
Noorrachma Chandra Novianti NIM. 11403244020
Had beed defended in front of the Examiner Team on September 28h, and had been succesfully passed
THE EXAMINER TEAM
Name Position Signature Date
Dhyah Setyorini, M.Si, Ak Chairman of
Examiner & Examiner ... ... Andian Ari Istiningrum, M.Com Co-examiner &
Secretary ... ... Abdullah Taman, M.Si, Akt Main Examiner ... ...
Yogyakarta, August 2015
Faculty of Economics, Yogyakarta State University Dean
iv
Name : Noorrachma Chandra Novianti
Student ID : 11403244020
Study Program : Accounting Education
Faculty : Economics
Undergraduated Thesis Tittle : TEST ITEM ANALYSIS OF THE FINAL EXAMINATION ON ECONOMICS SUBJECT IN GRADE XII IPS SMA NEGERI 1 WONOSARI ACADEMIC YEAR 2014/2015
Hereby declare that this thesis is my own and original work. According to my knowledge, there is no work or opinions written or published by other, except as reference or citation by following the prevalent procedur of scientific writting.
Yogyakarta, August 11th 2015 The Researcher,
v
1. No matter who, no matter when and where. There is only one happiness in this life, to love and be loved (George Sand)
2. When I hear somebody sigh, “Life is hard”, I am always temped to ask, “Compared to what?” (Sydney Harris)
DEDICATION
With the mercy God the Almighty , this simple work is dedicated to:
1. My beloved parents, Mr. Ir. Purnamajaya, M.UM and Mrs. Prapti Sri Widodo, S.E who always provide me their best support and prayer along my life.
2. My best partner in my life, Dian
Nurliyanto,S.Pd who always gives me support and always next to me everywhere and everytime.
vi
Noorrachma Chandra Novianti 11403244020
ABSTRAK
Penelitian ini bertujuan untuk mengetahui mengetahui kualitas butir soal Ujian Akhir Semester Gasal Mata Pelajaran Ekonomi Kelas XII IPS SMA Negeri 1 Wonosari Tahun Ajaran 2014/2015 yang ditinjau dari segi validitas, reliabilitas, tingkat kesukaran, daya pembeda, dan pola sebaran jawaban.
Penelitian ini merupakan penelitian deskriptif kuantitatif Subjek penelitian ini adalah seluruh siswa kelas XII IPS SMA Negeri Banyumas yang berjumlah 92 siswa. Pengumpulan data dilakukan dengan metode dokumentasi. Data dianalisis dengan program Anates versi 4.0.9.
Hasil analisis menunjukkan bahwa: (1) validitas soal menunjukkan bahwa 33 soal (82,5%) valid, dan 7 soal (17,5%) tidak valid; (2) Reliabilitas soal reliabel dengan nilai 0,87; (3) Tingkat kesukaran soal menunjukkan bahwa tidak ada soal dalam susah, 8 soal (20%) dalam kategori sedang, dan 32 soal (80%) dalam kategori mudah; (4) Daya pembeda soal menunjukkan bahwa 11 soal (27,5%) dalam kategori buruk, 16 soal (40%) dalam kategori cukup, 11 soal (27,5%) dalam kategori baik dan 2 soal (5%) dalam kategori sangat baik; (5) Pola sebaran jawaban soal menunjukkan bahwa 8 soal (20%) sangat baik, 9 soal (22,5%) baik, 8 soal (20%) cukup baik, 6 soal (15%) kurang baik dan 9 soal (22,5%) tidak baik; (6) Analisis soal berdasarkan validitas, tingkat kesukaran, daya pembeda, dan pola sebaran jawaban menunjukkan bahwa 8 soal (20%) dalam kategori baik, 16 soal (40%) dalam kategori kurang baik dan 16 soal (40%) dalam kategori tidak baik
vii
Noorrachma Chandra Novianti 11403244020
ABSTRACT
The purpose of this study was to determine the quality of the Final Examination Questions in Economics Subject in Grade XII IPS SMA Negeri 1 Wonosari Academic Year of 2014/2015 in terms of validity, reliability, level of difficulty, discrimination index, and the pattern of answer distributions.
This research is quantitative descriptive research. The subject of the research are the grade XII IPS SMA Negeri 1 Wonosari whose 92 students. Data collecting was one by documentation method. Data is analyzed by Anates program version 4.0.9.
The analysis shows that: (1) items of questions that can be said as valid totaling 33 items (82.5%), while the invalid items amounted to 7 items (17.5%); (2) items of questions can be said as reliable because the r11 higher than 0.70 or equal to 0.87; (3) items of questions that categorized to easy items are 32 items (80%), medium category 8 items (20%), and no item had a difficult category; (4) items of questions that categorized to poor items are 11 items (27.5%), satisfactory are category 16 items (40%), good category are 11 items (27.5%), and excelent category 2 item (5%); (5) items of question that categorized had distractor that work very good are 8 items (20%), categorized had distractor that work good are 9 items (22.5%), categorized had distractor that work fair are 8 items (20%), categorized had distractor that work less good are 6 items (15%), and categorized had distractor that work not good are 9 items (22.5%); (6) Based on test item analysis according to validity, level of difficulty, discrimination index, and distribution pattern answer that questions contained 8 items (20%) in good categories, 16 items (40%) in the less good category and 16 items (40%) in the category of not good.
viii
this undegraduated thesis entitled “Test Item Analysis of The Final Examination on Economics Subject in Grade XII IPS SMA Negeri 1 Wonosari Academic Year of 2014/2015” has been finished. I realize that it would not have been possible without the support of many people. Therefore, I would like to express my deepest gratitude to the following:
1. Prof. Dr. Rohmat Wahab, M.Pd., M.A., Rector of Yogyakarta States University.
2. Dr. Sugiharsono, M.Si., Dean of Faculty of Economics who had gave the research permission for this undergraduated thesis.
3. Prof. Sukirno, Ph.D., Chairman of the Department of Accounting Education who gave me inspiration.
4. Andian Ari Istiningrum, M. Com., my supervisor who had been kindly supervised me and encouraged me during the research.
5. Abdullah Taman M.Si., my Supervisor resource who give me so much knowledge to this research.
6. Drs. Tamsir, M.Pd., the Headmaster of SMA Negeri 1 Wonosari who had gave me the permission for managing the research in SMA Negeri 1 Wonosari.
ix endless love.
10.My precious mother Prapti Sri Widodo, S.E, thanks for the love, fully support, and a lot of motivations for me
11.My lovely sweet heart, Dian Nurliyanto, S.Pd., thank you for all your love and your time for me.
12.My friends Muhammad Zaenal, S.Pd., Rizky Romadityo, S.Pd., Adif Anityo Sigit, Sigit Muamar, Yasir Ramadhan, Faris Syarifuddin, Febri Nuraini, S.Pd., Diah Tirtapuri who give me many random things.
13.My best sister another mother and father, Mella Retnaningdyah S.Pd., Devita Kusumawanti S.Pd., Indriyani S.Pd., Mutia Arini S.Pd, and Dila Puspa Kencana.
14.All parties who cannot be mentioned individually
May God give the best for all the people mentioned above. Finally, I hope that this work will be useful for the readers.
Yogyakarta, August 11th 2015 Writer,
x
SUPERVISOR VALIDATION PAGE ... ii
VALIDATION PAGE ... iii
MOTTO AND DEDICATION ... iv
DECLARATION PAGE ... v
ABSTRAK ... vi
ABSTRACT ... vii
FOREWORD ... viii
TABLE OF CONTENT ... x
LIST OF TABLE ... xiii
LIST OF FIGURE ... xiv
LIST OF APPENDICES ... xv
CHAPTER IINTRODUCTION ... 1
A. Background of Research Problem ... 1
B. Problem Identification ... 4
C. Problems Restriction ... 5
D. Problems Formulation ... 5
E. Research Objective ... 5
F. Research Benefits ... 5
CHAPTER II LITERATURE REVIEW AND RESEARCH QUESTIONS .... 7
A. Theoritical Review ... 7
1. Describe of Test Item Analysis ... 7
2. Test Item Analysis Techniques ... 8
B. Relevant Research ... 21
C. Framework ... 24
D. Research Paradigm ... 26
xi
D. Research Subject and Object ... 30
E. Data Collection Techniques ... 30
F. Data Analysis Technique ... 30
CHAPTER IV RESEARCH RESULTS AND DISCUSSION ... 35
A. Overview of SMA Negeri 1 Wonosari ... 35
B. Description of Research Data ... 36
C. Research Result ... 37
D. Discussion ... 49
E. Research Limitation ... 59
CHAPTER V RESEARCH CONCLUSION, IMPLICATION AND SUGGESTION ... 60
A. Conclusion ... 60
B. Implication ... 61
C. Suggestion ... 63
REFERENCE ... 64
xii
2. Assessment Criteria of the Use of Destractor ... 34 3. Distribution of Final Exam Based on Content Validity Index ... 38 4. Distribution of Questions in Final Examination on Economics Subject in
Grade XII IPS SMA Negeri 1 Wonosari Academic Year of 2014/2015 based on the validity index ... 42 5. Distribution of Questions in Final Examination on Economics Subject in
Grade XII IPS SMA Negeri 1 Wonosari Academic Year of 2014/2015 based on the difficulty level ... 44 6. Distribution of Questions in Final Examination on Economics Subject in
Grade XII IPS SMA Negeri 1 Wonosari Academic Year of 2014/2015 based on the discrimination index ... 46 7. Distribution of Questions in Final Examination on Economics Subject in
Grade XII IPS SMA Negeri 1 Wonosari Academic Year of 2014/2015 based on the distribution pattern answer ... 48 8. The Overal Results of Test Item Analysis in Final Examination on Economics
Subject in Grade XII IPS SMA Negeri 1 Wonosari Academic Year of 2014/2015 based on Validity, Level of Difficulty, Discrimination Index, and Distribution Pattern Answer ... 57 9. Distribution of questions in Final Examination on Economic Subject Grade
xiii
2. Distribution of Questions in Final Examination on Economics Subject in Grade XII IPS SMA Negeri 1 Wonosari Academic Year of 2014/2015 based on the validity index ... 42 3. Distribution of Questions in Final Examination on Economics Subject in
Grade XII IPS SMA Negeri 1 Wonosari Academic Year of 2014/2015 based on the difficulty level ... 44 4. Distribution of Questions in Final Examination on Economics Subject in
Grade XII IPS SMA Negeri 1 Wonosari Academic Year of 2014/2015 based on the discrimination index ... 46 5. Distribution of Questions in Final Examination on Economics Subject in
Grade XII IPS SMA Negeri 1 Wonosari Academic Year of 2014/2015 based on the distribution pattern answer ... 48 6. The Overal Results of Test Item Analysis in Final Examination on Economics
xiv
LIST OF APPENDIXS
Appendixs Page
1. Questions Framework, Test Questions, Answer Key ... 67 2. Answer Sheets (Data Processed) ... 90 3. Validity, Reliability, Level of Difficulty, Discrimination Index, and Pattern of
1 CHAPTER I INTRODUCTION
A. Background of Research Problem
Education is one of the efforts made to improve the quality of human resources through teaching and training efforts. Improving the quality of education is the most important part in fostering and building a powerful and reliable human resources. Quality of education will be achieved if teaching, learning, and evaluation are effectively implement to reach the optimal learning results.
Teachers play an important role in education which is in the process of learning and evaluation. The main task of the teacher in teaching are preparing the lesson plan, implementing learning processes, assessing learning processes and outcomes obtained through the evaluation results. The learning process is done by delivering material from teacher tostudent by using teaching methods in accordance with the learning objectives.
Evaluation is a process of collecting data to determine how far, in terms of what, and in which part the educational goals have been achieved (Suharsimi, 2013: 3). Evaluation can be used to determine the teachers' level of success in the learning process. In addition to measuring how far the learning objectives have been achieved, the evaluation can also be used to make decisions in improving learning.
(Kusaeri, 2012: 4). Assessment is a systematic procedure and includes the activities of collecting, analyzing, and interpreting information that can be used to make inferences about the characteristics of a person or object (Kusaeri, 2012: 8).
There are two instruments in evaluating the students' learning outcomes in the school, namely evaluation with the test and non-test techniques (Zaenal Arifin, 2012). Based on the interview result with Economics Teacher, said that the test is an evaluation tool that is most often used by teachers to measure students' learning outcomes and to measure the success of the teaching program. Students' learning outcomes can also be used as a reference in making decisions related to the students and the learning process. Therefore, the test must be made correctly.
2013: 77). The test is economical if the implementation is effective and efficient (Suharsimi, 2013: 77).
Teacher needs to conduct a test item analysis to determine the quality of a test. Test item analysis is the study of test statements in order to obtain the question tools that have a good quality (Nana Sudjana, 2011: 135). A test item analysis is an activities of reviewing the questions which are used in the tests, whether it has meet the requirements of a good quality test or not. The test item analysis aims to identify either the question is a good, less good or not a good question. A not good question should be revised or discarded so the test is actually made up of the good quality questions. The test item analysis is done by calculating the aspect of validity, reliability, level of difficulty, discrimination index, and distribution pattern answer.
The questions of the Final Examination in Academic Year of 2014/2015 that were created by Congress Subject Teacher (MGMP) Economics at SMA 1 Wonosari is a new and different to the question tested in the previous academic year, so the test item analysis has not been done yet. Similarly to the previous questions, Economics teacher at SMA Negeri 1 Wonosari can know the quality of the questions based on the answers of students who can answer or who can not answer that question.
reliability, level of difficulty, discrimination index, and distribution pattern answer is not certain yet. The good quality of question can show the real condition of the students. The results of the evaluation will provide feedback information about the students towards learning, the learning progress of students, and learning programs, as well as the next actions that will be take.
Based on the background of the study above, researcher interested in conducting research related to the analysis of the test evaluation of students with the title: "Test Item Analysis of The Final Examination on Economics Subject in Grade XII IPS SMA 1 Wonosari Academic Year of 2014/2015". B. Problem Identification
From the background of the study that have been stated above, can be identified several problems that can be studied:
1. The economics teacher have not done the test item analysis that are used to evaluate the students of Grade XII IPS.
2. The economics teacher have limitations in conducting the test item analysis as well as in abilities and energy.
3. Teachers know the quality of the questions based on the answers of the students.
4. The quality of test items in economics subjects at SMA 1 Wonosari have not known certainly.
C. Problem Restriction
Questions in Economics Subject in Grade XII IPS SMA Negeri 1 Wonosari Academic Year of 2014/2015 the terms of validity, reliability, level of difficulty, discrimination index and distribution pattern answer.
D. Problems Formulation
Based on the description above, the formulation of the problem in this research are:
How is the test quality of the questions of the Final Examination Questions in Economics Subject in Grade XII IPS SMA Negeri 1 Wonosari Academic Year of 2014/2015?
E. Research Objectives
Based on the formulation of the problem above, the purpose of this study is to determine the test quality of the questions of the Final Examination Questions in Economics Subject in Grade XII IPS SMA Negeri 1 Wonosari Academic Year of 2014/2015.
F. Research Benefits
The results of this research are expected to give benefits as follows: 1. Theoretically
The results of this study can be used as a reference and consideration for future research.
2. Practically
a. For The Teacher
teachers to be able to conduct the test item analysis in question which are used to improve the quality of the tests.
b. For The Researcher
7 CHAPTER II
LITERATURE REVIEW AND RESEARCH QUESTIONS
A. Theoritical Review
1. Describe of Test Item Analysis
Analysis is the identification process of each item to get feedback to make improvements, enhancements, and refinements of the test items (Anas Sudjiono, 2011: 269-370). According to Nana Sudjana (2011: 135), test item analysis is the statement of tests in order to obtain the questions that have an adequate quality. Another opinion of Suharsimi (2013: 205) reveals that the test item analysis is a systematic procedure that will provide very specific information to the test items that we arrange. According to Daryanto (2008: 179) the aim of test item analysis is to make an identification of the question of the test, to be a good, not good, and bad questions. Then, get the guidance to make improvements.
An analysis of each item aimed to obtain the important information, which basically would be an useful feedback to make improvements, enhancements, and refinements to those items that have been issued in the achievement test, so in future tests of learning outcomes are arranged or designed by the evaluator who can evaluates learning outcomes that have good quality. The objective of test item analysis according to Gennaro Costagliola, are:
c. Modify the item, for poor items whose defect is originated by a well-known cause. In this case, the system also provides the tutor with suggestions on how to modify the item.
(Costagliola and fuccella, 2009: 64) One of the most effective way to improve the teaching and learning process is by evaluating the test results of learning outcome obtained from the teaching and learning process itself. A way that can be taken is by processing the test results to see which components that still weak. Processing the test of learning outcomes in order to improve the teaching and learning activities can be done by making the test item analysis. Test item analysis in quantitative include validity, reliability, level of difficulty, discrimination index and distribution pattern answer.
2. Test Item Analysis Techniques a. Validity
doing the measurements, which means that the measurement results are accurately reflect the true facts or circumstances of what is being measured. The determination of a learning outcomes test that have a validity or accuracy power may be conducted of two sides, namely: 1) Validity of The Test
The validity of the test concern on overall questions. The validity of the test can be seen from the results of using logic and reasoning from the experience or empirical reality.
a) Rational Validity (Logical)
According to Anas Sudijono (2011: 164), rational validity is the validity obtained based on the ideas, the validity of which is obtained by thinking logically. So, achievement test can be said to have had a rational validity if after rational analysis turns out that the achievement test is (rationally) correct has been able to measure what should be measured. There are two kinds of rational validity (logical), namely:
(1) Content Validity
validity if measure specific purpose which is parallel to the subject matter or content provided.
(2) Construct Validity
A test is said to have construct validity when those items that build these tests measure every aspect of thinking as mentioned in the specific instructional objectives (Suharsimi, 2013: 83). If logically or rationally, the analyzing results show that aspects of thinking that is expressed through the test items of learning outcomes was accurately reflect the aspects of thinking. that the specific instructional objectives were ordered to be revealed. So, the test results of the study can be said as valid in terms of its structure or has a construct validity.
b) Empirical Validity
precisely measure the learning outcomes that should be disclosed or measured by the achievement test. There are two kinds of empirical validity, namely:
A test is said to have predictive validity if it has the ability to predict what will happen in the future. For example, college entrance test is a test which is able to predict the success of the test participants in attending lectures in the future. Candidates are filtered based on the results of the test which expected to reflect the high or low ability to attend lectures. High test scores can guarantee their success in the future, otherwise a candidate who does not pass the test because it is said to have a low test scores are expected to cannot follow the upcoming lectures.
(1) Comparative Validity
Test as a measurement tool can be said to have had the comparative validity if the tests in the same period and in exact been able to demonstrate the existence of unidirectional relationship, between the first to the next tests (Anas Sudjiono, 2011: 176).
2) Item Validity
integral part of the test as a totality), to measure what should be measured through the grain of the item. The greater support given by the grain items (as an integral part of the test) to the test of learning outcomes (as a totality), the test will be more able to show the preponderance. Conversely, the smaller support provided by each item of the test as a totality, the test becomes increasingly less stable. The item validity can be identified by seeing the size of support provided by each item in question to the test as a whole.
In this study, to quantify the item validity, used the point biserial correlation formula:
���� = ��− �� √
Notes :
���� = biserial correlation coefficient
�� = mean scores of subjects who responded well to the
item they are looking for � = The mean of total score
� = Standard deviation of the total score
= The proportion of students who answered correctly = The proportion of students who answered incorrectly
(q=1-p)
b. Reliability
Reliability is the accuracy of a test if tested to the same subject (Suharsimi, 2013: 101). According to Nana Sudjana (2005: 16), reliability refers to the accuracy or constancy of a measuring instrument to assess what is judged. So a test is said to have reliability when the test is used to measure repeatedly then the result will remain the same. Determination of the reliability of learning outcomes' test results according to Suharsimi (2013) can be done by using three kinds of methods as follows:
1) Method of Parallel Form (Equivalent)
The parallel or equivalent tests are two tests that have a common purpose, level of difficulty, and composition, but have a different grains (Suharsimi, 2013: 105). This method is deemed better than other methods because:
a) Grains of items made similar but not identical, so the achievement test (that will be tested the reliability of it) can avoid the possibility of influence inside the testee, namely the effect of exercise or memorization.
The weakness of this method is that the tester must work harder because they have to prepare two tests and take a long time to try out these tests. In the implementation of reliability testing using parallel methods, the scores obtained from the second series of tests was sought correlations. If there is a significant positive correlation, it can be said that the test results of learning outcome is reliable.
2) Test-Retest Method
Retest method done to avoid the preparation of two series of tests. In using this method, tester only has one series of tests but tested twice. Then the results of both tests are calculated its correlation. In general, the results of the second test tends to be better than the results of the first test, but the more important thing is the alignment results or determination results shown by the high correlation coefficient.
3) Split-Half Method
a) Odd-Even Cleavage
The first step is to divide the even and odd items. Then, to determine the reliability of the entire test, used the Spearman-Brown formula, as follows:
= ⁄ ⁄
+ ⁄ ⁄
Notes:
⁄ ⁄ = correlation between the scores of each parts of the test
= adjusted reliability coefficient
(Suharsimi, 2013: 110) b) Early-End Cleavage
The first step is divide the early and end items, namely half of the amount at the early numbers and half of the amount at the end numbers. Then, to determine the reliability of the entire test used Spearman-Brown formula as in the even-odd cleavage.
c) Use The Flanagon Formula
The formula that can be used to calculate the reliability of the test, namely:
= � − � �
Notes:
= Reliability of the test
� = The variance of the first parts (1) that in this case is the variance of scores in odd item
� = total variance is the variance of total score
(Suharsimi, 2013: 111) d) Use The Rulon Formula
= −�� �
Notes:
= Reliability of the test �� = Varians difference
= Difference, is the difference between the scores of the first parts (early) with a score of parts of the second (end)
(Suharsimi, 2013: 113) e) Use The K-R 20 Formula
= − � − ∑�
Notes:
= overall reliability of the test
P = the proportion of subjects who answered the item correctly
Q = the proportion of subjects who answered the item incorrectly (1-p)
∑ = the amount of the multiplication of p and q
N = number of items
S = standard deviation of the test (the root of variance)
(Suharsimi, 2013: 115) f) Use The K-R 21 Formula
= − � − �
�
Notes:
M = mean or average of total score
g) Use The Hyot Formula
= −�� or = −� − � �
Notes:
= overall reliability of the test
� = variance of respondents
� = residual variance
(Suharsimi, 2013: 117)
Interpretation of the coefficient of reliability test is generally used benchmark as follows:
(1) If r11is equal to or greater than 0,70 means that the test of learning outcome that is being tested its reliability has a high reliability (reliable).
(2) If r11 is less than 0,70 means that the test of learning outcome that is being tested its reliability did not have a high reliability (unreliable).
c. Level of Difficulty
Good question is a question that is not too difficult and not too easy (Suharsimi, 2013: 222). The same opinion was expressed by Anas Sudjiono (2011: 307), the test item can be said as a good item if the item is not too difficult and not too easy, in other words the level of difficulty of the items is medium or sufficient. The question which is too easy will not stimulate learners to heighten efforts to solve it. Too difficult question will causes students become desperate and do not have the spirit to try again because beyond his reach. The level of difficulty is seen from the ability of learners to answer it, not from the standpoint of the teacher as a question maker. The analysis technique to determine the level of difficulty is by using the following formula:
� =���
Notes:
P = index of difficulty
B = the number of students who answered the question correctly
JS = the total number of student who participated in test
(Suharsimi, 2013: 223) The criteria of difficulty index of questions are as follows:
P > 0,71 = easy category of question 0,31 – 0,70 = medium category of question P < 0,30 = difficult category of question
difficulty index from 0.31 to 0.70, it can be said as the good question.
d. Discrimination index
According to Daryanto (2007: 183), discrimination index is the ability of a question to distinguish between students who are good (have a high ability) with the less good students (have a low ability). According to Nana Sudjana (2005: 141), the discrimination index analysis examine those question items in order to know about the ability to distinguish students who are classified as good (have a high performance) with students who are classified as less or weak performance. Ngalim Purwanto (2009: 120) also revealed that the discrimination index is about the ability to distinguish students who can be classified into smart group with students that classified into less smart group". Thus, when the question is given to children who are able to do it, the results demonstrate a high achievement, and when given to students who are weak, the result is low. Tests with no distinguishing features will not produce the results in accordance with the actual ability of learners.
� =�� −�� = � − �
Notes:
D = discrimination index
� = number of participants in upper group who
answered questions correctly
� = number of participants in upper group who
answered questions incorrectly
J = number of test participants
� = number of participants in upper group � = number of participants in lower group
� −�� = proportion of participants in upper group who answered questions correctly � −�� = proportion of participants in lower group who answered questions correctly (Suharsimi, 2013: 228) Classification of discrimination index are as follows:
D = 0,00 - 0,19 = poor
D = 0,20 – 0,39 = satisfactory D = 0,40 – 0,69 = good D = 0,70 – 1,00 = excellent
(Suharsimi, 2009: 232) The higher coefficient of discrimination index of a test item, the more ability of test item to distinguish students who master the material with students who did not master the material.
e. Distribution Pattern Answers
the distribution of testee in determining their chosen answer on the form of multiple choice questions. Distribution Pattern Answer gained by counting the number of testee who chose the answer of a, b, c, d, e, or who do not have any choice (omit).
From the distribution pattern answer can be determined whether the detractors function as well or not. A chosen answers (humbug) can be said to function well if the detractors at least chosen by 5% of all test participants.
B. Relevant Researches
1. Research conducted by Aditya Melia Nugrahanti in 2013 entitled: “Analisis Butir Soal Ujian Akhir Semester Gasal Mata Pelajaran
Akuntansi Keuangan Kelas XI Kompetensi Keahlian Akuntansi SMK
Negeri 1 Yogyakarta Tahun Ajaran 2012/2013”. In that study, the results
16,67%, and the criteria of not good at 6,67%.The similarities of this research with research conducted by Aditya Melia Nugrahanti is equally as a quantitative descriptive research and researching about the test item analysis in Final Examination. While the difference located in the research place and subject, the research of Aditya Melia Nufrahanti is performed on the Financial Accounting Subject in Accounting Skills Competency Grade XI SMK Negeri 1 Yogyakarta.
2. Research conducted by Nur Hidayati Indra Rukmana in 2013 entitled: “Analisis Butir Soal Ujian Akhir Semester Gasal Mata Pelajaran Teori
Kejuruan Kelas XI Akuntansi SMK YPKK 1 Gamping Tahun Ajaran
2012/2013”. In that study, the results showed that: (1) In terms of
quantitative descriptive research and researching about the test item analysis in Final Examination. While the difference located in the research place and subject, the research of Nur Hidayati Indra Rukmana is performed on the Vocational Theory Subject in Grade XI Accounting SMK YPKK 1 Gamping.
3. Research conducted by Tri Setya Ernawati in 2013 entitled: “Analisis Butir Soal Ujian Akhir Semester Ganjil Buatan Guru Akuntansi Program
Keahlian Akuntansi Kelas X Di SMK Negeri 1 Bantul Tahun Ajaran
2012/2013”. In that study, the results showed that: (1) In terms of
Setya Ernawati is the analysis performed on a question made by accounting teacherin Accounting Expertise Program in Grade X A SMK Negeri 1 Bantul.
C. Framework
A teacher must have the knowledge and skills to carry out an evaluation of the process and the students' learning outcomes. Assessment activities that included in the evaluation activities are planning and implementing assessment as well as process and analyze the results of the assessment. The evaluation will provide to the teachers an information about the development of learners and the success of learning process in realizing the goal of learning itself. Information from this evaluation also serves to reference the teachers and other interested parties in decisions making relating to the learners.
This activity is useful to assist teachers in analyzing about the questions of Final Examination in Economics Subject of Grade XII IPS academic year of 2014/2015 in SMA 1 Wonosari because the question is still have a questionable quality because it has not done the test item analysis. A test results obtained from not qualified questions certainly can not be a true reflection of the achievements of learners concerned. Test item analysis that will be done including the validity, reliability, discrimination index, level of difficulty, and the distribution pattern of answers.
is function properly as a measurement tool or provide measurement results in accordance with the purpose in doing the measurement. Reliability is the measurement to determine the level or degree of consistent a test device. A test is said to be reliable if the test gives the same result when given to the same group of learners at different times. Analyze the level of difficulty of questions means reviewing questions which includes easy, medium, and hard. The difficulty level of questions is indicated by the index of difficulty level of the question ranging from 0.00 to 1.00, the closer to 1.00, the easier level of question. Discrimination indexwill review the test questions in terms of the ability of these tests to distinguish students who fall into the category of low and high achievement. Effectiveness humbug (detractors) can be determined by looking at the distribution pattern of the answers of learners. From the distribution pattern of the answers can be determined whether or not the detractors function properly. Good detractors characterized by chosen by at least 5% of the test participants.
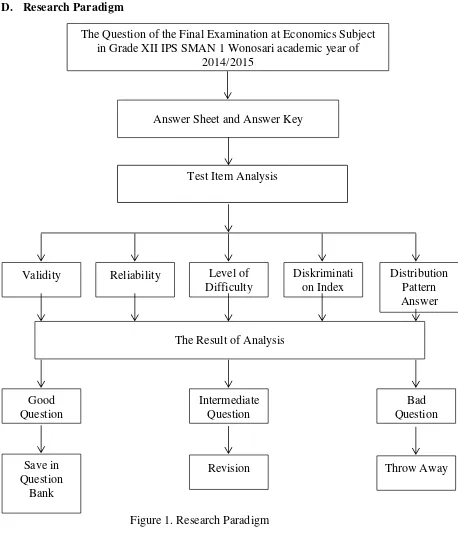
D. Research Paradigm
Figure 1. Research Paradigm
The Question of the Final Examination at Economics Subject in Grade XII IPS SMAN 1 Wonosari academic year of
2014/2015
Answer Sheet and Answer Key
Validity Reliability Level of
Difficulty
Diskriminati on Index
Distribution Pattern Answer Test Item Analysis
The Result of Analysis
Good Question
Intermediate Question
Bad Question
Save in Question
Bank
E. Research Questions
Based on the theoretical review and research framework above, the research questions are:
1. How does the validity level of the questions in the Final Examination at Economics Subject in Grade XII IPS SMA Negeri 1 Wonosari academic year of 2014/2015?
2. How does the reliability level of the questions in the Final Examination at Economics Subject in Grade XII IPS SMA Negeri 1 Wonosari academic year of 2014/2015?
3. How does the level of difficulty of the questions in the Final Examination at Economics Subject in Grade XII IPS SMA Negeri 1 Wonosari academic year of 2014/2015?
4. How does the discrimination indexof the questions in the Final Examination at Economics Subject in Grade XII IPS SMA Negeri 1 Wonosari academic year of 2014/2015?
5. How does the distribution pattern answer of the questions in the Final Examination at Economics Subject in Grade XII IPS SMA Negeri 1 Wonosari academic year of 2014/2015?
28 CHAPTER III RESEARCH METHODS
A. Research Place and Time
This research was conducted in SMA Negeri 1 Wonosari which is located at Jalan Brigjen Katamso No. 04, Wonosari Gunung Kidul, Yogyakarta. Implementation of data collection conducted in March 2015. B. Research Design
This research is a evaliatif research. In practice, this research intends to seek information and data that can be used to describe the quality of the test in SMA Negeri 1 Wonosari. While the approach used is a quantitative approach because the data obtained will be realized in the form of figures and analyzed using ANATES program version 4.0.9.
C. Operational Definition of Research Variables
The variables in the research entitled “Test Item Analysis of The Final Examination on Economics Subject in Grade XII IPS SMA 1 Wonosari Academic Year of 2014/2015” include :
1. Validity
2. Reliability
Reliability is the measurement to determine the level of constancy of test scores or determine the level of correlation among items. High and low reliability of the test can be determined by looking at the size of the coefficient of reliability of the test. The higher coefficient, more reliable the test is.
3. Level of Difficulty
The difficulty level is an opportunity to answer a question correctly on the certain level of capabilities that are usually expressed in the form of an index. The test item can be expressed as a good item if the item is not too difficult and not too easy, in other words the level of difficulty is medium or sufficient.
4. Discrimination index
Discrimination index is the ability of items to distinguish students who have mastered the material with learners who lack or have not mastered the material. The higher coefficient of distinguishing an item, the more ability if the item to distinguish between students who master the material to students who did not master the material.
5. Distribution Pattern of Answer
d, e, or do not select anything. From the distribution pattern of answercan be obtained information whether detractors has a good function or not. D. Research Subject and Object
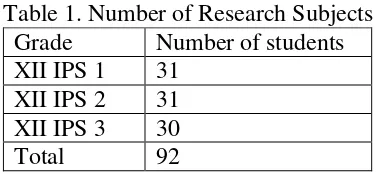
The subjects in this research were students of Grade XII IPS SMA Negeri 1 Wonosari consisting of 3 (three) classes. Details of the number of research subjects are as follows:
Table 1. Number of Research Subjects
Grade Number of students
XII IPS 1 31
XII IPS 2 31
XII IPS 3 30
Total 92
The object of this research is the question of Final Examination in Economy Subject of Grade XII IPS SMA Negeri 1 Wonosari Academic Year of 2014/2015.
E. Data Collection Technique
The data collection technique is a way to obtain data in accordance with the type of data required. In this research, the data collection technique used is the documentation. This technique is used to get the questions of Final Examination in Economy Subject of Grade XII IPS SMA Negeri 1 Wonosari with answer keys and the answer of all students in grade XII IPS.
F. Data Analysis Technique
each answer of learners. Scoring scale is 0-1, a score of 0 for incorrect answers, while a score of 1 for the correct answer. The data is then analyzed include:
1. Validity
The validity of the items was calculated using the point biserial correlation formula:
���� = ��− �� √
Notes :
���� = biserial correlation coefficient
��
= The mean score of the subjects answered correctly for the item they are looking for
� = The mean of total score
� = The standard deviation of the total score
= The proportion of students who answered correctly
= The proportion of students who answered incorrectly (q=1-p) (Suharsimi, 2013: 93) Point biserial correlation index (����) obtained from the calculation consulted with r table at a significance level of 5% in accordance with the number of students who researched.
2. Reliability
Overall reliability of the test is calculated by the split-half formula
= ⁄ ⁄
+ ⁄ ⁄
Notes:
⁄ ⁄ = correlation between the scores of each parts of the test
= adjusted reliability coefficient
Interpretation of the coefficient of reliability test is generally used benchmark as follows:
(1) If r11is equal to or greater than 0,70 means that the test of learning outcome that is being tested its reliability has a high reliability (reliable).
(2) If r11 is less than 0,70 means that the test of learning outcome that is being tested its reliability did not have a high reliability (unreliable).
(Anas Sudijono, 2011: 209) The higher coefficient reliability of the test, the higher level or degree of consistency in a test instrument. Tests can be said as reliable if has a coefficient equal to or greater than 0.70.
3. Level of Difficulty
The difficulty level can be calculated using the formula: � =���
Notes:
P = index of difficulty
B = the number of students who answered the question correctly JS = the total number of student who participated in test
(Suharsimi, 2013: 223) The criteria of difficulty index of questions are as follows:
P > 0,71 = easy category of question 0,31 – 0,70 = medium category of question P < 0,30 = difficult category of question
A question item can be specified as a good item if it was not too hard and not too easy, in other words the difficulty index of the question is categorized as medium or sufficient.
4. Discrimination index
The discrimination index can be calculated using the formula: � =�� −�� = � − �
Notes:
D = discrimination index
� = number of participants in upper group who answered questions correctly
� = number of participants in upper group who answered questions incorrectly
J = number of test participants
� = number of participants in upper group � = number of participants in lower group
� −�� = proportion of participants in upper group who answered questions correctly � −�� = proportion of participants in lower group who answered questions correctly (Suharsimi, 2013: 228) Classification of discrimination index are as follows:
D = 0,00 - 0,19 = poor
D = 0,20 – 0,39 = satisfactory D = 0,40 – 0,69 = good D = 0,70 – 1,00 = excellent
(Suharsimi, 2013: 232) The higher coefficient of discrimination index of a test item, the more ability of test item to distinguish students who have a low or high ability. 5. Distribution Pattern of Answer
information about whether detractors is functioning properly or not. The destractors can function well if at least chosen by 5% of all learners who participate in test.The quality of distractor can be identified by the following formula:
= ℎ ℎ ℎ ℎ ℎ � � × %
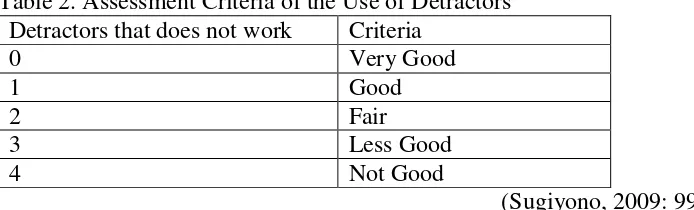
Criteria for assessing the use of detractors adapted from Likert Scale is as follows:
Table 2. Assessment Criteria of the Use of Detractors Detractors that does not work Criteria
0 Very Good
1 Good
2 Fair
3 Less Good
4 Not Good
(Sugiyono, 2009: 99) The conclusions of differential function are :
a. Said to be very good if the distractor on the question is of overall functioning.
b. Said to be good if the distractor on the question is not functioning only in one alternative.
c. Said enough when distractor on the question is not functioning in two alternatives.
d. Said to be less good when the distractor on the question did not functioning in three alternatives
e. Said to be not good if the distractor is not functioning in four alternatives.
35 CHAPTER IV
RESEARCH RESULTS AND DISCUSSION
A. Overview of SMA Negeri 1 Wonosari
Schools were used for this research is the SMA Negeri 1 Wonosari which is located at Jalan Brigjen Katamso 04, Wonosari, Gunungkidul. SMA Negeri 1 Wonosari has a variety of facilities and infrastructure to support the learning process including classrooms, teachers, libraries, laboratories, mosques, courts, and so on. SMA Negeri 1 Wonosari has the vision and mission, namely:
VISION
SMA 1 WONOSARI is reliable on to create the proud students and realize themselves as parts of international societies who have courtesy and prestige values.
Indicators of Vision:
1. Praiseworthy charracters,
2. Technology and science mastery, 3. Fluency in speaking foreign languages, 4. Esthetic and quality oriented,
10. Positive public images. MISSION
1. Implement education, coaching, and training effectively to develop the intellect, heart, and physical resources optimally so that students become human being who has Indonesian identity and conscious as part of the international community.
2. Engage students in the process of problem solving so that students are prepared to face the changes at the local, national, regional and international.
3. Implementing environmental awareness programs effectively to increase students' consciousness of the importance of sustainability and preservation of the environment.
4. Improve the capacity of human and non-human resources so that schools are able to provide international-standard services.
5. Improve public image as an international-standard schools that are ready to take the students to face the global era.
B. Description of Research Results
Grade XII IPS SMAN 1 Wonosari academic year of 2014/2015 consisting of 40 multiple choice questions followed by 92 students of grade XII IPS.
Data obtained using the method of documentation including the question of Final Examination Economics Subject at Grade XII IPS SMAN 1 Wonosari academic year of 2014/2015 which consisted of three standards of competence, namely to understand the preparation of accounting cycle in services company, understand the preparation of the accounting cycle in trading company and Closing accounting cycle in trading company; framework of questions, answer key, and answer sheets of students. Furthermore, the data were analyzed using the program ANATES program version 4.0.9 to determine the quality of items based on the criteria of validity, reliability, level of diviculty, discrimination index, and distribution of pattern answer.
C. Research Results
The results obtained from test items analysis of Final Examination Economics Subject at Grade XII IPS SMAN 1 Wonosari academic year of 2014/2015 are as follows:
1. Validity
competencies. This suggests that the content validity of the question in Final Examination Economics Subject Grade XII IPS SMAN 1 Wonosari academic year of 2014/2015 included in the category of questions that have good validity.
In an item validity testing, the questions of Final Examination Economics Subject Grade XII IPS SMAN 1 Wonosari academic year of 2014/2015 done with point biserial correlation formula (���� obtained from the calculation consulted with significance of rtable at the level of 5%. At the significance level of 5% with n = 92 obtained rtable value of 0.207. Results of research and analysis on the validity of the items in the questions of Final Examination on Economics Subject Grade XII IPS SMAN 1 Wonosari academic year of 2014/2015 based on criteria of����≥ 0.205 that means the items are valid and if ����<0.205 then the matter is invalid.
Table4. Distribution of the question in Final Examination on Economic Subject Grade XII IPS SMAN 1 Wonosari academic year of 2014/2015 by item validity index
No. Validity Index Item Number Total Percentage
1. < 0,205
(Item is invalid)
2, 5, 7, 15, 16, 19, 20 7 17.5% 2. ≥ 0,205
(Item is valid)
1, 3, 4, 6, 8, 9, 10, 11, 12, 13, 14, 17, 18, 21, 22, 23, 24, 25, 26, 27, 28, 29, 30, 31, 32, 33, 34, 35, 36, 37, 38, 39, 40
33 82.5%
Source : Primary Data
Figure2. Distribution of the question in Final Examination on Economic Subject Grade XII IPS SMAN 1 Wonosari academic year of 2014/2015 by item validity index
Based on the analysis above, it can be said that the distribution of the question in Final Examination Economic Subject Grade XII IPS SMAN 1 Wonosari academic year of 2014/2015 based on validity index of the items is an item that is not good based on its item validity.
Valid 82,5% Invalid
17,5%
2. Reliability
Results of research and analysis on the reliability of the distribution in Final Examination Economic Subject Grade XII IPS SMAN 1 Wonosari academic year of 2014/2015 based on the reliability index criteria by r11≥ 0.70 so the item being tested has a high reliability, while if r11<0.70 then the item being tested has a low reliability or unreliable. From the overall calculation known that the question of Final Examination in Economics Subject Grade XII IPS SMAN 1 Wonosari academic year of 2014/2015 has r11 that higher than 0.70 or equal to 0.87 so that the item is said to be reliable.
3. Level of Difficulty
Classification is used to interpret the results of the calculation of the level of difficulty is 0.71-1 include to the item in easy categories; 0.31-0.70 include to the item in medium categories; and 0.00-0.30 include to the difficult categories.
Table5. Distribution of question in Final Examination of Economic
Figure3. Distribution of question in Final Examination of Economic Subject Grade XII IPS SMAN 1 Wonosari academic year of 2014/2015 based on the level of difficulty
Based on the analysis above, it can be said that the question of Final Examination in Economics Subject Grade XII IPS SMAN 1 Wonosari academic year of 2014/2015 is an item that is not good seen
from the level of difficulties because most questions are categorized into easy category.
4. Discrimination Index
Classification is used to interpret the results of the calculation of discrimination index namely 0.00 to 0.19 are included in the category of poor; 0.20 to 0.39 are included in the category of satisfactory; 0.40 to 0.69 are included in good categories; and 0.70 to 1.00 are included in the excellent category.
Table6. Distribution of questions in Final Examination Economics
Figure4. Distribution of questions in Final Examination Economics Subject Grade XII IPS SMAN 1 Wonosari academic year of 2014/2015 based on discrimination index
5. Distribution Pattern Answer
Table7. Distribution of question in Final Examination of Economics
Figure5. Distribution of question in Final Examination of Economics Subject Grade XII IPS SMAN 1 Wonosari academic year of 2014/2015 based on distribution patterns answers.
D. Discussion 1. Validity
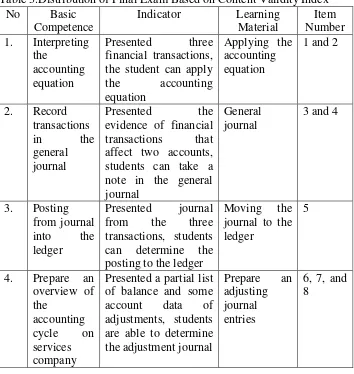
Validity testing can be done in two ways, namely with the content validity and item validity. Content validity can be determined by looking at the questions framework, whether the items of the questions are in accordance with the indicators achieved.
Validity of the items is done by calculating using biserial point correlation formula. Index point biserial (����) obtained from the calculation consulted with rtable on significance level of 5%. The research results indicate that there are 92 students of Grade XII IPS SMAN 1 Wonosari so that n = 92, rtable value indicates the number 0.205. If ����more than or equal to rtable then the item was valid. So, the question of Final Examination in Economics Subject Grade XII IPS SMAN 1 Wonosari academic year of 2014/2015 will be valid if ���� ≥ 0.205.
The results showed that there are 23 valid items (82.5%) and included into category of good questions. While questions that are invalid are 7 items (17.5%) and included into the category of not good questions. Invalid items should be revised and valid items can be reused. Based on these descriptions, it can be concluded that the question of Final Examination in Economics Subject Grade XII IPS SMAN 1 Wonosari academic year of 2014/2015 included into good questions in terms of validity.
According to Anas Sudjiono (2011: 183), the item test which has a high quality, reflecting that the item test has had capability to measure what should be measured. The item test which has a low validity, reflecting the item test was invalid thus should be done revision for this item test.
The valid questions should be maintained by storing the question in the question bank. Invalid items should be improved. Items may be valid because it has good construction and includes the learning material that truly represents the measuring target.
2. Reliability
or reliable, but if r11<0.70 then the item being tested has a low reliability or unreliable.
The results showed that the overall reliability of the is 0.87. Based on these calculations, it can be concluded that the question of Final Examination in Economics Subject of Grade XII IPS SMAN 1 Wonosari academic year of 2014/2015 include have a high reliability or reliable, because the value of r11 ≥ 0.70, so the result will not be steady or can not change if tested again in the same group.
According to Suharsimi Arikunto (2013: 72) the question will have a good quality if it has a high level of validity and reliability so are able to give an idea about the aspects of students' knowledge in the real condition as well as trustworthy as a measuring instrument. According to Zainal Arifin (2013: 259) there four factors that affect the reliability of the test are: legth of test, spread of scores, difficult indexs, and objectivity. Results were accordance with the theory, because the questions is declared valid and reliable. The results of reliability the questions made by teacher can be saved on question bank.
3. Level of Difficulty
in learning. While items that are difficult will make studentshave no motivation in learning.
From the analysis result, it is known that there are 32 items (80%) included in easy category, 8 items (20%) in medium category, and no items in difficult category. Based on the description, it can be concluded that the question of Final Examination in Economics Subject Grade XII IPS SMAN 1 Wonosari academic year of 2014/2015 included in not good questions in terms of level of difficulty because there are 32 questions (80%) including questions that have low levels of difficulty or includes in the category of easy question.
clearly so the students are difficult to understand. Another cause is the material being tested does not comply with learning material that has taught, so there are a lot of students who do not understand.
4. Discrimination Index
Determination index is the ability of items where the scores can distinguish participants from the highest to the lowest group. Interpretation of discrimination index ie from 0.00 to 0.19 are included in the category of poor; 0.20 to 0.39 are included in the category satisfactory; 0.40 to 0.69 are included in good categories; and 0.70 to 1.00 are included in the excellent category.
Items that have a very good and good discrimination index can be maintained by putting it in the question bank. Items which have fair category should be improved in order to become a good question, while the item that has a less good not good discrimination index should be revised totally by discover the cause of the failure. One effort to do is fix the problem which is less clear, so make the students with high ability to answer the question feel confuse. Items must be able to reflect any differences in ability between students who understand the material with students who do not understand the material.
5. Distribution Pattern Answer
The distribution pattern answers obtained by counting the number of testee who choose answer options a, b, c, d, and e or who do not choose any commonly referred to omit. From the distribution pattern answers can be determined whether the distractors can function properly or not. Distractors functioning properly at least chosen by 5% of all test participants. Students of the Grade XII IPS XII who take the Final Examination in Economics Subject were 92 students, so distractors will be good functioning if selected by 5% of the 92 students at 4.6 so that in this study were taken as many as five students. The number of well-functioning distractors then consulted with the criteria of distractors using Likert scale to determine the quality of the item.
in good categories is a question that the three distractors can function well while one of the alternative answers do not work because it did not elected by the students or the percentage is less than 5%. Question which categorized in fair is a question that two distractors can function properly while the other two alternative answers do not work because it did not elected by the students or the percentage is less than 5%. Less good question is a question which one distractor can not functioning well while the other three alternative answers do not work because it did not elected by the students or the percentage is less than 5%. Item that is not good is items that all distractors do not work because it did not elected by the students or the percentage is less than 5%.
items that the distractors are functioning less good and not good should be corrected totally. The correction can be done by replace its distractors with closer or equivalent (homogeneous) function to the answer key so students will think more complex in selecting the correct answers.
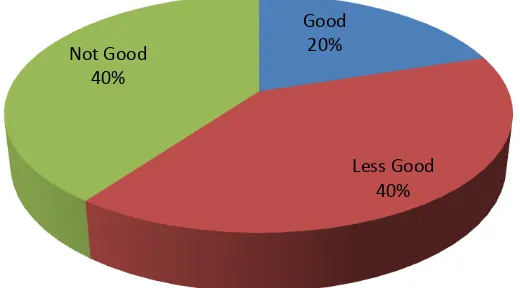
6. Test item analysis based on validity, level of difficulty, discrimination index and distribution pattern answers
Items that have been analyzed based on each elements i.e. validity, level of difficulty, discrimination index, and the distribution pattern of answers, then accumulated to determine the overall quality. Quality of the itemsis grouped into three sections, namely good, less good, and not good items. Criteria for quality grouping of the items can be seen by the following considerations:
a. Items were said to have a good quality if the question meets the four criteria: validity, level of difficulty, discrimination index and distribution pattern of answer.
b. Items were said to have a fair quality if the question is only meets three of the four criteria.
c. Items were said to have not good quality if the question does not meet the criteria for two or more items.
2014/2015 based on validity, level of difficulty, discrimination index and distribution pattern answers showed that 8 items (20%) have a good quality, 16 items (40%) had less good quality, 16 items (40%) had a not good quality. Distribution of 40 questions based on the quality of the
Based on the analysis of the validity, level of difficulty, discrimination index, and the distribution pattern answers can be seen that the quality of the questions in Final Examination Economics Subject Grade XII IPS SMAN 1 Wonosari academic year of 2014/2015 including the question that is less good. Items that cause problems become less good and bad can be seen in the following table:
Table9. Distribution of questions in Final Examination Economics Subject Grade XII IPS SMAN 1 Wonosari academic year of
selected by the student does not have the function as distractor. The third cause of failure is a discrimination index which means that the questions can not distinguish between students who understand the material with students who do not understand the material. The fourth cause of failure is the validity item level, which means that the matter will not have a fit or alignment direction of the total score.
The analysis showed that 8 items (20%) had a good quality can be stored into question bank by maintaining the confidentiality of the questions so that can be re-used for the test or next academic year with some modification. 16 items (40%) had a less good quality can be improved by looking at the indicator that causes its failure. And 16 items (40%) had a not good quality must be replaced with the good questions. Good questions can be produced when a teacher have a good ability in make the questions by observing the elements are analyzed in every item. It can be reached by reading the manual preparation and analysis about the item to raise questions that are made.
E. Research Limitations
60 CHAPTER V
RESEARCH CONCLUSIONS, IMPLICATIONS AND SUGGESTIONS
A. Conclusions
Based on the analysis item consisting of validity, reliability, level of difficulty, discrimination index and distribution pattern answers to the question of Final Examination in Economics Subject Grade XII IPS SMAN 1 Wonosari academic year of 2014/2015 can be concluded as follows:
1. The quality of the questions in Final Examination of Economics Subject Grade XII IPS SMAN 1 Wonosari academic year of 2014/2015 in terms of validity is good because the 33 items (82.5%) including to the valid questions.
2. The quality of the question in Final Examination on Economics Subject Grade XII IPS SMAN 1 Wonosari academic year of 2014/2015 in terms of reliability is high or reliable because it has a high reliability which is equal to 0.87.
3. The quality of the question in Final Examination on Economics Subject Grade XII IPS SMAN 1 Wonosari academic year of 2014/2015 in terms of level of difficulty is not good because the 32 items (80,%) include to easy category.
5. The quality of the question in Final Examination on Economics Subject Grade XII IPS SMAN 1 Wonosari academic year of 2014/2015 in terms of distribution pattern answer has a fairly good functioning distractors because there are 6 items (15%) had less good functioning distractors, and 9 items (22.5 %) have not good functioning distractors.
6. The quality of the question in Final Examination on Economics Subject Grade XII IPS SMAN 1 Wonosari academic year of 2014/2015 based on the overall analysis of the validity, level of difficulty, discrimination index and distribution pattern answers is less good because there are 8 items (20%) had a good quality, 16 items (40%) had a less good quality, and 16 items (40%) had a not good quality.
B. Implication
The implications that can be presented on the results of the analysis are as follows: