on Income
Recent Innovations from the HRS
Michael Hurd
F. Thomas Juster
James P. Smith
a b s t r a c t
This paper evaluates two survey innovations introduced in the HRS that aimed to improve income measurement. The innovations are (1) the inte-gration of questions for income and wealth and (2) matching the periodic-ity over which income questions are asked to the typical way such income is received. Both innovations had significant impacts in improving the quality of income reports. For example, the integration of income ques-tions into the asset module produced in HRS an across-wave 63 percent increase in the amount of income derived from financial assets, real es-tate investments and farm and business equity. Similarly, asking respon-dents to answer using a time interval consistent with how income is re-ceived substantially improved the quality of reports on social security income. Fortunately, we also suggest ways that these innovations can be introduced into other major social science surveys.
I. Introduction
There has been concern about the reliability of survey estimates of income and wealth ever since such measures began to be collected systematically in the 1940’s and 1950’s (Sudman and Bradburn 1974; Radner 1982). Obtaining accurate and unbiased household wealth measures has been problematic due to the reluctance of the extremely wealthy to participate in social science surveys at all, Michael Hurd and James P. Smith are Senior Economists at RAND. F Thomas Juster is a Research Scientist, Survey Research Center, University of Michigan. The authors would like to thank Tim Mar-shall, Greg Weyland, and Charles Nelson of the Department of Labor for their excellent help and coop-eration in using the Current Population Survey files. Iva Maclennan and David Rumpel provided su-perb programming assistance. The research was supported by grants from the National Institute on Aging to RAND and by funds provided by the Survey Research Center at Michigan.
[Submitted September 2000; accepted October 2001]
ISSN 022-166X2003 by the Board of Regents of the University of Wisconsin System
and the widespread prevalence of item nonresponse to wealth questions in particular. Ironically, using new survey innovations, there has been considerably greater prog-ress in mitigating problems for wealth measurement than for income. For example, given the extreme skew in wealth distributions, the bias resulting from the substan-tially higher nonresponse rates among very wealthy households has been dealt with in the various Surveys of Consumer Finances conducted since 1983 by the use of special sampling frames (such as tax files) that oversample the super-wealthy. Simi-larly, the growing use of unfolding bracket techniques to handle missing data prob-lems have resulted in reduced measurement error and lower bias due to nonignorable item nonresponse to wealth questions (Juster and Smith 1997). To date, no parallel progress has been documented for income measurement.
In this paper, we attempt to remedy this situation by evaluating two survey innova-tions aimed at improving income measurement. These innovainnova-tions are (1) integrating the question sequences for income and wealth which may elicit more accurate esti-mates of income from capital than has been true in the past, and (2) changes in the periodicity over which income flows are measured, which may provide a closer match between what the survey respondent knows best and the periodicity contained in survey measurement. These innovations have been introduced into both the Health and Retirement Study (HRS) and the study of Asset and Health Dynamics Among the Oldest Old (AHEAD). Based on the results reported in this paper, the potential return in quality of income measurement from these innovations is substantial.
The paper is organized as follows. In the next section, we document the extent of income under-reporting in household surveys and discuss the data on which this research will rely. In Section III, we investigate the implications of integrating ques-tions about income from capital with the quesques-tions about household wealth. Section IV explores the implications of changes in the reference period for certain types of income flows.
II. Data Sources and Bias in Income Reporting
all income sources, CPS income reports are 89 percent of the benchmark indicating an 11 percent underreport on average. However, there exists considerable variation around that average. There is a little bias in CPS wage and salary incomes which are 98 percent of the benchmark. Social Security income contains more bias (95 percent of the benchmark), but appears to be less understated than the other major source of retirement income—private pensions. But private pensions may be a case where the benchmark is too high since it includes lump sum withdrawals and roll-overs to other accounts such as IRAs and Keoghs. Excluding such lump sum pay-ments places the CPS pension income at about 84 percent of the benchmark (Woods 1996; Schieber 1995). By far, the most severe underreporting occurs in interest and dividends, where CPS reports are about half the external benchmarks. Even when these income sources are reported without bias, there remains the problem of substan-tial measurement error in reports of amounts (Ferber 1966; Moore, Stinson, and Welniak 1997).
Our research will rely on data from three well-known surveys—the Health and Retirement Survey (HRS), the Asset and Health Dynamics of the Oldest Old (AHEAD), and the Current Population Surveys (CPS). HRS is a national sample of about 7,600 households (12,654 individuals) with at least one person in the house-hold born between 1931 and 1941 (51–61 years old at the interview date). At base-line, an in-home, face-to-face interview of some 90 minutes was conducted starting in the spring of 1992 and extending into early 1993. Given its focus on the preretire-ment years, the principal objective of HRS is to monitor economic transitions in work, income, and wealth, as well as changes in many dimensions of health status. AHEAD has 6,052 households (8,204 individuals) from the birth cohorts of 1923 or before, thus with at least one person aged 70 or over in 1993. The baseline AHEAD interview was done in 1993 using computer-assisted telephone techniques for respondents aged 70–79 and computer-assisted in-person interviews for those aged 80 and over. Given its older age span, AHEAD’s objectives shift toward the relationship between economic status and changes in physical and cognitive health in old age, the maintenance of independent living arrangements, and dis-savings and asset decline.1
HRS and AHEAD are both longitudinal surveys with data collected every other year. Both surveys obtained extensive information about the economic situation of the households, including a complete accounting of assets stock and income flows. In addition to housing equity (with separate detail for the first and second home), assets were separated into the following categories in HRS and AHEAD: other real estate; vehicles; business equity; IRAs or Keoghs; stocks or mutual funds; checking, savings, or money market accounts; CDs, government savings bonds, or treasury bills; other bonds; trusts and estates; other assets; and other debt. Similarly, separate questions were asked in both surveys about a long list of income sources for both the respondent and spouse: wages and salaries, self-employment income, tips and bonuses, unemployment compensation, workers’ compensation, Social Security
come, supplemental security income, private pension income, welfare, disability in-come, veterans’ benefits, or a military pension. In addition, questions were asked at the household level about rental income, income from business, interest and divi-dends, annuities, and food stamps.
There are two specific enhancements implemented in HRS and AHEAD aimed at improving the quality of income measurement—the integration of income from asset questions with questions about the assets from which such income is derived, and the use of periodicity questions that for certain income sources more closely reflect the frequency with which such income is received. We discuss these enhance-ments in detail below. HRS and AHEAD income and asset modules are given to the ‘‘knowlegdeable financial respondent’’—the eligible respondent most knowl-edgeable about the household’s financial situation. Especially in AHEAD, proxy respondents are occasionally used if the financial respondent is not physically able to respond or suffers from severe cognitive problems. Because the integration of asset and income questions took place between the second and third waves of HRS and the first and second waves of AHEAD, across-wave comparisons of reports of income from capital provide a convenient way of evaluating the impact of this inte-gration. Since AHEAD did not vary the periodicity of income reporting, on that issue we must turn to another survey for a comparison.
The Current Population Surveys (CPS) are the most widely used source to monitor labor force and income changes by year in the United States, and thus represent a useful standard of comparison to HRS and AHEAD. CPS conducts interviews each month with the number of households interviewed varying from 47,000 to 57,000 households during the 1990s (Current Population Reports). CPS households are in-terviewed for four successive months, are not inin-terviewed for the next eight months, and then are interviewed once again for four successive months. Annual incomes from many sources are obtained during the March interview. Consequently, although CPS is normally not thought of as panel, approximately half the respondents are interviewed across two adjacent March interviews.
Since no questions are asked about the value of household assets, the CPS cannot be used to evaluate the merit of integrating asset and income questions. However, CPS does ask questions about a long list of income sources using varying reporting periodicities. CPS income sources include wages and salaries, self-employment in-come, tips and bonuses, unemployment compensation, workers’ compensation, So-cial Security income, supplemental security income, private pension income, welfare veterans’ benefits, or a military pension. In addition, questions were asked at the household level about rental income, income from business, interest and dividends, annuities, and food stamps. CPS questionnaires are typically answered by one house-hold member who may or may not be the most knowledgeable about its financial affairs.
III. The Measurement of Income from Assets
Table 1
CPS Income as a Percent of Independent Sources
Wages and Salaries 98.2
Social Security and Railroad Retirement 94.8
Interest 51.3
Dividends 42.9
Net rents and royalties 81.3
Private pensions and annuities 70.6
All income 89.2
Derived from Current Population Reports Consumer Income Series P-60. Money In-come of Households, Families, and Persons in the United States. Department of Com-merce, Bureau of Census. Numbers produced here are average of Volume No. 180 and 184.
flows derive, but we will demonstrate here that this is far from the whole story. One enhancement implemented in HRS and AHEAD involves the measurement of in-come from assets. How do the better social science surveys typically attempt to measure income from assets? As in CPS, toward the end of the income sequence, there is likely to be a series of questions asked in close proximity to each other about rental income, interest and dividend income, and income from ownership of a business or farm. There are either no survey questions about the underlying assets that yield the income, or questions about those assets appear in a different part of the survey module (the wealth module).2Therefore, the normal feature of economic
modules in surveys is that all the asset questions are strung together in one section, and all the income questions are strung together in another section. The fact that the assets and the income are closely related is not exploited as a way to enhance data quality by jogging the respondent’s memory.
The cleanest case is interest and dividend income, since the underlying sources of the income flows—holdings of common stock, bonds, CDs, checking and savings accounts, money market funds, etc.—are more likely to be reliably reported by the household than the income generated from these assets. But a comparison of the fraction of households who report holding asset and the fraction who report receiving any interest or dividend income from that asset strongly suggests that survey esti-mates of income from assets are badly underestimated. In the typical survey, the fraction of households reporting interest or dividend income is much smaller than the percentage reporting ownership of assets that might yield an interest or dividend income flow. To illustrate, 75 percent of HRS Wave 2 households report holding some financial assets, but less than 30 percent report having any interest or dividend income.
In light of this gross inconsistency in income and asset reports, we revised in the third wave of HRS and the second wave of AHEAD the way income questions were asked. Essentially, we created a ‘‘merged’’ asset and income module in which questions about particular types of assets were followed immediately by questions about income from the asset. The key to this entire sequence is the way in which income-yielding assets are handled. The standard question sequence we developed asked first about ownership of the asset; for those households reporting ownership we then asked about the value of the assets. We next asked whether any income was received from the asset and, if so, about the periodicity and whether approxi-mately the same amount was received every period. For households reporting owner-ship, value, some income, and a monthly periodicity, with about the same amount received every month, the idea was to calculate last year’s income from the periodic amount and the periodicity. For households reporting that the amount received every period wasn’t always the same, we branched to a question about the amount of income received from the asset in the prior calendar year. This question sequence was used for the four types of financial assets included on HRS and AHEAD (check-ing, savings, and money market accounts; CDs, savings bonds and Treasury Bills; stocks; and bonds), as well as for real estate investment equity and business and farm equity.
Comparisons of results from this new way of asking about income from assets (used in HRS3 and AHEAD2) with estimates of income from assets produced by the conventional survey methodology (as reflected by HRS and AHEAD1) show dramatic differences in income amounts reported. Table 2 highlights the impact by listing mean income and the value of asset holdings by source in HRS2 and 3 and AHEAD1 and 2. The effects of the integration are quite dramatic. Between HRS2 and HRS3, income from these financial assets, real estate investments, and business and farm equity combined increased from $5,669 a year to $9,266 a year. Part of this increase in income may be due to the growing asset values common to the 1990s, but this can explain only a small part of the increase. While the value of assets goes up by about 14 percent between HRS2 and 3, income from assets increased by 63
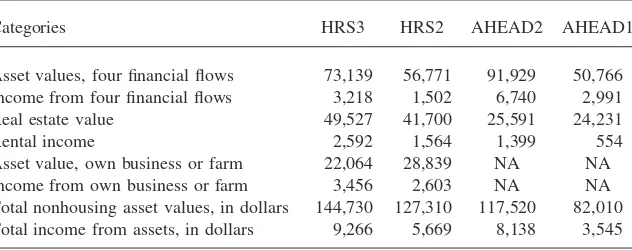
Table 2
Weighted Means of Assets and Income of HRS and AHEAD
Categories HRS3 HRS2 AHEAD2 AHEAD1
Asset values, four financial flows 73,139 56,771 91,929 50,766
Income from four financial flows 3,218 1,502 6,740 2,991
Real estate value 49,527 41,700 25,591 24,231
Rental income 2,592 1,564 1,399 554
Asset value, own business or farm 22,064 28,839 NA NA
Income from own business or farm 3,456 2,603 NA NA
percent, While the integration of asset and income questions affected all income sources, the impact was largest in income amounts from the four financial assets (a greater than a two-fold increase), and smallest in income from business and farm (a 32 percent increase). Following the integration of the asset and income questions, capital income increases of an even larger magnitude (more that $8,000 compared with about $3,500) appear between AHEAD1 and 2.
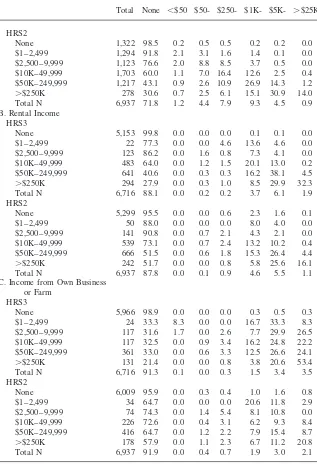
The failure to report interest or dividend income using the conventional survey format, while in an absolute sense related to the size of asset holdings, appears to apply throughout the full range of asset holdings. Table 3 provides the relevant data for HRS2 and 3, dividing the sample into asset categories ranging from none to more than a quarter of a million, and then subdividing income into categories starting with none and going up to $25,000 or more. Examine first the relationship between asset holdings and income flows for the sum of the four financial assets contained in the surveys. Ninety percent plus of households in HRS2 who report a small number of financial assets ($1–2499) also report zero interest or dividend income. In contrast, 63 percent of HRS3 households in the same asset group report zero interest or divi-dent income.
But the most dramatic results occur among those with a great deal of these assets. For example, 31 percent of HRS2 households who had more that $250,000 of finan-cial assets still reported that they received no income at all from these assets. That result is not plausible and indicates that without tying the income questions to the presence and amount of the asset there is a substantial understatement of the preva-lence and level of income from assets. The integration of the asset and income ques-tion resulted in a substantial decrease in the inconsistency between asset and income reports. In HRS3 among those with more than $250,000 in these financial assets, only 3 percent did not report any income from this source.
Similar but less dramatic results show up in our analysis of the value of real estate holdings compared with reports of rental income, and the value of owned businesses or farms compared with income from those businesses or farms. Of those reporting more than $250,000 in investment real estate holdings, 52 percent reported zero
Table 3
Distribution of Income from Assets
Total None ⬍$50 $50- $250- $1K- $5K- ⬎$25K
A. Interest or Dividend Income from Four Financial Assets
HRS3
None 1,243 97.2 0.8 0.8 0.9 0.2 0.1 0.0 $1–2,499 1,351 63.1 17.2 11.6 6.5 1.3 0.4 0.0 $2,500–9,999 956 27.0 15.6 28.8 19.6 8.5 0.5 0.1 $10K–49,999 1,520 10.0 6.8 17.6 29.8 32.1 3.6 0.1 $50K–249,999 1,275 6.7 2.0 4.0 8.8 43.2 31.8 3.5
Table 3(continued)
Total None ⬍$50 $50- $250- $1K- $5K- ⬎$25K
HRS2
None 1,322 98.5 0.2 0.5 0.5 0.2 0.2 0.0 $1–2,499 1,294 91.8 2.1 3.1 1.6 1.4 0.1 0.0 $2,500–9,999 1,123 76.6 2.0 8.8 8.5 3.7 0.5 0.0 $10K–49,999 1,703 60.0 1.1 7.0 16.4 12.6 2.5 0.4 $50K–249,999 1,217 43.1 0.9 2.6 10.9 26.9 14.3 1.2
⬎$250K 278 30.6 0.7 2.5 6.1 15.1 30.9 14.0 Total N 6,937 71.8 1.2 4.4 7.9 9.3 4.5 0.9 B. Rental Income
HRS3
None 5,153 99.8 0.0 0.0 0.0 0.1 0.1 0.0 $1–2,499 22 77.3 0.0 0.0 4.6 13.6 4.6 0.0 $2,500–9,999 123 86.2 0.0 1.6 0.8 7.3 4.1 0.0 $10K–49,999 483 64.0 0.0 1.2 1.5 20.1 13.0 0.2 $50K–249,999 641 40.6 0.0 0.3 0.3 16.2 38.1 4.5
⬎$250K 294 27.9 0.0 0.3 1.0 8.5 29.9 32.3 Total N 6,716 88.1 0.0 0.2 0.2 3.7 6.1 1.9 HRS2
None 5,299 95.5 0.0 0.0 0.6 2.3 1.6 0.1 $1–2,499 50 88.0 0.0 0.0 0.0 8.0 4.0 0.0 $2,500–9,999 141 90.8 0.0 0.7 2.1 4.3 2.1 0.0 $10K–49,999 539 73.1 0.0 0.7 2.4 13.2 10.2 0.4 $50K–249,999 666 51.5 0.0 0.6 1.8 15.3 26.4 4.4
⬎$250K 242 51.7 0.0 0.0 0.8 5.8 25.6 16.1 Total N 6,937 87.8 0.0 0.1 0.9 4.6 5.5 1.1 C. Income from Own Business
or Farm HRS3
None 5,966 98.9 0.0 0.0 0.0 0.3 0.5 0.3 $1–2,499 24 33.3 8.3 0.0 0.0 16.7 33.3 8.3 $2,500–9,999 117 31.6 1.7 0.0 2.6 7.7 29.9 26.5 $10K–49,999 117 32.5 0.0 0.9 3.4 16.2 24.8 22.2 $50K–249,999 361 33.0 0.0 0.6 3.3 12.5 26.6 24.1
⬎$250K 131 21.4 0.0 0.0 0.8 3.8 20.6 53.4 Total N 6,716 91.3 0.1 0.0 0.3 1.5 3.4 3.5 HRS2
None 6,009 95.9 0.0 0.3 0.4 1.0 1.6 0.8 $1–2,499 34 64.7 0.0 0.0 0.0 20.6 11.8 2.9 $2,500–9,999 74 74.3 0.0 1.4 5.4 8.1 10.8 0.0 $10K–49,999 226 72.6 0.0 0.4 3.1 6.2 9.3 8.4 $50K–249,999 416 64.7 0.0 1.2 2.2 7.9 15.4 8.7
rental income in HRS2 compared with 28 percent in HRS3. Among those with more than one-quarter million dollars in farm or business assets, 58 percent, reported no income in HRS2 while only 21 percent did so in HRS3.
It is not surprising if people with a few dollars of interest or dividend income report that they had zero interest and dividend income. It is quite surprising that many people with more than a quarter of a million dollars of financial asset holdings report zero interest or dividend income when the question is asked in the conven-tional format relative to what they report when the question is asked in the merged format. We believe that the better quality income reports are obtained with the merged format as a respondent has just been asked to think about the existence and size of asset holdings. This merged format makes it difficult to report zero income having just reported substantial asset holdings. Whatever the explanation, the merged income/asset format produces a dramatic improvement in the reporting of income flows from assets
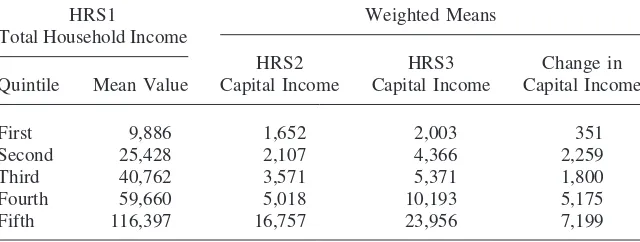
There are also some income distribution consequences to the enhanced reporting of income from capital. This income tends to be held by wealthier households so that underreporting of income may simultaneously understate the extent of income inequality in the population. This issue is examined in Table 4 which stratifies house-holds into quintiles by the amount of their total household income in HRS1, and within each quintile, lists in the amount of total capital income reported in HRS2 and HRS3. While HRS3 numbers indicate that much more capital income is reported in the aggregate, the increased reporting to income from capital had very little impact on those households in the bottom fifth of the income distribution whose income declined relative to incomes in all other quintiles. In contrast, those households in the top quintile registered an increase in capital income of more than $7000 between HRS2 and HRS3. In general, the size of the increase in capital income between Waves 2 and 3 grew across income quintiles. This pattern implies that the absolute income gap of the well-to-do relative to the poor is understated by conventional survey methods of obtaining household income.
Table 4
Weighted Means of Capital Income Flows by HRS-1 Total Household Income Quintiles
HRS1 Weighted Means
Total Household Income
HRS2 HRS3 Change in
Quintile Mean Value Capital Income Capital Income Capital Income
First 9,886 1,652 2,003 351
Second 25,428 2,107 4,366 2,259
Third 40,762 3,571 5,371 1,800
Fourth 59,660 5,018 10,193 5,175
IV. The Effect of Income Periodicity
The second survey innovation we evaluate concerns the time span or periodicity over which income is reported. For simplicity, many surveys have respondents report all income sources in the same periodicity even though periodicity and regularity of payments may vary a great deal by source. Yet, especially for income sources which are not variable, respondents may know and answer best if the question refers to the time interval at which they normally and most recently receive that income (Tourangeau, Rips, and Rasinski 2000). When respondents are requested to report in a periodicity different from that of usual receipt, we may be asking them to perform quickly some difficult cognitive and computation tasks. The value of a specific periodicity may be highest for income flows that tend to continue indefinitely, to change slowly (perhaps due to a COLA adjustment), and to arrive with uniform periodicity (typically a month).
Given these specifications the most likely income flows to gain from alternative periodicities may be income sources generally received by older and retired house-holds. The most common source in this category is Social Security benefits, which are received monthly, are adjusted annually for Cost of Living changes, do not have taxes withheld, and involve withholding only to the extent that respondents select Medicare Part B as an option (more than 90 percent do). In this case, asking the amount of last month’s Social Security check may produce better estimates of Social Security income than asking, as is the usual case, for Social Security benefits paid during the most recent calendar year. Thus, it seems better to estimate Social Security benefits by asking about last month’s Social Security check, multiplying it by twelve for respondents who began to receive Social Security payments prior to the beginning of the most recent calendar year (and multiplying it by the appropriate number of months for households who began to receive payments sometime during the prior calendar year).
Since—at least for subpopulations of recipients—the ‘‘truth’’ is known, Social Security may also represent the ideal income source to gauge respondents’ ability to report their income accurately. By age 70 when there are no earnings tests or Social Security disability income, Social Security income is fixed legislatively by a formula that depends on the history of past earnings and on family composition. If there are no changes in family composition due to divorce, separation, or death, Social Security income is only revised across calendar years by a universal Cost of Living Adjustment (COLA) first given in the January check each year. To eliminate such demographic reasons for changes in Social Security income, we restricted our AHEAD sample to households where both respondents were at least 70 years old in the first wave and where no marital status changes or deaths occurred between the first and second wave. We also required both respondents to have received some Social Security income in each wave so that there is no ambiguity that we are dealing with program beneficiaries. Finally, cases were deleted when Social Security income was imputed in either wave of the panel.
Table 5
Percentiles of Differences in Annual Social Security Income
CPS
AHEAD 1996–97
Percentile 1994–95 1992–93 All Monthly 1a Monthly 2b
95 1,563 3,415 3,799 2,682 2,167
90 863 1,965 1,948 1,271 1,134
75 208 545 435 301 256
50 ⫺57 46 ⫺36 ⫺49 ⫺47
25 ⫺263 ⫺405 ⫺540 ⫺369 ⫺310
10 ⫺807 ⫺1,973 ⫺1,921 ⫺1,161 ⫺1,034
5 ⫺1,578 ⫺4,062 ⫺3,956 ⫺2,499 ⫺2,232
a. Based on CPS respondents using monthly reporting intervals.
b. Based on CPS respondents using monthly reporting intervals and after Medicare deduction.
percent) AHEAD respondents had two COLA adjustments, but 8.4 percent had only one while 5.1 percent had three. If all respondent reports were completely accurate, these adjusted Wave 1 and actual Wave 2 reports of Social Security income would be identical. Differences between them therefore reflect reporting error.
The first column in Table 5 displays percentile distributions of arithmetic differ-ences in Wave 1 Social Security income (adjusted for subsequent COLAs) and Wave 2 Social Security income. While respondents report monthly incomes, for compari-son with other surveys, we list differences on an annual basis for the year 1995. The specific year chosen does not affect the results. The median difference in Social Security income is small—the COLA-adjusted Wave 1 report is $57 higher per year greater than the Wave 2 report of Social Security income. Half of respondents give reports that are no more than $200 apart, 80 percent give reports within roughly $800 of each other, and 90 percent lie no more than $1,500 (or 23 percent) apart. Reporting errors appear to be symmetric so that each wave is equally likely to be higher than the other.
Are these AHEAD income reporting errors large or small? The answer depends on the context in which the data are used. For cross-sectional analyses since mean Social Security incomes were about $9,600 in 1995, Table 5 indicates that AHEAD reporting errors are 9 percent or more for one in five respondents. But for analysis relying on the panel nature of the data, within-person changes in Social Security income, the problem is far more serious. To illustrate, all within-person variation in Social Security income in our sample in Table 5 represents measurement error by construction.
to obtain data on income. The Current Population Surveys (CPS) provide such a comparison. During the 1990s, CPS made several revisions in the way it asks income questions, including Social Security income. Before 1994, CPS respondents were asked to report Social Security income for the last calender year. Starting in 1994, respondents first selected the periodicity (monthly, quarterly, or annual) in which they wanted to report and then gave a dollar amount for this periodicity. There is a clear preference for a monthly interval for Social Security income. In 1996, for example, 77 percent of CPS respondents selected monthly as the easiest way of reporting Social Security income while 23 percent selected yearly. No matter which periodicity was chosen, the income still referred to the last calender year. For exam-ple, if the respondent chose monthly, they were asked to give their monthly income during an average month last year. CPS staff would then convert all incomes to an annual basis which is the way income is available on public use tapes.
We matched respondents across two successive March panels for 1992 and 1993 (when CPS asked for annual Social Security income) and 1996 and 1997 when the new CPS reporting system had been in place for a while. Individuals were matched based on their sex, race, age, education, and line number. Matches had to be exact on sex, race, and line number and no more than two years apart in age and at most one year of schooling apart. We then imposed the same sample deletions used in the AHEAD sample. That is, we retained only cases in which each respondent (and spouse) were at least 70 years old in the first March survey, no deaths or marital changes occurred between March interviews, Social Security incomes were not im-puted in either interview, and there was a positive report of Social Security income in both March interviews.
The second and third columns in Table 5 list percentile differences in Social Secu-rity income from the second March CPS interview minus the COLA adjusted Social Security income from the previous March CPS. Once again, the median difference was small—less than 50 dollars a year. However, differences in CPS reports of Social Security income are considerably larger than those in AHEAD. For example, the 90th and 10th percentiles in the CPS were about plus and minus $1,900 compared with approximately $800 in AHEAD. Alternatively, roughly one-fifth of CPS respon-dents had measurement errors in their Social Security incomes of 20 percent or more. In general, reporting errors appear to be about twice as large in CPS as in AHEAD. Moreover, the size of these CPS reporting errors seem to be about the same when the new reporting methodology was used in March of 1992 and 1997 is used as when the old CPS annual income methodology was used in March of 1992 and 1993. Apparently, these revised CPS methods did not lead to any overall improvement in the quality of income reports for Social Security income.
form in which they received their most recent check—a monthly check which ex-cludes the deduction of the Medicare Part B premium.
To see this, the penultimate column in Table 5 lists differences in CPS Social Security income among those reporting in a monthly interval in both 1996 and 1997. CPS errors in Social Security incomes are much smaller when consistent monthly units reporting is employed. In fact, more than 60 percent of the difference between CPS and AHEAD reporting errors is explained by the use of a monthly interval. The final column in Table 5 indicates some additional quality improvement is obtained by limiting CPS respondents to those reporting in a monthly interval and after Medicare premium deductions in both 1996 and 1997. Much of the remaining difference with AHEAD is likely a consequence of the fact that, even using monthly intervals, CPS is asking respondents to perform the more difficult computational task of calculating what they received in an average month last year while AHEAD is simply asking them to remember the last check. Requiring those respondents who said they found it easier to report in a yearly interval to report monthly instead is likely to result in improved reports as the preference for yearly reporting has little conviction behind it. Even among respondents who reported in a yearly interval in 1996, two-thirds of them reported in a monthly interval one year later.3
V. Conclusion
Although under-reporting of income is often thought to be a problem for those at the bottom of the economic strata, the results presented in this paper indicate that at least for some sources of income it is more of a problem for those at the top of the heap. These income sources include income from financial assets, rental income from property , and income from business. These income sources are understated by a factor of two in conventional household surveys. Fortunately, this appears to be a problem with a solution at hand—integration of asset and income modules in surveys. Such an integration was introduced into the third wave of the Health and Retirement Survey and second wave of AHEAD. The net result was an almost doubling of these income components as well as a much more consistent reporting by households of their income and their assets.
Can the benefits of this innovation carry over to other surveys? The merged income/asset module will work best for surveys like PSID, NLS and SIPP which
are designed to collect information about asset holdings and about income flows and which have about the same number of asset categories as HRS. But the merged module may work less well in studies like the SCF, which has very detailed asset holdings (roughly 100 categories in all) so that a merger of the income and asset modules is impractical.
The interesting case involves surveys like CPS that do not currently obtain data on asset holdings in part because data on assets are thought to be sensitive (thereby encouraging refusals) and also to take too much survey time to administer. To deal with these concerns, an interesting possibility is to experiment randomly with modi-fied versions of the merged income/asset module design that may be less sensitive and less time consuming than the full HRS treatment. One idea would be to ask about the presence or absence of asset holdings, but not about amounts. If assets were present, one would next ask whether there is any income associated with those assets and the periodicity and amount of income flows. Asking simply about the presence of assets is unlikely to be as sensitive or time consuming, but may produce some of the data quality benefits of associating income flows with assets. Another possibility is to ask about asset values but only within very broad intervals. Such knowledge may be sufficient to remind respondents of the likely income amounts they receive from these assets.
Similarly, asking respondents to answer using a time interval consistent with how income is received significantly improves the quality of reports about income. This is certainly the case with Social Security, where the same amount is received many times in a regular periodicity. The same rationale may hold for many major sources of income. Pension payments are much like Social Security payments, expect that some fraction of pension payments will involve tax withholding, and many pensions are not adjusted for Cost of Living changes. But question sequences that ask about tax withholding and about Cost of Living changes should handle this problem quite well. A similar situation is likely to be the case for Veterans’ Benefit payments which have the same features as Social Security or Pensions payments—once they start, they continue until the death of the recipient, and may continue beyond that de-pending on demographic circumstances.
References
Coder, John, and L. Scoon-Rogers. 1995. ‘‘Evaluating the Quality of Income Data Col-lected in the Annual Supplement to the March CPS and the SIPP.’’ SIPP Working Paper Series No. 215. Washington, D.C.: U.S. Bureau of the Census.
Current Population Reports.Consumer Income.Series P-60. Washington, D.C.: U.S. Bu-reau of the Census.
Ferber, Robert. 1996.The Reliability of Consumer Reports of Financial Assets and Debts. Urbana, Ill.: University of Illinois Bureau of Economic and Business Research. Juster, F.T., and J.P. Smith. 1997. ‘‘Improving the Quality of Economic Data: Lessons
from HRS and AHEAD.’’Journal of the American Statistical Association92: 1268–78. Moore, Jeffrey, Linda Stinson, and Edward J. Welniak. 1997. ‘‘Income Measurement Error
in Surveys: A Review,’’ Washington, D.C.: U.S. Bureau of the Census. S.M. 97/5. Radner, D. 1982. ‘‘Distribution of Family Income: Improved Estimates.’’Social Security
Schieber, Sylvester J. 1995. ‘‘Why Do Pension Benefits Seem So Small.’’Benefits Quar-terly11(4):57–70.
Sudman, Sydney, and Norman Bradburn. 1974.Response Errors in Surveys.Chicago. Aldine.
Tourangeau, Roger, Lance Rips, and Kenneth Rasinki. 2000.The Psychology of Survey Re-sponse.Cambridge: Cambridge University Press.