Primary Schooling
Christopher Jepsen
a b s t r a c t
Although extensive research has compared Catholic and public high schools, little is known about Catholic primary schools. Using unique data for two cohorts of primary school students, I nd that Catholic schooling does not have a signicant effect on mathematics and reading test scores. These ndings do not change when school level test scores from the rst-grade cohort are used to account for selection bias in the fourth-grade cohort. In fourth grade, Catholic schooling is associated with marginally fewer student absences than is public schooling.
I. Introduction
Coleman, Hoffer, and Kilgore (1982) sparked a hotly contested, on-going debate by reporting that Catholic high school attendance is associated with higher test scores. Much of this debate focuses on the ability to control for the non-random selection of students into Catholic high schools. Researchers usually use instruments based on detailed location and religion variables under the assumption that these variables affect the availability of Catholic schooling but have no direct effect on achievement or attainment. Using these instruments, recent research
gener-Christopher Jepsen is a research fellow at the Public Policy Institute of California, 500 Washington Street, Suite 800, San Francisco, CA 94111, jepsen@ppic.org. He is grateful to the National Bureau of Economic Research (NBER) for nancial support and to Abt Associates for the use ofProspectsdata. He would like to thank Joseph Altonji, Erik Beecroft, Rebecca Blank, Todd Elder, David Figlio, Lisa Jepsen, Jens Ludwig, Bruce Meyer, Derek Neal, Steven Rivkin, Paulo Santiago, Jon Sonstelie, Christopher Taber and two anonymous referees— as well as seminar participants at the 1999 Fall APPAM Conference, Northwestern University, the Bureau of Labor Statistics, and PPIC—for useful comments. He claims responsibility for all errors and all opinions. These do not reect those of NBER or PPIC. Scholars who wish access to the data used in this paper may contact the U.S. Department of Education.
[Submitted June 2001; accepted June 2002]
ISSN 022-166XÓ2003 by the Board of Regents of the University of Wisconsin System
ally nds positive effects of Catholic schooling on educational attainment and student achievement.1However, Ludwig (1997) nds that many of these instruments are not exogenous, and Altonji, Elder, and Taber (1999) nd that functional form assump-tions, rather than instruments, provide much of the explanatory power in these models.
The small literature on Catholic primary schooling suffers from similar problems with selection bias. Sander (1996) nds a positive and signicant effect of eight years of Catholic primary school attendance on tenth-grade test scores. However, he does not control for Catholic high schooling in these regressions, so it is impossible to determine whether Catholic grade school attendance or Catholic high school atten-dance drives these effects.2It is also unclear whether identication in his selection bias models comes from the instruments or the functional form assumptions. National Assessment of Educational Progress (NAEP) data include Catholic primary schools but contain little student and school demographic data. Therefore, Lee and Stewart (1989) and Jones (1997) are only able to control for a few student characteristics and are unable to control for selection bias or prior achievement. Nonetheless, both papers nd that Catholic primary school students outperform public primary school students in NAEP tests.
In this paper, I utilize a unique microdata set, theProspectsstudy of the Title 1 program, in order to analyze the effect of Catholic primary schools on test scores, classroom behavior, and attendance. Because each Prospects school includes test score data for students in rst and fourth grade, I use the test scores from the students in the rst-grade cohort as controls for selection bias for the students in the fourth-grade cohort under the assumption that ability and out-of-school factors have more inuence than in-school factors in test scores for rst-grade students.
Using a value-added specication, I nd insignicant but generally positive effects of Catholic schooling on 1993 mathematics and reading test scores for students in either cohort. Catholic schooling has no effect on classroom behavior. For the fourth-grade cohort, Catholic schooling is associated with a modest decrease in student absences of less than one day per year. At the same time, Catholic school teachers aremorelikely than public school teachers to report that excessive absenteeism is a problem.
II. Data
The data for this paper come fromProspects, the Congressionally mandated national study of the Chapter 1 program in the early 1990s. The program, now called Title 1, provides additional resources to low-income and other at-risk students. The Prospects survey includes data on individual students in the rst, fourth, and seventh grades in the spring of 1992. I use data from the rst- and fourth-grade cohorts, as the seventh fourth-grade cohort has no Catholic school counterpart. The
1. Recent work on the effects of Catholic high school attendance includes Evans and Schwab (1995); Sander and Krautmann (1995); Goldhaber (1996); Neal (1997); Figlio and Stone (1999); Grogger and Neal (2000); Altonji, Elder, and Taber (2000); and Figlio and Ludwig (2000).
database for each cohort ofProspectsis quite extensive. Students, parents, teachers, school administrators, principals, and district Chapter 1 coordinators (for public school students only) completed questionnaires.
Students in both cohorts took the fourth edition of the Comprehensive Test of Basic Skills (CTBS/4) in reading and mathematics in the spring of 1992, with a followup test in the spring of 1993.3These tests are measured on a vertical scale, in order to allow for comparisons across cohorts and years. In other words, a score of 500 for a second grade student in 1992 measures the same level of academic achievement as a score of 500 for a different student in another grade or during another school year.4
Each cohort contains over 10,000 public school students from approximately 200 schools, as well as more than 1,000 Catholic school students from 35 schools. Public school districts and schools were carefully chosen to provide a representative sample of the schools and students receiving Chapter 1 funding, rather than to provide a nationally representative sample ofallprimary schoolchildren.5The set of Catholic schools were chosen so that their overall demographic characteristics matched those of the public schools. Within each school (public or Catholic), if grade enrollment is under 150, all students in the grade are surveyed. Otherwise, every student in four classrooms (chosen at random) is interviewed. Appendix Table A1 contains the descriptive statistics for student demographics.6
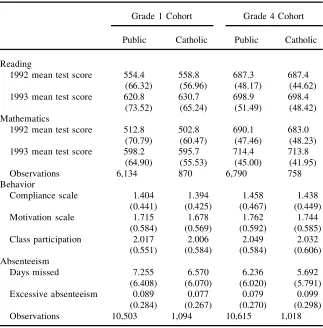
The descriptive statistics by school type for theProspectstest score data are in Table 1. The table provides no clear evidence of positive or negative selection bias (on test scores). Catholic school students inProspects actually have signicantly lower1992 mathematics test scores for both cohorts. By 1993, Catholic and public school students have approximately equal mathematics test scores, so the Catholic-public differences are insignicant for both cohorts. In reading, Catholic school stu-dents in the rst-grade cohort have signicantly higher test scores in both years. For the fourth-grade cohort, Catholic and public school mean test scores are almost iden-tical in both years.
I investigate the applicability of the data for representing low-income schools by comparingProspects test scores with test scores from the voucher programs in Cleveland, Dayton, New York, San Antonio, and Washington, D.C. (Peterson, Greene, and Howell 1999; Peterson, Myers, and Howell 1999; and Howell et al. 2000). Both Catholic and public school students in theProspectsdata have higher mathematics and reading national percentile scores than corresponding students in the voucher programs. At the same time, all theProspectstest score means in Table 1 are below the national averages for the CTBS/4 reported in CTB (1989).
3. Although nearly 40 percent of the students in the 1992 and 1993 data did not take the test in both years, sample attrition between 1992 and 1993, at least with respect to test scores, is similar in Catholic schools and in public schools. Many of the students with missing test scores do have sufcient English language ability to take the test.
4. For more information on the test scores, see Jepsen (2000) as well as CTB (1989).
5. More information on the sampling technique for both the public and Catholic schools inProspectsis available in Jepsen (2000), as well as in Bryant (1993) and Puma (1995).
Table 1
Descriptive Statistics for Test Scores, Behavior, and Absenteeism
Grade 1 Cohort Grade 4 Cohort Public Catholic Public Catholic Reading
1992 mean test score 554.4 558.8 687.3 687.4
(66.32) (56.96) (48.17) (44.62)
1993 mean test score 620.8 630.7 698.9 698.4
(73.52) (65.24) (51.49) (48.42) Mathematics
1992 mean test score 512.8 502.8 690.1 683.0
(70.79) (60.47) (47.46) (48.23)
1993 mean test score 598.2 595.7 714.4 713.8
(64.90) (55.53) (45.00) (41.95)
Observations 6,134 870 6,790 758
Behavior
Compliance scale 1.404 1.394 1.458 1.438
(0.441) (0.425) (0.467) (0.449)
Motivation scale 1.715 1.678 1.762 1.744
(0.584) (0.569) (0.592) (0.585)
Class participation 2.017 2.006 2.049 2.032
(0.551) (0.584) (0.584) (0.606) Absenteeism
Days missed 7.255 6.570 6.236 5.692
(6.408) (6.070) (6.020) (5.791)
Excessive absenteeism 0.089 0.077 0.079 0.099
(0.284) (0.267) (0.270) (0.298)
Observations 10,503 1,094 10,615 1,018
Notes: Standard deviations are in parentheses. Descriptive statistics for student demographics are in Appen-dix Table A1.
III. Econometric Approaches
For each cohort, I estimate the effects of Catholic schooling on achievement by using the following value-added equation:
(1) Y5X¢b1C¢a1T¢l1e
eis unobservable student achievement.7By including the 1992 test scores, the value-added model measures the effect of Catholic schooling that is independent of prior achievement, as measured by these scores.
Despite the controls for 1992 test scores, selection bias still may remain in the value-added models. The traditional approach to control for selection bias is the use of Heckman (1979) selection models.8Early work by Coleman, Hoffer, and Kilgore (1982) and others rely on Catholic religion as an instrument. However, Ludwig (1997) and others show that Catholic religion is often not a valid instrument because it should be included in the outcome equation. More recent work on Catholic school-ing utilizes demographic differences in variables that are correlated with Catholic school attendance, such as the percent of the county population that is Catholic (Neal 1997) or the availability of public transportation in the MSA (Figlio and Ludwig 2000).
I explore the possibility of controlling for selection bias with a Heckman and a 2SLS model (with a linear probability model in the rst stage). However, the only candidates for valid instruments are Census region (East, South, Midwest, or West) and community type (urban, suburban, or rural); I do not have more detailed mea-sures of location, nor any measure of student religion. The results from the Heckman (1979) model with no instruments are quite similar to the results using instruments. This nding strongly suggests that the instruments provide little or no explanatory power in the model. The results from the 2SLS model are imprecisely estimated and differ greatly from those in the Heckman model, providing further concern for the appropriateness of these instruments. The results using interactions between region and community type as instruments display the same sensitivity. Therefore, I con-clude that the Prospects data do not contain any reliable instruments to use in a Heckman or a 2SLS model.
Instead, I rely on an alternative method for controlling for the nonrandom selection of students into Catholic schools. The following equation, estimated only for students in the fourth-grade cohort, uses the distribution of the 1992 test scores of the rst-grade cohort to control for selection bias:
(2) Y5X¢b1C¢a1T¢l1S¢q1e
In this model,Y,X,C, andeare dened as in previous equations, andScontains the median 1992 reading and mathematics test score for the rst-grade cohort in each school.9,10The underlying theory is that Scaptures the school level selection in test scores. Because the estimate of the Catholic schooling coefcient (a) in Equa-tion 2 is independent ofS, it is independent of the selection bias that is common to students in the rst- and fourth-grade cohorts. An example of such a school-level selection is a school-level admission requirement testing verbal ability.
7. The results in the next section are simlar to unreported results that include the following school charac-teristics: Percent white, percent low-income, and typical class size.
8. Recent exceptions are Altonji, Elder, and Taber (2000) and Figlio and Ludwig (2000). Goldhaber (1996) uses an approach similar to Heckman (1979) model that includes the inverse Mill’s ratio.
9. Unreported results including the 10th and 90th percentile in addition to the median are nearly identical to the results when only the median is included.
Catholic school attendance likely affects many components of education in addi-tion to academic achievement. Figlio and Ludwig (2000) nd mixed evidence that Catholic high school attendance is associated with lower probabilities of delinquent behavior (such as drug use), but essentially nothing is known about the effect of Catholic primary schooling on outcomes other than test scores. TheProspects data-base contains data on classroom behavior and attendance. Both of these outcomes are positively correlated with market behavior. Children who are not in class or who are poorly behaved are less likely to graduate from high school. Perhaps more importantly, social behavior and attendance are important aspects of the education process that should be studied in their own right.
Data on these outcomes are available for 1992 but not for 1993, so it is not possible to estimate value-added models. Instead, the following levels model is estimated: (3) Z5X¢b1C¢a1v,
whereZis a measure of behavior/ attendance,Xis a vector of student characteristics, C is a dummy variable for Catholic schooling, and e is unobservable student behavior/ attendance. For the fourth-grade cohort, I also estimate models that include the rst-grade school median test scores from 1992 as controls for selection bias.
IV. Results for Test Score Models
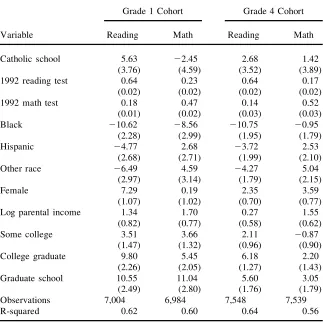
Table 2 contains the regression results from Equation 1 for both co-horts. The rst two columns display results for the rst-grade cohort, whereas the last two columns of the table contain results for the fourth-grade cohort. The depen-dent variable in the rst and third columns is the 1993 total reading standardized test score. In the second and fourth columns, the dependent variable is the 1993 total mathematics standardized test score.11
Catholic primary schooling has an insignicant effect for both cohorts and test scores. For the rst-grade cohort, the coefcient for mathematics is actually negative, suggesting that Catholic schooling is unlikely to have a positive effect for this group of students. The coefcient for reading has ap-value of 0.135. Given the sizable standard error, the possibility exists that Catholic schooling has a positive, and even sizable, effect on reading gains for the rst-grade cohort.12
For the fourth-grade cohort, the coefcient for reading is 2.68 with a standard error of 3.52, and the corresponding values for mathematics are 1.42 and 3.89. These coefcients represent relatively small shares of the standard deviation of 1993 test scores, or of the standard error of test score growth between 1992 and 1993. Thus, Catholic schools do not appear to have a strong positive or negative impact on test scores for the fourth-grade cohort.
Prior test scores and student demographics have similar effects for both cohorts, although the effects differ somewhat between reading and mathematics. As expected,
11. I also estimated models where the dependent variable is the test score growth between 1992 and 1993. In these models, the Catholic schooling coefcients are insigni cant in all model specications (including ones where I control for selection bias).
Table 2
Value Added Regression Results
Grade 1 Cohort Grade 4 Cohort
Variable Reading Math Reading Math
Catholic school 5.63 22.45 2.68 1.42
(3.76) (4.59) (3.52) (3.89)
1992 reading test 0.64 0.23 0.64 0.17
(0.02) (0.02) (0.02) (0.02)
1992 math test 0.18 0.47 0.14 0.52
(0.01) (0.02) (0.03) (0.03)
Black 210.62 28.56 210.75 20.95
(2.28) (2.99) (1.95) (1.79)
Hispanic 24.77 2.68 23.72 2.53
(2.68) (2.71) (1.99) (2.10)
Other race 26.49 4.59 24.27 5.04
(2.97) (3.14) (1.79) (2.15)
Female 7.29 0.19 2.35 3.59
(1.07) (1.02) (0.70) (0.77)
Log parental income 1.34 1.70 0.27 1.55
(0.82) (0.77) (0.58) (0.62)
Some college 3.51 3.66 2.11 20.87
(1.47) (1.32) (0.96) (0.90)
College graduate 9.80 5.45 6.18 2.20
(2.26) (2.05) (1.27) (1.43)
Graduate school 10.55 11.04 5.60 3.05
(2.49) (2.80) (1.76) (1.79)
Observations 7,004 6,984 7,548 7,539
R-squared 0.62 0.60 0.64 0.56
Notes: Robust standard errors that allow within school correlation are in parentheses. In addition to the variables listed in the table, each model includes controls for disability, Chapter 1 receipt, 50 or more books in the household, language minority, single parent, household size, private kindergarten attendance, public kindergarten attendance, age in 1992, region, urbanicity, and dummy variables for missing values for each independent variable except Catholic school attendance and 1992 test scores.
Table 3
Grade 4 Cohort Results Including Grade 1 School Median Test Scores as Controls for Selection Bias
Variable Reading Math
Catholic school 3.37 2.12
(3.60) (3.97) School grade 1 reading median test 20.03 20.03
(0.04) (0.05) School grade 1 math median test 0.05 0.07
(0.04) (0.05)
1992 reading test 0.64 0.17
(0.02) (0.02)
1992 math test 0.14 0.52
(0.03) (0.03)
Observations 7,380 7,371
R-squared 0.64 0.57
Notes: Robust standard errors that allow within school correlation are in parentheses. In addition to the variables listed in the table, each model also includes controls for gender, race, parental income, parental education, disability, Chapter 1 receipt, 50 or more books in the household, language minority, single parent, household size, private kindergarten attendance, public kindergarten attendance, age in 1992, region, urbani-city, and dummy variables for missing values for each independent variable except Catholic school attendance and 1992 test scores.
are larger than in the value-added model. The increase in Catholic schooling coef-cients in Table 3 compared to Table 2 might even suggest negative selection into Catholic schools, a nding that is consistent with the signicantly lower 1992 mathe-matics test scores for Catholic school students.
In summary, I nd little evidence of a positive and signicant effect of Catholic schooling on mathematics or reading test scores. In Table 2, I can also rule out the possibility of large (over 0.10 standard deviations) Catholic schooling effects, except for reading test scores for the rst-grade cohort. In Table 3, where I control for selection bias through the use of the rst-grade cohort, I again nd insignicant Catholic schooling effects. However, the selection bias correction reduces the preci-sion of the estimates.
V. Results for Behavior and Attendance Models
T
h
e
Journal
of
H
um
a
n
R
es
ourc
es
Results for Student Behavior and Absenteeism
Interval Binary
Type of Model Ordinary Least-Squares Regression Regression Probit
Compliance Motivation Class Days Excessive
Variable Scale Scale Participation Missed Absenteeism
Results for Grade 1 cohort
Catholic school 20.019 0.019 20.017 20.692 0.014
(0.032) (0.032) (0.046) (0.425) (0.102)
Observations 10,972 10,973 10,924 11,597 10,850
R-squared 0.14 0.17 0.03
Results for Grade 4 cohort
Catholic school 20.017 0.037 0.028 20.709 0.224
(0.041) (0.047) (0.052) (0.403) (0.082)
Observations 11,071 11,063 10,994 11,633 10,898
R-squared 0.18 0.20 0.03
Results for Grade 4 cohort using 1992 Grade 1 school test scores as regressors
Catholic school 20.019 0.034 0.023 20.690 0.244
(0.041) (0.049) (0.053) (0.438) (0.081)
Grade 1 reading test 0.0005 0.0011 0.0007 20.0093 20.0011
Median for school (0.0005) (0.0006) (0.0006) (0.0058) (0.0012)
Grade 1 math test 20.0004 0.0001 20.0003 0.0008 0.00082
Median for school (0.0005) (0.0006) (0.0006) (0.0058) (0.0013)
Observations 10,626 10,618 10,567 11,087 10,461
R-squared 0.18 0.20 0.03
a positive outcome (such as a highly motivated student). The results in the rst three columns of Table 4 show no evidence of a Catholic school effect on any of the student behavior outcomes. These results hold for the rst- and fourth-grade cohorts and are robust to controls for selection bias.
The dependent variables in the last two columns of Table 4 are measures of student attendance. In the fourth column, the dependent variable is a categorical variable measuring student absences during the 1991– 92 school year (as of March, the time of the survey). This variable comes from the student records, and the six categories are: 0 days missed, 1–2 days missed, 3–4 days missed, 5–10 days missed, 11–20 days missed, and 21 or more days missed. The results for this column are from an interval regression.13In this model, I nd that Catholic school attendance has a nega-tive effect on the number of days missed for both cohorts, although the effect is only signicant (at 10 percent) for fourth-grade cohort. Specically, Catholic schooling is associated with a decrease in days missed of 0.70 days (with a standard error of 0.40).14
The dependent variable in the fth column of Table 4 is a dummy variable equal-ing one if the classroom teacher believes that excessive absenteeism is a problem for the student. In contrast to the results in the ‘‘Days Missed’’ column, the results for the ‘‘Excessive Absenteeism’’ column nd that Catholic schooling is associated with a greater probability of problematic absenteeism for the fourth-grade cohort. This result is signicant at 1 percent, and is robust to controlling for selection bias. The coefcient for the rst-grade cohort is nearly zero and insignicant.
The fact that Catholic schooling reduces actual days missed while increasing the likelihood of excessive absenteeism may seem counterintuitive. Perhaps absenteeism is so problematic in public schools that absenteeism levels that are ‘‘excessive’’ to a Catholic school teacher are much more acceptable for a public school teacher. In other words, the ‘‘excessive absenteeism’’ outcome, along with all the behavioral outcome varibles, are based on teacher reports, and therefore may be affected by possible teacher selectivity between public and Catholic school teachers. The results for the teacher-reported outcomes should be interpreted with caution.
A. Results by race/ethnicity and income
Most studies of Catholic high school attendance nd that Catholic high school effects are most pronounced for urban minority students. However, in unreported results, the results for Hispanics, blacks, or low-income students are similar to those in Tables 2, 3, and 4, although the results by race/ethnicity and income are less precisely esti-mated.15This similarity is not surprising, as theProspectsdata focus on schools with large disadvantaged populations, so that the data contain many low-income, non-white students.
13. This model is similar to an ordered probit model, except that the interval regression utilizes the fact that the cutoff points between categories are known.
14. These results are nearly identical to results from an OLS regression where the dependent variable is the midpoint of the interval (for example, 1.5 in the ‘‘1– 2 days missed’’ category).
VI. Conclusion
The results from the value-added specication nd insignicant ef-fects of Catholic primary schooling on mathematics or reading test scores for stu-dents in both cohorts. Most of the coefcients are near zero, suggesting the Catholic schooling has no discernable positive or negative effect on student achievement. The exception is the coefcient in the rst-grade reading regression, where the possibility of a large Catholic school effect does exist. For the fourth-grade cohort, Catholic schooling is associated with a modest decrease in student absences of roughly one day a year, but Catholic school teachers aremorelikely than public school teachers to report that excessive absenteeism is a problem. The results for all outcomes in the fourth-grade cohort are robust to the use of school level test scores in the rst-grade cohort as controls for selection bias. Overall, I do not nd large, positive effects of Catholic schooling for primary schools even though such effects are common in the Catholic high school literature.
Jeps
en
939
Descriptive Statistics for Test Score Sample
Grade 1 Cohort Grade 4 Cohort
Public Catholic Public Catholic
Standard Standard Standard Standard
Variable Mean Deviation Mean Deviation Mean Deviation Mean Deviation
White 0.591 0.492 0.293 0.455 0.549 0.498 0.225 0.418
Black 0.217 0.412 0.348 0.477 0.203 0.402 0.345 0.476
Hispanic 0.124 0.329 0.273 0.446 0.168 0.374 0.349 0.477
Other race 0.068 0.252 0.086 0.281 0.079 0.270 0.081 0.274
Female 0.488 0.500 0.487 0.500 0.506 0.500 0.525 0.500
Parental income (000s) 30.04 23.43 38.07 24.35 32.00 24.31 36.92 24.18
Parent—no college 0.494 0.500 0.328 0.470 0.501 0.500 0.389 0.488
Parent—some college 0.362 0.481 0.467 0.499 0.337 0.473 0.441 0.497
Parent—college graduate 0.107 0.309 0.160 0.367 0.113 0.317 0.130 0.337
Parent—graduate school 0.038 0.191 0.045 0.208 0.050 0.217 0.040 0.197
Household size 4.570 1.454 4.462 1.550 4.642 1.472 4.370 1.254
Chapter 1 receipt 0.318 0.466 0.212 0.409 0.318 0.466 0.291 0.455
501books in household 0.829 0.377 0.869 0.337 0.837 0.369 0.877 0.329
Disability 0.272 0.445 0.203 0.403 0.267 0.442 0.208 0.406
Language minority 0.075 0.263 0.079 0.269 0.111 0.314 0.177 0.382
Single parent 0.225 0.418 0.242 0.428 0.230 0.421 0.258 0.438
Private kindergarten 0.054 0.226 0.672 0.470 0.082 0.275 0.576 0.495
Public kindergarten 0.784 0.412 0.182 0.386 0.744 0.436 0.288 0.453
Age in 1992 7.173 0.477 7.052 0.431 10.250 0.524 10.101 0.505
East 0.233 0.423 0.471 0.499 0.221 0.415 0.534 0.499
South 0.388 0.487 0.106 0.308 0.385 0.487 0.125 0.331
Midwest 0.173 0.378 0.191 0.393 0.158 0.365 0.166 0.373
Urban 0.469 0.499 0.870 0.336 0.480 0.500 0.892 0.311
References
Altonji, Joseph, Todd Elder, and Christopher Taber. 1999. ‘‘The Effectiveness of Catholic Schools.’’ Northwestern University. Unpublished.
———. 2000. ‘‘Selection on Observed and Unobserved Variables: Assessing the Effective-ness of Catholic Schools.’’ National Bureau of Economic Research Working Paper Num-ber 7831.
Bryant, Edward C. 1993. ‘‘Prospects: The Congressionally Mandated Study of Educational Growth and Opportunity. Technical Report #1: Sampling Procedures for the Baseline and First Follow-up Surveys.’’ Abt Associates. Unpublished.
Coleman, James S., Thomas Hoffer, and Sally Kilgore. 1982.High School Achievement: Public, Catholic, and Private Schools Compared. New York: Basic Books.
CTB Macmillan/ McGraw-Hill. 1989. ‘‘Comprehensive Test of Basic Skills, Fourth Edi-tion: Technical Bulletin 1.’’ Monterey, Calif.: CTB Macmillan/ McGraw-Hill School Pub-lishing Company.
Evans, William N., and Robert M. Schwab. 1995. ‘‘Finishing High School and Starting College: Do Catholic Schools Make a Difference?’ ’Quarterly Journal of Economics 110(4):941– 74.
Figlio, David N., and Jens Ludwig. 2000. ‘‘Sex, Drugs, and Catholic Schools: Private Schooling and Non-market Adolescent Behaviors.’ ’ National Bureau of Economic Re-search Working Paper Number 7990.
Figlio, David N., and Joe A. Stone. 1999. ‘‘School Choice and Student Performance: Are Private Schools Really Better?’’Research in Labor Economics18(1):115– 40.
Goldhaber, Dan. 1996. ‘‘Public and Private High Schools: Is School Choice an Answer to the Productivity Problem?’’Economics of Education Review15(2):93– 109.
Grogger, Jeff, and Derek Neal. 2000. ‘‘Further Evidence on the Effects of Catholic Second-ary Schooling.’ ’ InBrookings-Wharton Papers on Urban Affairs, ed. William G. Gale and Janet Rothenberg Pack. Washington, D.C.: The Brookings Institution.
Heckman, James J. 1979. ‘‘Sample Selection Bias as a Specication Error.’’Econometrica 47(1):153– 67.
Howell, William G., Patrick J. Wolf, Paul E. Peterson, and David E. Campbell. 2000. ‘‘Test-Score Effects of School Vouchers in Dayton, Ohio, New York City, and Washing-ton, D.C.: Evidence from Randomized Field Trials.’’ Harvard University. Unpublished. Jepsen, Christopher. 2000. ‘‘The Private Schooling Market and Its Effects on Student
Achievement.’ ’ Ph.D. dissertation. Evanston, Ill.: Northwestern University.
Jones, Ann M. 1997. ‘‘Differential Effectiveness: Catholic and Public Fourth Graders’ Per-formance on the 1992 NAEP Mathematics Assessment.’ ’ Ph.D. dissertation. Boston, Mass.: Boston College.
Lee, Valerie E., and Carolee Stewart. 1989. ‘‘National Assessment of Educational Progress Prociency in Mathematics and Science: 1985– 1986, Catholic and Public Schools Com-pared.’’ Washington, D.C.: National Catholic Educational Association.
Ludwig, Jens. 1997. ‘‘Educational Achievement in Public, Private, and Catholic Schools: New Evidence on What We Know (and Don’t Know).’’ Georgetown University. Unpub-lished.
Neal, Derek. 1997. ‘‘The Effects of Catholic Secondary Schooling on Educational Achieve-ment.’’Journal of Labor Economics15(1):98– 123.
Peterson, Paul E., Jay P. Greene, and William G. Howell. 1999. ‘‘An Evaluation of the Cleveland Scholarship Program after Two Years.’’ Harvard University. Unpublished. Peterson, Paul E., David Myers, and William G. Howell. 1999. ‘‘An Evaluation of the
Puma, Michael. 1995. ‘‘Prospects: The Congressionally Mandated Study of Educational Growth and Opportunity. Findings from the 1992 Catholic School Supplement.’ ’ Bethesda, Md.: Abt Associates.
Sander, William. 1996. ‘‘Catholic Grade Schools and Academic Achievement.’ ’Journal of Human Resources 31(3):540– 48.