On: 29 Sept em ber 2013, At : 21: 02 Publisher: Rout ledge
I nform a Lt d Regist ered in England and Wales Regist ered Num ber: 1072954 Regist ered office: Mort im er House, 37- 41 Mort im er St reet , London W1T 3JH, UK
Accounting and Business Research
Publicat ion det ails, including inst ruct ions f or aut hors and subscript ion inf ormat ion: ht t p: / / www. t andf online. com/ loi/ rabr20
Investor relations meetings: Evidence from the top 500
UK companies
Claire Marst on a a
Prof essor at t he School of Management and Languages, Heriot‐Wat t Universit y, Riccart on, Edinburgh, EH14 4AS Phone: 0131 451 8007/ 3542 Fax: 0131 451 8007/ 3542 E-mail:
Published online: 04 Jan 2011.
To cite this article: Claire Marst on (2008) Invest or relat ions meet ings: Evidence f rom t he t op 500 UK companies, Account ing and Business Research, 38: 1, 21-48, DOI: 10. 1080/ 00014788. 2008. 9663318
To link to this article: ht t p: / / dx. doi. org/ 10. 1080/ 00014788. 2008. 9663318
PLEASE SCROLL DOWN FOR ARTI CLE
Taylor & Francis m akes every effort t o ensure t he accuracy of all t he inform at ion ( t he “ Cont ent ” ) cont ained in t he publicat ions on our plat form . How ever, Taylor & Francis, our agent s, and our licensors m ake no
represent at ions or warrant ies w hat soever as t o t he accuracy, com plet eness, or suit abilit y for any purpose of t he Cont ent . Any opinions and view s expressed in t his publicat ion are t he opinions and view s of t he aut hors, and are not t he view s of or endorsed by Taylor & Francis. The accuracy of t he Cont ent should not be relied upon and should be independent ly verified w it h prim ary sources of inform at ion. Taylor and Francis shall not be liable for any losses, act ions, claim s, proceedings, dem ands, cost s, expenses, dam ages, and ot her liabilit ies w hat soever or how soever caused arising direct ly or indirect ly in connect ion w it h, in relat ion t o or arising out of t he use of t he Cont ent .
This art icle m ay be used for research, t eaching, and privat e st udy purposes. Any subst ant ial or syst em at ic reproduct ion, redist ribut ion, reselling, loan, sub- licensing, syst em at ic supply, or dist ribut ion in any
1. Introduction
Investor relations is a management discipline that first came to prominence in the US but which has gained increasing importance in the UK over the past two decades. Both of these countries possess significant equity markets and accounting has been oriented towards the decision making needs of investors. In both countries investor relations professionals have formed their own associations. The UK Investor Relations Society was founded in 1980. In the US the National Investor Relations Institute (NIRI), which was formed in 1969, has defined investor relations as:
‘... a strategic management responsibility using the disciplines of finance, communication and marketing to manage the content and flow of
company information to financial and other con-stituencies to maximise relative valuation.’ (NIRI, 2002)
Understanding investor relations helps in our un-derstanding of the operation of capital markets. Rao and Sivakumar (1999) reported that the num-ber of US Fortune 500 companies with IR depart-ments rose from 16% to 56% in the period 1984 to 1994 and more recently Bushee and Miller (2005) commented on the lack of academic research into the investor relations process. Accordingly, they used interviews, a web-based opinion survey of in-terviewees and empirical testing (using data exter-nal to the firm) in their study of investor relations, firm visibility and investor following in the US.
This paper contributes to the literature by pre-senting, discussing and analysing results of survey research in 2002 into the practice of investor rela-tions, especially investor relations meetings, in the UK. The survey research results contained both numerical data (allowing a cross-sectional model-ling approach) and ranking scale data on percep-tions of and opinions about investor relapercep-tions. Both types of data enable us to explain more about investor relations in the context of the investor re-lations and disclosure literature and the two-di-mensional model derived from the literature. A unique contribution of this paper is the availability of comparative survey data from 1991 which en-Accounting and Business Research,Vol. 38. No. 1. pp. 21-48. 2008 21
Investor relations meetings: evidence from
the top 500 UK companies
Claire Marston*
Abstract—Meetings with analysts and investors are an important part of the investor relations process. I develop a two-dimensional dynamic model of investor relations and derive five research questions about investor relations with particular emphasis on investor relations meetings. To answer the questions I obtain data in 2002 from company managers using a questionnaire survey of top UK companies. Comparative data from 1991 is used to establish whether company- or market-side change drivers have led to changes over time. A key research question seeks an explanation for the differences in level of IR activity between companies. I develop a cross-sectional model and test the model using survey data.
Key findings are that one-to-one meetings were ranked as the most important communication channel with analysts and investors both in 2002 and 1991. Companies were positive about their relationship with analysts and investors with similar perceptions to those held in 1991. An explanation of recent results, the creation of share-holder value and discussion of company strategy were rated as the most important issues discussed at IR meetings. The level of investor relations activity, as measured by the number of one-to-one meetings and audience size, had increased over the period.
A greater number of one-to-one meetings were held by companies with a higher number of institutional investors, greater analyst following, foreign listings, extreme market-to-book values and recently issued share capital. The size of the audience for investor relations meetings of all types was largely driven by company size and analyst following in respect of sell-side analysts. The existence of foreign listings was the most important explanatory variable for the size of the audience of buy-side analysts and fund managers.
Key words: investor relations; meetings; sell-side analysts; buy-side analysts; institutional investors
*The author is a professor at the School of Management and Languages, Heriot-Watt University. She wishes to thank par-ticipants at the British Accounting Association Annual Conference 2004, University of York, for their helpful com-ments on an earlier version of this paper. Professor Ken Peasnell, former editor of ABR, and Professor Pauline Weetman have both provided valuable help and advice. She also acknowledges the useful comments from the anonymous referees. Figure 1 was suggested by one anonymous referee after the first review of the paper and she is grateful for this. Correspondence should be addressed to: Professor Claire Marston, School of Management and Languages, Heriot-Watt University, Riccarton, Edinburgh EH14 4AS. Tel: 0131 451 8007/3542, Fax: 0131 451 3296. E-mail: [email protected] This paper was accepted for publication in October 2007.
ables an examination of changes over time. The paper is organised as follows: Section 2 re-views the literature relating to investor relations in general and to investor relations meetings in par-ticular and develops a dynamic two-dimensional model placing investor relations in context in the capital markets. In Section 3 this model is used to derive the research questions. Section 4 discusses the research approach taken in this project in order to collect data about investor relations meetings. In Section 5 the results relating to the individual re-search questions are presented, discussed and analysed. Section 6 contains a discussion and con-clusions.
2. Literature review and two-dimensional
model
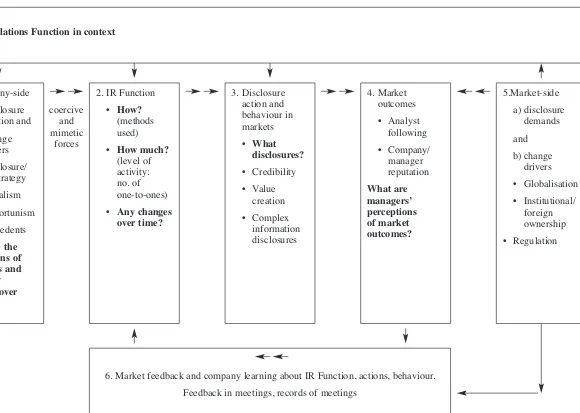
This review considers research into investor rela-tions paying particular reference to the establish-ment of a theoretical framework within the disciplines of accountancy and finance (broadly defined). The theoretical framework is delineated by a two-dimensional model (see Figure 1) draw-ing on insights from the literature.
2.1. The company’s disclosure position and drivers of change
Investor relations is a multi-disciplinary man-agement function but one main theoretical ap-proach for studying the subject has been disclosure theory. In this approach, investor relations is viewed as a method or type of disclosure. Disclosure theory research has differentiated be-tween mandated and voluntary disclosures. Healy and Palepu (2001) identified six hypotheses relat-ing to managers’ voluntary disclosure decisions: the capital markets transaction/cost of capital hy-pothesis, the corporate control contest hyhy-pothesis, the stock compensation hypothesis, the litigation cost hypothesis, the management talent signalling hypothesis and the proprietary cost hypothesis. All of the above hypotheses have implications for the investor relations function. Investor relations as an activity is voluntary although much of the content of the disclosure is based on mandatory disclo-sures. Voluntary disclosure of additional non-mandatory information via the investor relations function has been increasingly constrained by regulations on the disclosure of price sensitive in-formation. However, once non-mandatory infor-mation has been disclosed to the market it may be discussed and explained via the investor relations function.
A corporate disclosure strategy (Figure 1, Box 1) (see Lev, 1992 and Eccles and Mavrinac, 1995) may involve the establishment and upgrading of the investor relations function (Box 2).
Healy and Palepu (2001) discuss the importance of the credibility of voluntary disclosure. If
disclo-sures are credible they will have market outcomes (Box 4) and an effect on variables such as stock price and may lead to analysts’ forecast revisions and increased accuracy of forecasts. A competent professional investor relations function may be used to enhance the credibility of company disclo-sure.
A framework for the management of corporate disclosure was developed by Gibbins et al. (1990). Their findings indicated that a firm’s readiness to disclose is a function of its developed ‘disclosure position’ (Box 1). This can be considered in terms of ‘ritualism’, ‘opportunism’ and ‘antecedents’. Ritualism is defined as a relatively stable prefer-ence for the way disclosure is managed so firms tend to adhere to prescribed norms of disclosure. Opportunism is the propensity to seek firm specif-ic advantages in the disclosure of information. Internal antecedents include the firm’s history of disclosure, corporate strategy and corporate poli-tics. External antecedents include rules, industry norms and market position of the firm. Variables related to opportunism and antecedents change over time and act as change drivers.
Self-seeking behaviour by managers is also an issue affecting the disclosure position. Hong and Huang (2005) employed mathematical modelling to show that insiders invest resources in investor relations not necessarily to improve the share price, but to enhance the liquidity of their own block of shares.
Building on the disclosure literature and taking a qualitative grounded theory approach, Holland (2004) investigated the demand and supply side determinants of the disclosure agenda and estab-lished the central role of the value-creation ‘story’ in disclosure. The investor relations function can assist in crafting this story.
Rao and Sivakumar (1999) considered investor relations from the standpoint of institutional theo-ry. They noted the ‘boundary spanning’ nature of investor relations and traced the rise of investor re-lations in the 1980s. They suggested that ‘coercive pressures’ from the investor rights movement would lead to the establishment of investor rela-tions departments in US firms. Additionally pres-sures from financial analysts acting as professionals and watchdogs were expected to in-fluence investor relations department formation (Figure 1, link between Box 1 and 2). ‘Mimetic in-fluences’ were also expected to lead to the estab-lishment of investor relations departments. ‘Board interlocks’ with prior adopters of investor relations departments and the number of adopters within the firm’s industry were considered likely to lead to adoption of an investor relations department. Empirical testing of their model gave support to their hypotheses (Table 1).
V
ol
. 38 N
o. 1. 2008
23
Figure 1
The Investor Relations Function in context
coercive and mimetic
forces 1. Company-side
a) Disclosure position and b) Change
drivers • Disclosure/
IR strategy • Ritualism • Opportunism • Antecedents
What are the perceptions of managers and have they changed over time?
2. IR Function
• How?
(methods used)
• How much?
(level of activity: no. of one-to-ones)
• Any changes
over time?
3. Disclosure action and behaviour in markets
• What
disclosures?
• Credibility • Value
creation • Complex
information disclosures
4. Market outcomes • Analyst
following • Company/
manager reputation
What are managers’ perceptions of market outcomes?
5.Market-side a) disclosure
demands and b) change
drivers • Globalisation • Institutional/
foreign ownership • Regulation
6. Market feedback and company learning about IR Function, actions, behaviour. Feedback in meetings, records of meetings
24
A
CCO
U
N
T
IN
G
A
N
D
BU
SIN
E
SS
RE
SE
A
RCH
Table 1
Explanatory variables used in explaining IR actions and disclosure levels
Authors Marston Lang & Tasker Frankel et al. Rao & Gelb (2000) Bushee et al.
(1993) Lundholm (1998) (1999) Sivakumar (2003)
(1993) (1999)
Dependent variables Various IR disclosure Conference Conference Adoption of IR disclosure Real time open
calls calls IR dept. access to
conference calls as opposed to closed calls
Independent variables13
Firm size (+)(? For B,M&M14) Y Y Y Y Y Y N
Performance – share price (+) Y Y
Return variability (+) N Mixed Y N
Beta (+) N
Specific risk (+) N
Trading activity/frequency(+) N N Y
Performance – accounting numbers (+) N Mixed Y Y & N N
Volatility of operating performance (–) Y (opp)
Riskiness – accounting numbers/ N Y N N
gearing (+)
Correlation between annual returns YY
and earnings (–)
Raising of capital (+) Y Y (N for debt) N (Y for debt) N Y
Informativeness of financial Y (4 industry
statements (–) level measures)
Market to book (+)(– for B,M&M) Y N
Institutional ownership (+) Y Y N Y
(– for B,M&M)
Insider ownership (+) Y Y marginal
Ownership dispersion (+) Y
Analyst following (+)(– for B,M &M) Y Y Y Y
Proprietary costs (+) N/A (omit N
oligopoly from sample)
Industry classification/High tech (+) N Y
(– for B,M &M)
V
ol
. 38 N
o. 1. 2008
25
Table 1
Explanatory variables used in explaining IR actions and disclosure levels (continued)
Authors Marston Lang & Tasker Frankel et al. Rao & Gelb (2000) Bushee et al.
(1993) Lundholm (1998) (1999) Sivakumar (2003)
(1993) (1999)
CEO career concerns – age (–) Y
Shareholder litigation (?) Y
Extraordinary/unusual items in N N
earning (+)
Anti-management resolutions (+) Y
Board interlocks with prior adopters Y
of IR Depts. (+)
No. of adopters of IR Depts. N
in industry (+)
Time trend measure (+) Y
Centrality (+) Y Marginal
Industry level ERC R square (+) Y Marginal
Intangibles (–) Y
Firm Age (?) N
Takeover activity (+) N
Employees (stakeholders) (+) N
Foreign listing (+) Y
Y= indicates a significant result or results, N = not significant, opp. = in opposite direction to that hypothesised, use of more than one proxy indicated by Y Y etc.15
13Expected direction of effect in brackets.
14B,M&M is Bushee Matsumoto & Miller (2003). The different expected direction of relationship in some cases is related to the nature of the dependent variable. 15A more detailed version of this summary can be obtained from the corresponding author.
2.2. Explanations for disclosure actions of the investor relations function
Several studies (Marston, 1993; Lang and Lundholm, 1993; Tasker, 1998; Frankel et al., 1999; Gelb, 2000; Bushee et al., 2003) have at-tempted to explain investor relations activity and disclosure (Box 3). The studies make use of vari-ous theories and hypotheses discussed by Myers (1977), Diamond (1985), Verrecchia (1990), Lev and Penman (1990), Healy and Palepu (2001), Skinner (1995) and Lev (1996). Each study takes a different approach and most of them also refer to prior empirical studies (e.g. Clarkson et al., 1994; Ruland et al., 1990; Frankel, et al., 1995; in creat-ing their model. Table 1 illustrates the wide diver-sity of dependent and explanatory variables used (with up to 13 in one model) and results obtained. Bushee et al. (2003) consider that the existence of ‘complex information disclosures’ means that companies will hold closed conference calls with experts rather than open calls. The idea that ‘com-plex information disclosures’ drive the need for in-vestor relations disclosure or a particular type of investor relations disclosure is reflected in many of the other models. For example, Tasker (1998) looks at whether less informative financial state-ments lead to a need for conference calls and uses industry level market-to-book as one proxy for this. Size itself, although often relegated to the role of a control variable, can also be viewed as a proxy for complexity. The existence of complex informa-tion disclosures is likely to exacerbate informainforma-tion asymmetry and this is reflected in the models that include intangibles or market to book values.
Table 1 provides evidence that differing levels of investor relations activity/disclosures can be ex-plained by disclosure and institutional theories al-though the evidence is mixed and theoretical approaches differ between authors. The measures of investor relations activity in these studies (apart from Marston, 1993) are obtained by external ob-servation to the firm and this provides a motivation for further investigation of internally provided measures in the light of new theoretical perspec-tives.
2.3. Studies testing whether investor relations has any effect/market outcome
Investor relations disclosures, if they are credi-ble, should have an effect or market outcome (Figure 1, Box 4) of some kind. Brennan and Tamarowski (2000) argue that a firm’s information disclosure policy should enable it to influence the extent of analyst following. They also note that ‘a firm’s disclosure policy is perhaps the most signif-icant aspect of its investor relations management’. They review the literature relating to investor rela-tions, liquidity and stock prices. Their review shows that investor relations activities reduce the
cost of information to analysts and lead to a greater analyst following. Their empirical evidence shows that analyst following increases a stock’s liquidity in the US. Thus by an indirect route they demon-strate an effect for investor relations.
Empirical studies by Walmsley et al. (1992), Farragher et al. (1994), Lang and Lundholm (1996), Brooks et al. (1997), Francis et al. (1997), Frankel et al. (1999), Bushee et al. (2003) and Bushee and Miller (2005) investigate the effect of various investor relations actions on several vari-ables. Table 2 summarises the positive and nega-tive results obtained.
On balance it appears from the above evidence that investor relations disclosures do have an effect and this implies that they are credible to partici-pants in the capital markets. Peasnell et al. (2005) noted however that ‘the market-related conse-quences of corporate investor relations activity re-main an unresolved empirical issue.’ In their study they found that low confidence in accounting cred-ibility post Enron also damaged confidence in in-vestor relations contrary to anecdotal evidence that good investor relations protects companies in peri-ods of market crisis.
2.4. Market feedback and company learning
Roberts et al. (2006: 278) noted that institution-al ownership in the UK has become much more concentrated than it was 20 or 30 years ago and they therefore suggested that investors have been given ‘both the opportunity and the need to active-ly manage their relationship with companies’. They applied the theories of Foucault to suggest that meetings between companies and fund man-agers remind manman-agers of their primary objective, the pursuit of shareholder value (Figure 1, Box 6). Their analysis pursued the ‘theme of meetings as an exercise of discretionary power’ and developed Rao and Sivakumar’s (1999) ideas.
Holland (2006: 82) also stresses the importance of market feedback in his model of corporate and market interaction. Non-observable stock market outcomes can be inferred from an active dialogue with market participants (Holland 2006: 118).
2.5 Company- and market-side change drivers
The two-dimensional model outlined in Figure 1 is a necessarily simplified attempt to encapsulate previous research contributions about the context of investor relations. The linking arrows between the boxes can represent different functional forms of relationships. There might be a monotonic rela-tionship between more disclosure (Box 3) and analyst following (Box 4) whereas other relation-ships could be more complex and less amenable to being expressed mathematically. The relationships are influenced over time by change drivers (Boxes 1 and 5). The investor relations function in Box 2
V
ol
. 38 N
o. 1. 2008
27
Table 2
Effect of IR actions and disclosure levels on the market
Authors Walmsley Farragher Lang and Brooks Francis Frankel Bushee Bushee &
et al. (1992) et al. (1994) Lundholm et al. (1997) et al. (1997) et al. (1999) et al. (2003) Miller
(1996) (2005)
Independent variable Company/ IR quality Informa- CEO Analyst Conference Real time Hiring an
analyst tiveness presentations presentations calls access to IR firm
meetings16 of firm’s conference
disclosures calls as
(including opposed to
IR) closed calls
Dependent variables
Abnormal returns (+) Y
Variance of abnormal returns (+) Y
Volatility of returns (+) Y YY
Increase in small trades (+) Y
Trading volume/activity (+) N Y N YY
Analyst following (+) Y Y Y
Forecasting activity (+) Y
Dispersion of analysts’ forecasts (–) Y Y N
Accuracy of analysts’ forecasts (+) N Y N
Bias in analysts forecasts (–) N
Volatility in forecast revisions (–) Y
Investor base (+) N
Trading costs (–) N
Institutional ownership (+) YY
Disclosure and press coverage (+) YY
Market value/Book to price (–) Y
Y= indicates a significant result or results, N = not significant
16organised by UK Society of Investment Analysts.
mediates the relationship between company-side change drivers (Box 1) and disclosure actions. In respect of market-side change drivers the arrow along the top of Figure 1 shows how feedback may occur directly. For example new regulation will cause the company to change disclosure and a new disclosure position will become established. By a less direct route globalisation will lead to market outcomes (Box 4) and the company will learn and adapt (Box 6). The arrows in Figure 1 illustrate only the main expected linkages to avoid compli-cation.
The literature has provided evidence that in-vestor relations activity has changed over time with the establishment of investor relations depart-ments (Rao and Sivakumar, 1999) and greater use of conference calls (Tasker, 1998 and Bushee et al., 2003). I expect that environmental factors (market-side change drivers, Box 5b) have contributed to changes in the investor relations industry.
Globalisation has increased competition in the world’s capital markets and companies wishing to market their capital internationally perceive the need to professionalise and enhance their investor relations efforts. (See, for example, Gray (2000) who discussed the need for US companies to market their stocks to European investors and Holland’s (2004: 68) discussion of the internation-alisation of the market for information.) Stulz (1999: 24) noted that globalisation of capital mar-kets increases the monitoring of management and hence increases firm value. This extra monitoring increases the work of the investor relations depart-ment. Yoshikawa and Gedajlovic (2002) examined whether greater exposure to global capital markets had any impact on Japanese firms’ investor rela-tions practices and found that foreign ownership and foreign listings were positively associated with investor relations.
For UK listed companies institutional ownership of shares declined from 60.1% to 49.4% over the period 1991 to 2002 but there was an increase in foreign (‘rest of the world’) ownership of ordinary shares from 12.8% to 32.1%. Individual ownership dropped from 19.9% to 14.3% (National Statistics, 2003: 9 Table A). This increase in foreign owner-ship over the period studied in this paper places increased demands on UK investor relations de-partments. Difficult UK stock market conditions, with a bear market in 2001 to 2003, will have stim-ulated some companies into trying harder with their investor relations efforts whereas other com-panies will have made a strategic decision not to invest more effort in investor relations until condi-tions improved.
Increased amounts of rules and regulations will have enabled investor relations departments to argue for greater resources to deal effectively with the additional requirements. Changes in the
regu-latory environment will have caused companies’ investor relations departments to adopt new prac-tices, such as more extensive recording of private disclosures (see results section later) or live web casting of results presentations.
At the individual company level there are many potential change drivers. The general environmen-tal factors mentioned above will have affected some companies more than others (Bushee and Miller, 2005: 18). For example, during the dot.com boom ‘old economy’ companies may have decided to invest more in investor relations if they felt the market was undervaluing their stocks during the bubble period (see Holland 2006: 112–114). Additionally, variables identified in Table 1 will have influenced some companies’ investor rela-tions efforts more than others’. Company man-agers are also change drivers because they are responsible for disclosure strategy, and for any changes in investor relations, as discussed by Lev (1992) and Gibbins et al. (1990).
The availability of company data at two points in time enables the effect of change drivers on in-vestor relations activity levels and perceptions about investor relations to be assessed in this paper. However it is outside the scope of this proj-ect to measure change drivers or to establish sta-tistical relationships between measures of change drivers and company investor relations data.
2.6. Motivation for exploring the two-dimensional model
Bushee and Miller (2005) noted the widespread use of investor relations and the large costs in-curred. They also commented that little academic research has focused on the investor relations process and stated that there was a paucity of dis-cussion of the complete investor relations process in the literature. Notwithstanding their comment, in the UK qualitative research on investor relations meetings had been carried out by Holland (1997, 1998), Marston (1999) and Roberts et al. (2006). This paper provides a new contribution by de-scribing and analysing investor relations meetings in the context of the whole investor relations process. It updates prior work in the UK and draws on theoretical understandings that have been de-veloped by a number of authors in recent years.
The quantitative models discussed in the litera-ture review are not sophisticated in terms of delin-eating the details of the relationships between variables. Most of the literature explaining in-vestor relations (Figure 1, Box 3) suggests that something (e.g. adoption of an investor relations department) will happen if certain factors are in place or that there will be a positive or negative as-sociation between certain variables and investor relations variables. It is also possible that extreme values (high and/or low) of a variable may be
sociated with an effect on an investor relations variable (giving a U-shaped or step function rela-tionship rather than a montonic one (Gelb 2000: 181). There are also some findings showing that company variables are associated with changes in investor relations disclosure scores (Lang and Lundholm, 1993: 266). The papers reviewed in Tables 1 and 2 contain some results inconsistent with theory and differing results according to model specification. The qualitative approaches taken by Holland (2004) and Roberts et al. (2006) attempt to deal with complexities involved in human interaction. A perfect theory that can ex-plain and predict exactly how individual compa-nies implement investor relations, what they communicate, the level of investor relations activ-ity and how changes will occur over time in re-sponse to change drivers is not likely to be achieved because of the complexities outlined in Figure 1. This study aims to offer an improved in-sight informed both by the positive theory ap-proach, empirical results arising from hypothesis testing and the qualitative research agenda. Accordingly, the study presents data about the in-vestor relations process, activity levels and per-ceptions of investor relations, explains this data in the context of the two-dimensional model and models the investor relations activity levels using a regression model.
3. The research questions and hypotheses
Having constructed the two-dimensional model in Figure 1, the main research questions are: how is the investor relations function carried out, how much investor relations is carried out, how can dif-ferences between companies be explained, what are the perceptions of management about what is going on and how has the situation changed over time in response to change drivers? In more detail I state the questions as follows:• RQ1 How does the company investor relations function operate in communicating with analysts and investors (Boxes 2 and 6) and what is the perceived relative importance of the various methods both now (Box 1a) and in the past (Box 1b)?
• RQ2 What is the company management’s per-ception of its relationship with analysts and in-vestors (Box 1a) and in the past (Box 1b and Box 5) and what is the company management’s perception of the benefits of investor relations meetings and the effect of investor relations overall (Boxes 1 and 4)?
‘Market outcomes’ (Box 4) have been researched empirically as documented in the literature review. For the purposes of this study company respon-dents’ perceptions of market outcomes were
ob-tained in order to answer the research question. • RQ3 What topics are discussed at investor
rela-tions meetings (Boxes 3 and 5) and what is the perceived relative importance of the various top-ics discussed both now (Box 1a) and in the past (Box 1b)?
In respect of the research questions relating to perceptions I expect from the literature review that respondents from larger companies will tend to view investor relations and its elements as being more important than respondents from smaller companies. Six out of seven of the empirical pa-pers summarised in Table 1 found that size was a significant explanatory variable for the dependent investor relations variable in a multivariate regres-sion model. This leads to the following question: • RQ4 Is there an association between company
size and respondents’ perceptions about the im-portance and value of investor relations?1
The final question is a key question in this paper because it deals not with respondents’ rating scale perceptions or yes/no variables but with numerical measures of investor relations that can only be ob-tained from company insiders. Prior explanatory research as detailed in Table 1 (apart from Marston, 1993) uses externally observed dichoto-mous measures or continuous measures of percep-tions from the US Financial Analysts’ Federation (FAF).
• RQ5 What is the level of investor relations activity of the company, has it changed over time and what determines the current level of activity?
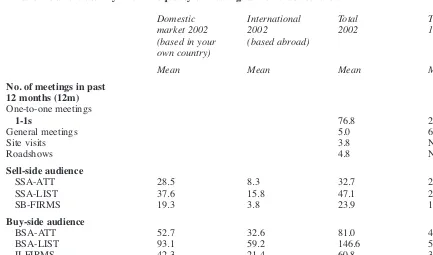
Investor relations activity is defined as a latent variable representing the amount of organisational effort or resources devoted to investor relations. There are many proxies that can be used to meas-ure investor relations activity. I use the number of one-to-one investor relations meetings held by the company and the size of the potential and actual audience attending any type of investor relations meeting (Box 2).
The empirical literature attempting to explain vestor relations activity (Table 1) provided an in-centive for testing a regression model of the level of investor relations activity (RQ5) as measured by the number of investor relations meetings and the size of the audience. The results demonstrated a wide variation between companies in respect of the number of investor relations meetings held and the size of the audience. (Descriptive statistics are
Vol. 38 No. 1. 2008 29
1I acknowledge that other company specific variables are also likely to affect perceptions of company respondents. However given that perceptions are evaluated on a ranking scale which is ordinal in nature it is not proposed to attempt further analysis of the reasons for different responses.
shown later in Tables 9 and 10). Bearing in mind the theories and findings presented in the literature review, there were several potential variables that might explain the observed variations in the data and help to answer the research question. These will now be discussed.
3.1. Ownership structure and dispersion
Ownership structure and dispersion of share-holdings can be measured in a number of ways. In this study I take three measures as proxies. Dealing first with geographical dispersion, I ex-pect that companies with foreign listings are likely to hold more one-to-one meetings, possibly as part of a roadshow, in order to meet the needs of for-eign investors. Previous research has shown that firms with international listings tend to disclose more information, both in their annual reports and by other means, than firms with a domestic listing only (Ahmed and Courtis, 1999). It seems likely that international listing will cause firms to put more effort into their investor relations function. As the US is generally held to be the world’s lead-ing capital market with the most strict regulations it is possible that a US listing will have more effect on disclosure than a listing elsewhere. Foreign list-ings are likely to stimulate demand for meetlist-ings from analysts and fund managers based in those markets. Marston (1993: 234) found that a foreign listing status was significantly positively associat-ed with the number of one-to-one meetings. The hypothesis is:
H1 A company’s listing status (foreign rather than domestic only) is positively associated with the level of investor relations activity.
In respect of dispersion among shareholders I ex-pect that the total number of shareholders will not affect the number of one-to-one meetings as these are reserved for analysts and investing institutions. However the level of free-float, the percentage of shares available to be traded on the market, may have an effect on a company’s incentive to hold one-to-one meetings. Also, if a large proportion of the equity is in permanent ownership (possibly by the founding family) and not available for trading on the stock exchange there may be little point in devoting extensive efforts to investor relations. Thus there may be fewer one-to-one meetings and fewer participants in such meetings when a compa-ny has a low free-float, and a high proportion of shares held by the board, family and associates. Marston (1993: 234–235) found the percentage of insider shareholdings was significantly negatively related to the number of one-to-one meetings for univariate tests but not for multivariate analysis. Gelb (2000: 170) argued that managerial ownership mitigates agency costs and therefore reduces the need for costly accounting disclosures. He found
that lower levels of managerial ownership were as-sociated with more highly rated disclosure in annu-al and quarterly reports. However he did find that investor relations disclosures were not influenced by the level of managerial ownership.
H2 The level of free-float is positively associat-ed with the level of investor relations activity. H3 The level of insider holdings is negatively associated with the level of investor relations activity.
3.2. Institutional ownership
Bushee et al. (2003) have argued and shown that the percentage of institutional ownership is nega-tively associated with real time open access to con-ference calls as opposed to closed concon-ference calls. Accordingly I expect that a high level of in-stitutional ownership will be associated with a greater number of one-to-one meetings. Buy-side analysts and fund managers request one-to-one meetings as valuable discussions can take place in these relatively private events. Companies offer one-to-one meetings in order to attract and retain institutional investors. Both the percentage held by the institutions and the number of institutions in-volved are likely to drive the number of one-to-one meetings. A company with a high percentage held by a small number of institutions is likely to expe-rience a different demand for meetings than a com-pany with a high percentage held by a large number of institutions. Therefore I use two proxies in the model (Bushee and Miller, 2005: 19).
H4 The level of institutional ownership is posi-tively associated with the level of investor rela-tions activity.
H5 The number of institutional owners is posi-tively associated with the level of investor rela-tions activity.
3.3. Analyst following
The number of sell-side analysts following a firm is likely to be associated with an increased number of one-to-one meetings. Tasker (1998) has shown that higher analyst following is associated with holding conference calls and Rao and Sivakumar (1999) have shown that firms with higher analyst following were more likely to establish an investor relations department. Bushee et al. (2003) argued and found that analyst following would be nega-tively related to holding open access rather than closed conference calls. Sell-side analysts are like-ly to request one-to-one meetings in order to enable them to (hopefully) produce superior research re-ports and make better recommendations.
H6 The level of analyst following is positively associated with the level of investor relations activity.
3.4. Complex information disclosure environment
Bushee et al. (2003) hypothesised that firms with complex information disclosures would be more likely to hold closed conference calls as op-posed to open access calls. Tasker (1998) hypoth-esised that firms with less informative financial statements (proxied by industry market to book values) would tend to hold conference calls. Frankel et al. (1999) hypothesised that firms which were difficult to analyse (for example those with intangible assets or in a high tech industry) would be likely to hold conference calls. Following this line of reasoning I hypothesise that firms with complex disclosures will hold more one-to-one meetings to make those disclosures or explain them in more detail. A complex information dis-closure environment is a latent variable that can be proxied in various ways.
Market to book value (MTBV) is a variable that could possibly indicate the need for complex dis-closures via a company’s investor relations. If a company has a high market value compared to the assets shown in the accounts this could indicate the presence of intangible assets which do not appear on the balance sheet, such as intellectual capital. MTBV has frequently been used to proxy for a company’s growth options in the literature. As countries move from a manufacturing based econo-my to a services based econoecono-my it is often argued that traditional balance sheets need to be supple-mented by information about intangible income generating assets (Beattie and Thomson, 2004). In order to achieve this, companies with a high MTBV may put more effort into investor relations. They may offer more one-to-one meetings and attract a larger audience for these meetings. On the other hand, a low MTBV could be due to a ‘low’ share price following bad news or negative market senti-ment or a negative book value and this might cause companies to offer more meetings to explain the sit-uation. Analysts who are looking for recovery stocks might be interested in attending meetings with low MTBV companies and fund managers with an investment in such companies could also be keen to find out what it going on (Marston 2004: 62). Thus the relationship may not be monotonic.
In view of the debates surrounding accounting for intangible assets I also expect that companies with recorded intangible assets on their balance sheets may need to hold more one-to-one meetings to tell their value-creation story. Additionally some industries are inherently more complex than others and in particular high tech industries (such as biotech firms) may feel the need to hold more one-to-one meetings.
Accordingly I select three measures to proxy a complex information disclosure environment.2
H7 The market to book value ratio is associated with the level of investor relations activity OR H7a A high market to book value is positively associated with the level of investor relations activity
H7b A low market to book value is positively as-sociated with the level of investor relations ac-tivity
H8 The existence of intangible assets in the bal-ance sheet is positively associated with the level of investor relations activity
H9 Membership of a high tech industry is posi-tively associated with the level of investor rela-tions activity
3.5. Raising of capital
Lang and Lundholm (1993), Tasker (1998) and Gelb (2000) found the raising of capital to be sig-nificant in their models. Frankel et al. (1999) found a positive association with issuance of debt and not equity. I hypothesise that companies issu-ing new capital will be likely to hold more one-to-one meetings as they will need to maintain the interest and confidence of analysts and institutions to ensure that their issues are successful. Analysts and fund managers may be more likely to request meetings to discuss such activities.
H10 The raising of new capital is positively associated with the level of investor relations activity
3.6. Control variable: company size
Company size has been shown by many studies to be associated with increased disclosure (Ahmed and Courtis, 1999). The papers summarised in Table 1 indicate that it is also an important deter-minant of investor relations actions and disclosure levels (although Bushee et al. (2003) was an ex-ception). Large companies have more capital to market, they have more resources available and they are under great pressure to increase trans-parency. It seems likely that they will devote more effort to investor relations than smaller companies. Thus they might hold more one-to-one meetings. From the point of view of the analysts and fund managers, larger companies will naturally attract their attention unless they are required to spe-cialise in smaller companies by their employers. Size may also indicate the presence of a complex disclosure environment as larger companies tend to be more complex in structure, segmentation and the type of activities they undertake.
H11 A company’s size is positively associated with the level of investor relations activity.
Vol. 38 No. 1. 2008 31
2Bushee et al. (2003) used five proxies for complex infor-mation disclosures and Tasker (1998) used four industry meas-ures of financial statement informativeness.
3.7. The regression model for RQ5
The model developed in the hypotheses section above can be expressed as follows: (Investor relations activity level) = a0 + a1(Ownership dispersion/structure: listing status FLIST) + a2(Ownership dispersion/structure: free float F-F%) + a3(Ownership dispersion/structure: insid-er holdings BFA% ) + a4(Institutional ownership: percentage INST% ) + a5(Institutional ownership: number of institutional owners INSTNO) + a6(Analyst following ANALYST) + a7(Complex disclosure environment: market to book value MTBV) + a8(Complex disclosure environment: intangible assets on balance sheet IA/TOTA) + a8(Complex disclosure environment: high tech in-dustry HIGHTECH) + a9(Recent raising of new
capital NEWCAP)+ a10(Company size MKTCAP) + ε
The latent dependent variable ‘investor relations activity’ is proxied by the number of one-to-one meetings (1-1s) and by six measures of the size of the audience for all types of investor relations meetings from the sell-side (SSA-ATT, SSA-LIST, SB-FIRMS) and the buy-side (ATT, BSA-LIST, II-FIRMS). Thus seven regressions using different proxies are carried out. Definitions of the dependent and independent variables are shown in Table 10.
4. Research method
To answer the research questions, information was needed from company managers. A postal ques-tionnaire was sent to the top 500 UK companies in two stages. The first stage was a survey of the top 500 European companies (Marston, 2004) and this population included 143 UK companies of which 61 responded. The second stage was a survey of the top 500 UK companies but as the top 143 com-panies had already been surveyed in stage one the earlier results were retained.
The first stage mailing was sent to the top 500 European companies measured by market capital-isation on 4 January 2001 and, as noted above, 143 of these were British companies. The list was ob-tained from the Financial Times FT500 (Financial Times, 2001). Questionnaires were posted out in
batches over a three-week period commencing on 17 January 2002. The questionnaire was addressed to the Finance Director by name where this infor-mation was available. In other cases it was ad-dressed to the Finance Director. Follow-up letters
and questionnaires were sent out to non-respon-dents in March 2002. The follow-up letters were addressed to the investor relations officer. The sec-ond stage mailing was sent to the rest of the top 500 British companies (Financial Times, 2001)
and these questionnaires were sent out in November 2002, with follow-up letters and ques-tionnaires in January/February 2003. Price move-ments in the UK stock market in the year prior to the survey and during the survey period exhibited a general downward trend3 that may have had
some effect on company respondents.
4.1. The questionnaire
The questionnaire contained eight sections cov-ering various aspects of the investor relations process. The questionnaire design was based on Marston (1993) but was improved in order to re-move ambiguities that had been noted during cod-ing responses to the earlier project. A review of recent academic and professional publications was carried out to update the questionnaire. Further im-provements were made at the pilot stage with the assistance of investor relations practitioners. The new questionnaire contained many similar ques-tions enabling some comparisons and assessment of changes to be made over time. Additional ques-tions related to changes in the environment (such as the Internet) in order that an updated description could be obtained and that the impact of change drivers on the investor relations activity could be measured.
4.2. Response rate
Out of the 500 UK companies in the FT Top 500 for 2001, 39 had de-listed, merged, or been taken over by the time the questionnaires were posted, giving an effective total of 461 companies eligible to respond, of which 143 replied, giving a response rate of 31%. 55% of respondents were specialist investor relations personnel although 42% of re-sponses were from finance directors. As shown in Table 3, the responses from finance directors tend-ed to be from the smaller companies.
Respondents were larger than non-respondents.4
There was no statistically significant difference between the response rates from different industri-al sectors.
5. Results
I now set out and discuss the results of the research questions obtained from the questionnaire re-sponses. The discussion contains interpretations drawn from the literature review especially those relating to theory.
As discussed above, I expect some changes in investor relations to have occurred over time as a result of company-side change drivers and market-side change drivers (Figure 1). In order to investi-3The FTSE100 index fell from 6,222 to 4,129 and the FTSE
All Share index from 2,983 to 2,006 between January 2001 and July 2003.
4A t-test showed no significant difference (t, df 459 = 1.32, significance 0.5) but in view of the distributional properties of the size variable a non-parametric test was also carried out. A Mann-Whitney test (two-tailed) comparing respondents with non-respondents was significant (Z –4.244, significance .000).
Vol. 38 No. 1. 2008 33
Table 3
Details of respondents and response rates
Market Capitalisation
Mean Median SD N
£m £m
Job title of respondents
Finance Director 1,0401 345 1,566 59
Investor Relations Director 9,355 3,898 18,627 59
Investor Relations Officer 4,050 815 7,512 19
Other 1,425 1,620 1,066 6
Completed questionnaire 4,887 1,046 12,843 143
Refused or no answer 3,160 484 13,044 318
Population 3,696 556 12,933 461
1A Kruskal-Wallis test confirmed that responses from finance directors were from significantly smaller
com-panies (significance level .000).
gate this, the results of the survey in 2002 are com-pared with results of an earlier survey carried out in 1991 (Marston, 1993). The population in 1991 consisted of the top 547 UK companies by market capitalisation at the time.5
The 1991 survey was the first academic postal questionnaire survey of investor relations carried out in the UK and this possibly explains the high response rate of 62%. The lower response rate for the recent survey in 2002 is likely due to survey fa-tigue being experienced by company finance di-rectors and investor relations officers.6
5.1 Research question 1
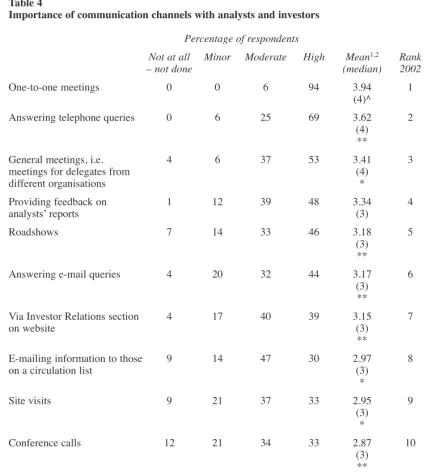
Respondents were asked to rank the importance of a variety of communication channels that are typically used by investor relations departments. The results in Table 4 show that one-to-one meet-ings were ranked most highly with answering tele-phone queries second and general or group meetings third. This agrees with the rankings ob-tained by Marston in 1991 (Marston, 1996: 23). Additionally the median scores7were the same in
2002 and 1991 for the five items for which com-parative data was available. The importance of pri-vate communication has also been emphasised by Holland (1997 and 1998) and Beattie (1999). Thus
it is not surprising that the rankings remain the same given that one-to-one meetings and answer-ing telephone queries are more private than gener-al meetings. Market-side change drivers such as increased regulation and scrutiny of company dis-closures have not affected the perceptions reported in Table 4. Seven new activities were added to the survey in 2002 and these reflected the increasing use of information technology (e-mail and Internet) and included other methods that had been noted as being of importance when performing the literature review (e.g. site visits, roadshows). However the use of e-mail and the website had not supplanted the traditional communication chan-nels. Although the use of conference calls has been studied in a US context by Tasker (1998) and Bushee et al. (2003) their perceived importance is relatively low in the UK.
Companies were asked whether they kept records of their investor relations meetings. Records were kept by the majority of the respon-dents for both general (79%) and one-to-one meet-ings (77%). In the survey in 1991 the level of record keeping for general (57%) and one-to-one meetings (49%) was lower.
The theoretical framework provides an explana-tion for this increase in recording. Firstly it is caused by increased regulation since 1991 (a mar-ket-side change driver) leading to a high level of awareness of the need to control and monitor pri-vate disclosures (see Marston, 1996: 5–19). Also globalisation pressures have contributed to greater investor relations professionalism. Recording meetings helps company staff to be well prepared for return visits from investors (Marston 2004: 58). This fits in with Healy and Palepu’s (2001) management talent signalling hypothesis. Beattie (1999) has suggested that minutes of one-to-one 5There were 337 respondents in total giving a response rate
of 62%. Of these, 325 respondents identified themselves and a Z test comparing the respondents (by size) with the population was not significant. However size was not distributed normal-ly and repeating the test using the log of the size showed a sig-nificant result (significance p=0.032) indicating that respondents were larger on average than the population.
6In comparing the results of the two surveys it is worth not-ing that 307 of the companies from the 1991 population were in the 2002 population and that 46 companies responded to both surveys.
7Not shown in Table 4.
Table 4
Importance of communication channels with analysts and investors
Percentage of respondents
Not at all Minor Moderate High Mean1,2 Rank Rank
– not done (median) 2002 19913
One-to-one meetings 0 0 6 94 3.94 1 1
(4)^
Answering telephone queries 0 6 25 69 3.62 2 2
(4) **
General meetings, i.e. 4 6 37 53 3.41 3 3
meetings for delegates from (4)
different organisations *
Providing feedback on 1 12 39 48 3.34 4 4
analysts’ reports (3)
Roadshows 7 14 33 46 3.18 5 N/A
(3) **
Answering e-mail queries 4 20 32 44 3.17 6 N/A
(3) **
Via Investor Relations section 4 17 40 39 3.15 7 N/A
on website (3)
**
E-mailing information to those 9 14 47 30 2.97 8 N/A
on a circulation list (3)
*
Site visits 9 21 37 33 2.95 9 N/A
(3) *
Conference calls 12 21 34 33 2.87 10 N/A
(3) **
Mailing information 7 35 40 18 2.70 11 5
(3)^
Web casts 33 21 26 20 2.32 12 N/A
(2) **
1Where: 4 = High importance; 3 = Moderate importance; 2 = Minor importance; 1 = Not at all – not done; N/A
not applicable to 1991 survey.
2The relationship between ranking scale answers and company size is positive in all cases and significant
at the following levels in a Kruskal-Wallis test: ** significant at the .01 level, * significant at the .05 level, ^ significant at the .1 level
31991 figures are based on a maximum of 325 respondents to individual questions (subject to missing values).
meetings should be placed in an electronic library. This might ‘level the playing field’ for all investors although Bodoff and Zhang (2003: 456) point out that there is a vast literature in accounting, finance and economics that shows the benefits of more, or more widespread, disclosure are far from straight-forward.
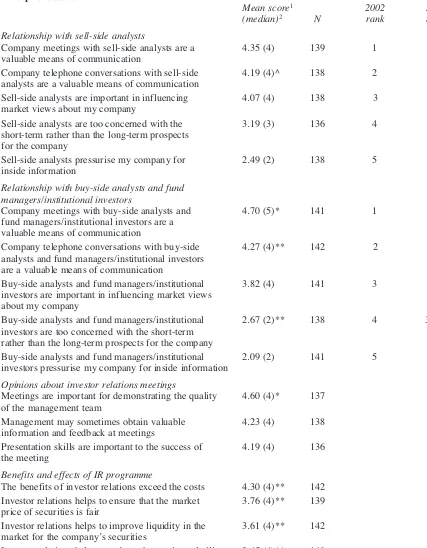
5.2. Research question 2
The questionnaire asked for opinions about relationships with analysts and fund managers (Table 5). Given the amount of organisational ef-fort and management time devoted to investor re-lations it was considered important to establish company respondents’ personal attitudes towards investor relations.
Company respondents generally considered in-vestor relations meetings and telephone calls to be a valuable means of communication. This finding of a positive attitude towards investor relations meetings agrees with Roberts et al. (2006: 282) who found that meetings were ‘grasped as an op-portunity’ to influence investor decision making.
The company respondents did not appear to con-sider themselves pressurised to reveal inside infor-mation. There has been an increasing pressure on UK companies to be very careful about selectively revealing price-sensitive inside information (Marston 1999: 4). However the responses indicat-ed that they can manage these pressures comfort-ably.
There has been an ongoing debate in the UK re-garding the alleged short-termist attitude of the City of London (Marsh, 1990). For this reason per-ceptions about short-termism were sought from company respondents. On average the respondents did feel that sell-side analysts were somewhat more short-termist than the buy-side.
The mean score for the responses to these ques-tions were ranked in the same order as the re-sponses to similar questions in the 1991 survey. Additionally the median scores were the same for seven out of eight of the items8for which
compar-ative data was available. This is interesting in that the results show consistent respondent perceptions over a time-period in which several change drivers have been operating. For example, as noted previ-ously, company disclosure has been subjected to closer scrutiny and regulation but this has not af-fected the popularity of one-to-one meetings.
Respondents were asked for opinions about investor relations meetings. Most respondents strongly agreed that meetings are important for demonstrating the quality of the management team (Table 5). It was also generally agreed that presen-tation skills are important and that management can receive valuable feedback at meetings. These
findings agree with the results of an interview based study in the UK by Marston (1999). Additionally Beattie (1999: xi) found that quality of management was the most highly ranked driver of company performance in a survey of informa-tion users. This finding can be related to Healy and Palepu’s (2001) management talent signalling hy-pothesis and shows that management wished to demonstrate their quality to the market. One note of caution comes from Roberts et al. (2006: 286), who note that ‘face-to-face meetings ensure that the qualities of the message and the messengers become inextricably and consequentially en-twined’ and ‘there is no metric that reliably relates the body language of an executive to future finan-cial performance’. Given the vast amount of pub-lished information available from companies it appears that assessment of management quality is a key reason for attending meetings. It would be difficult to report formally on management quality because intangibles like body language, personali-ty and the interaction between members of the management team cannot easily be put into words. To establish the perceived effect of investor rela-tions on the market for the company’s securities, respondents were asked whether they agreed with five general statements about the benefits/effects of the investor relations programme. In general there was agreement that it helps to ensure securi-ties are fairly priced and improves market liquidi-ty. This is in agreement with the findings of Bushee and Miller (2005). While Bushee et al. (2003) found that higher price volatility occurred during the period of conference calls, the respondents generally agreed that investor relations helped to reduce share price volatility. Respondents were generally uncertain as to whether investor relations reduced the cost of capital.
5.3 Research question 3
In order to establish what was actually discussed at meetings, respondents were presented with a long list of possible topics. This was based on a previous study (Marston, 1993) with an additional section (designated ‘management issues’) de-signed to take account of recent trends in company reporting and the business environment.
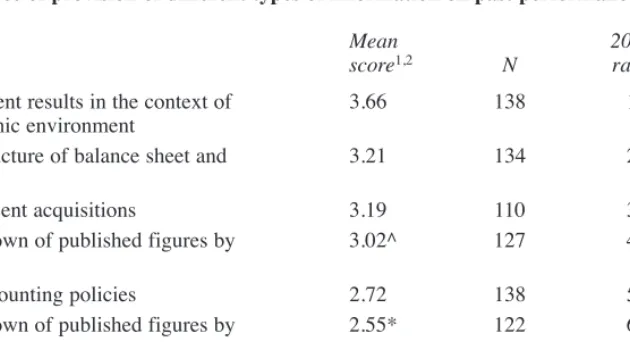
The following three tables summarise respon-dents’ views on the importance of the provision of information on past performance (Table 6), future prospects (Table 7), and management issues (Table 8) at investor relations meetings. Topics are listed in rank order of perceived importance. Tables 6 and 7 provide comparative data in order to assess any effect of change drivers.
An explanation of recent results was considered most important of the listed items on past per-formance. The relative importance of the listed items was found to be exactly the same as in the
Vol. 38 No. 1. 2008 35
8Not shown in Table 5.
Table 5
Perceptions about IR
Mean score1 2002 1991
(median)2 N rank rank
Relationship with sell-side analysts
Company meetings with sell-side analysts are a 4.35 (4) 139 1 1
valuable means of communication
Company telephone conversations with sell-side 4.19 (4)^ 138 2 2
analysts are a valuable means of communication
Sell-side analysts are important in influencing 4.07 (4) 138 3 N/A
market views about my company
Sell-side analysts are too concerned with the 3.19 (3) 136 4 3/44
short-term rather than the long-term prospects for the company
Sell-side analysts pressurise my company for 2.49 (2) 138 5 5
inside information
Relationship with buy-side analysts and fund managers/institutional investors
Company meetings with buy-side analysts and 4.70 (5)* 141 1 1
fund managers/institutional investors are a valuable means of communication
Company telephone conversations with buy-side 4.27 (4)** 142 2 2
analysts and fund managers/institutional investors are a valuable means of communication
Buy-side analysts and fund managers/institutional 3.82 (4) 141 3 N/A
investors are important in influencing market views about my company
Buy-side analysts and fund managers/institutional 2.67 (2)** 138 4 3/422
investors are too concerned with the short-term rather than the long-term prospects for the company
Buy-side analysts and fund managers/institutional 2.09 (2) 141 5 5
investors pressurise my company for inside information
Opinions about investor relations meetings
Meetings are important for demonstrating the quality 4.60 (4)* 137 of the management team
Management may sometimes obtain valuable 4.23 (4) 138
information and feedback at meetings
Presentation skills are important to the success of 4.19 (4) 136
the meeting
Benefits and effects of IR programme
The benefits of investor relations exceed the costs 4.30 (4)** 142 Investor relations helps to ensure that the market 3.76 (4)** 139 price of securities is fair
Investor relations helps to improve liquidity in the 3.61 (4)** 142 market for the company’s securities
Investor relations helps to reduce share price volatility 3.45 (4)** 140
Investor relations reduces the cost of capital 3.33 (3) 141
1Where: Strongly agree = 5; Agree = 4; Neutral = 3; Disagree = 2; Strongly disagree = 1.
2The relationship between ranking scale answers and company size is significant at the following levels in
a two-tailed Kruskal-Wallis test: ** significant at the .01 level, * significant at the .05 level, ^ significant at the .1 level.
31991 figures are based on a maximum of 325 respondents to individual questions (subject to missing values). 4The questions about the short-term were subdivided into 2 questions in the 1991 survey.
1991 survey. The theoretical framework provides no prediction for ranking the topics nor any spe-cific prediction that the mean rankings might change over time. Although the existence of change drivers had the potential to influence the results, this did not occur. The empirical studies identified in the literature review (see Table 1) in-dicated that good performance (measured in vari-ous ways) is linked with investor relations disclosure and the findings here confirmed the per-ceived importance of discussing past performance. Respondents also had space to make additional entries about past performance, with their per-ceived importance. These varied widely and corre-sponded with items in the theoretical models predicting investor relations disclosures. They in-cluded: cash generated per segment, an exception-al event and cash conversion actions (complex information disclosures, Bushee et al., 2003), com-petitive positioning (Tasker, 1998 and Gelb, 2000), capital efficiency, capital expenditure and 10-year performance against an index (Tasker, 1998).
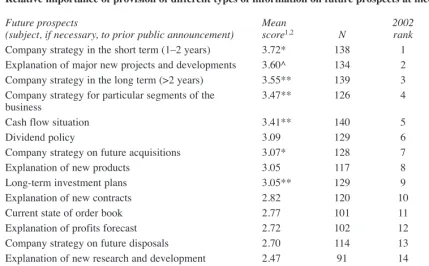
Short-term strategy, major new products and de-velopments and long-term strategy were the most important topics relating to future prospects. These types of disclosures could be considered to be complex information disclosures following the model of Bushee et al. (2003) and therefore per-haps more suitable for discussion in a private meeting. The rankings were quite similar to those obtained in 1991 although an explanation of major new projects and developments has risen in the rankings. This indicates increased market-side pressures for more specific forward-looking
infor-mation. The items listed in Table 7 are not mutual-ly exclusive and some are more specific than oth-ers. New information about many of the items listed in Table 7 could be price-sensitive and there-fore should not be issued initially at a private brief-ing. However companies are able to discuss and explain the items using public domain information as the basis. An ‘explanation of profits forecast’ is ranked as minor to moderate importance. There are regulatory problems with issuing profits fore-casts in the UK. However companies can discuss the consensus forecasts produced by analysts or discuss ‘ball park figures’ without committing to an exact figure.
Respondents’ own entries about future prospects, with their perceived importance varied widely. They included current-year earnings guidance, volume/price outlook, government spending, growth agenda and organisational culture change. The last two items listed could be considered to be complex information disclosures in line with the Bushee et al. (2003) model.
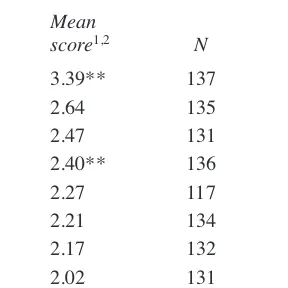
The items listed as ‘management issues’ (Table 8) were intended to encapsulate some of the key concerns that have been emerging in recent years. Discussions about ‘creation of shareholder value’ were viewed as most important here. This mirrors the findings of Roberts et al. (2006) who have re-marked on the importance of shareholder value in their study of meetings with fund managers.
Although corporate governance has been a topi-cal issue since the 1990s in the UK it appeared to be of only moderate importance for discussion in investor relations meetings. Individual
compo-Vol. 38 No. 1. 2008 37
Table 6
Relative importance of provision of different types of information on past performance at meetings
Mean 2002 1991
Past performance score1,2 N rank rank
Explanation of recent results in the context of 3.66 138 1 1
the general economic environment
Explanation of structure of balance sheet and 3.21 134 2 2
gearing
Performance of recent acquisitions 3.19 110 3 3
Additional breakdown of published figures by 3.02^ 127 4 4
line of business
Explanation of accounting policies 2.72 138 5 4
Additional breakdown of published figures by 2.55* 122 6 6
geographical area
Outcome of completed research and development 2.41 94 7 7
projects
1Where: Not at all = 1, Minor importance = 2, Moderate importance = 3, High importance = 4 (Respondents
who considered the listed items ‘not applicable’ have been omitted.)
2The relationship between ranking scale answers and company size is positive and significant at the
follow-ing levels in a Kruskal-Wallis test: * significant at the .05 level, ^ significant at the .1 level.
nents of corporate governance that were listed (di-rectors’ remuneration, external audit and internal audit) were rated as less important than ‘corporate governance generally’. This is because some in-vesting institutions carry out their checks on cor-porate governance using different personnel (i.e. not the buy-side analysts and fund managers but compliance checking officers of some sort). It is also because UK companies are required to ‘com-ply or explain’ adherence to corporate governance codes. As a result of this regime, once the baseline of corporate governance has been established, there may be little need to discuss governance fur-ther at meetings.
Risk management was ranked third after ‘corpo-rate governance generally’. The issue of risk man-agement and risk reporting had been the subject of some scrutiny by the Institute of Chartered Accountants in England and Wales (ICAEW, 1999) prior to the survey. From the point of view of the respondents it did not appear to be a very important item for discussion at investor relations meetings.
Even less importance was attached to the
provi-sion of information on social and environmental issues. Companies may provide social and envi-ronmental information and even prepare a separate report but find that there is very little discussion of these matters in meetings with analysts and in-vestors. The subordination of these topics to that of shareholder value creation is not entirely surpris-ing despite the vast amount of effort, discussion and research devoted to social and environmental reporting over the years.
Perhaps, surprisingly, provision of information on intellectual capital was rated as even less im-portant. Bushee et al. (2003) indicated that a com-plex disclosure environment, including the existence of intangibles, provides an incentive for private disclosures. However it is possible that re-spondents would have responded differently if the question had referred to intangible assets in more general terms.
5.4. Research question 4
In respect of the ranking scale answers, statisti-cal tests were carried out comparing respondents’ Table 7
Relative importance of provision of different types of information on future prospects at meetings
Future prospects Mean 2002 1991
(subject, if necessary, to prior public announcement) score1,2 N rank rank
Company strategy in the short term (1–2 years) 3.72* 138 1 2
Explanation of major new projects and developments 3.60^ 134 2 6/9
Company strategy in the long term (>2 years) 3.55** 139 3 1
Company strategy for particular segments of the 3.47** 126 4 2
business
Cash flow situation 3.41** 140 5 4
Dividend policy 3.09 129 6 5
Company strategy on future acquisitions 3.07* 128 7 6
Explanation of new products 3.05 117 8 14/15
Long-term investment plans 3.05** 129 9 8
Explanation of new contracts 2.82 120 10 15/15
Current state of order book 2.77 101 11 13
Explanation of profits forecast 2.72 102 12 10/12
Company strategy on future disposals 2.70 114 13 10
Explanation of new research and development 2.47 91 14 19/20
projects
Prospects of current research and development 2.43 90 15 18
projects
1Where: Not at all = 1, Minor importance = 2, Moderate importance = 3, High importance = 4.
In the 1991 survey there were 20 listed items and five of the items in the 2002 survey were subdivided into two items in 1991. For example ‘Explanation of new products’ was divided into ‘First announcement of new products’ and ‘Further explanation of new products that have already been announced’.
2The relationship between ranking scale answers and company size is positive and significant at the following
levels in a Kruskal-Wallis test: ** significant at the .01 level, * significant at the .05 level, ^ significant at the .1 level.