The Causality between Corporate Governance Practice and
Bank Performance:
Empirical Evidence from Indonesia
Cynthia A. Utama
Research Fellow, Faculty of Economics and Business, University of Indonesia
Haidir Musa
Head of Macroeconomic Analyst Unit, Indonesia Stock Exchange Gadjah Mada International Journal of Business
Vol. 13, No. 3 (September - December 2011): 227 - 247
Abstract: The aim of this study is to examine the existence of causality between corporate governance
practice and performance of commercial banks in Indonesia. We also investigate the influence of age, capital adequacy, and type of commercial banks on bank performance and examine the influence of the bank size, foreign ownership, and listing status on corporate governance practice. The result shows that corporate governance practice, bank size and capital adequacy ratio have positive influences on bank performance in Indonesia. However, bank performance does not influence corporate governance prac-tice. This study also finds that regional banks have better performance than private banks. The results of the study support the Central Bank’s efforts to enhance CG practices in the banking sector, to strenghten banks’ capital base and its policy to encourage banks to merge to become larger.
Abstrak: Tujuan dari penelitian ini adalah menguji hubungan timbal-balik antara praktik tata kelola dan
kinerja bank umum di Indonesia. Pengujian dilakukan dengan melihat pengaruh dari umur, indikator kecukupan modal, tipe bank terhadap kinerja bank dan selanjutnya dilihat pula pengaruh dari ukuran bank, kepemilikan asing, dan status terdaftar di bursa terhadap praktik tata kelola bank tersebut. Hasil penelitian menunjukkan bahwa praktik tata kelola, ukuran bank, dan rasio kecukupan modal memiliki pengaruh positif terhadap kinerja bank di Indonesia. Tetapi, kinerja bank tidak memiliki pengaruh terhadap praktik tata kelolanya. Studi juga menemukan bahwa bank pemerintah daerah memiliki kinerja lebih baik dibandingkan bank swasta nasional. Hasil penelitian ini mendukung usaha Bank Indonesia dalam meningkatkan praktik tata kelola di dalam sektor perbankan, untuk memperkuat modal dasar bank dan kebijakan Bank Indonesia dalam mendorong bank untuk melakukan merger dan menjadi semakin besar..
Keywords: bank performance; corporate governance; ownership structure
Introduction
Good corporate governance (hence-forth, GCG) practice within a company plays an important role in directing and managing the company. GCG is needed because of the existence of agency problems caused by the separation of ownership of resources and managing those resources (Jensen and Meckling 1976). Agency problems or conflicts of interest between principals and agents are defined as various conducts of agents (e.g., managers) that are not in accordance with the interests of principals (e.g., shareholders). GCG is one mechanism to minimize the con-flict of interest between agents and princi-pals.
Weak corporate governance (CG) prac-tice is believed to be one of major contribu-tors to the Asian financial crisis that finally led to the banking crisis (Asian Development Bank 2000). Therefore, it is intriguing to in-vestigate the influence of corporate gover-nance practice on bank performance. Unfor-tunately, the extant researches mostly inves-tigate the influence of CG practices on firm performance (Gompers et al. 2003; Brown and Caylor 2006) but empirical studies that examine the influence of corporate gover-nance practice on bank performance as a regu-lated industry are rare. One example of these studies is Andres and Vallelado (2008) who investigate the influence of board size as a proxy for corporate governance on bank per-formance. The result shows that board size has a positive effect on bank performance. This result is also supported by Adams and Mehran (2003) who find that the banking sector has a larger board size compared to the manufacturing sector and finally led to increased bank performance.
Previous studies also investigate the possibility of endogeneity between corporate
governance and firm performance or firm value (Black et al. 2006; Silveira et al. 2007; Bhagat and Bolton 2008; Sung Suk 2008). These studies show that GCG has a positive influence on firm performance and firm per-formance also induces the firm to adopt a better corporate governance (Black et al. 2006; Silveira et al. 2007; Bhagat and Bolton 2008). Meanwhile, Sung Suk (2008) fails to find the causality between corporate gover-nance and firm performance. He finds that firm value has a positive influence on CG practices but not the other way around. How-ever, these previous studies focus on the cau-sality between CG practices and firm perfor-mance, not bank performance. Hence, it war-rants further investigation to examine the causality between corporate governance and bank performance.
improvement and implementation of GCG. Furthermore, some previous studies show that bank performances are also af-fected by age of a bank, capital adequacy ra-tio, and type of commercial bank. The age of a bank positively affects the bank perfor-mance due to age having a positive correla-tion with experience (i.e. learning curve) which finally leads to higher performance (DeYoung and Hasan 1998; DeYoung et al. 1999). A capital adequacy ratio set by the regulator is required to meet minimum capi-tal requirements so the bank’s management will manage their assets properly and this will increase the bank performance (Unite and Sullivan 2003; Naceur and Kandil 2009). The type of commercial bank also influences bank performance. For example, in Indonesia, re-gional banks (Bank Pembangunan Daerah) are supported by local government funding. Hence, high support of government funding results in increased funds availability for lend-ing at relatively low rates compared to those of private banks. Therefore, high capacity to provide credit and the support by government cause the bank to have a close relationship with a particular community and improve their performance. This condition is similarly applicable to foreign banks and joint venture banks (Havrylchyk 2006).
CG practices are also determined by bank size, foreign ownership, and listing sta-tus at the stock exchange. Bank size has a positive impact on CG practices (Demsetz 1983; Levine 2004; Black et al. 2006). Large banks have less asymmetric information so they tend to implement GCG. Meanwhile, the existence of foreign parties in the bank own-ership structure will have a positive impact on bank governance. The reason is that the foreign party will provide a source of capital and transfer knowledge to improve the bank
governance (Bonin 2005; Williams and Nguyen 2005). Banks that are listed in capi-tal markets tend to have better CG practices because they are closely monitored by inves-tors who demand that the banks increase their transparency and disclosure through good corporate governance practice (Akhigbe and Martin 2008).
man-agement committee and remuneration and nomination committee as well. Therefore, the uniqueness of bank characteristics may af-fect their performance differently than other public listed companies.
The remainder of the paper is organized as follows. Section 2 reviews the literature and hypotheses development. Section 3 scribes data and methodology. Section 4 de-scribes the empirical results and section 5 concludes the paper.
Literature Review and
Hypotheses Development
The empirical researches find that CG practiced have a positive impact on bank performance (Gompers et al. 2003, Brown and Caylor 2006; Andres and Vallelado 2008, Bhagat and Bolton 2008). Choe and Lee (2003) show that banking sector board gov-ernance-related reforms are strongly and posi-tively related to market-based measures of corporate performance (i.e., cumulative ab-normal return). This finding supports Roseinstein and Wyatt (1990) who find that better CG practices (i.e., strengthening of executive stock compensation and other com-pensation, effective audit committee) has a positive relationship with stock market reac-tion (i.e., cumulative abnormal return).
In Indonesia, Bank Indonesia regulation No. 8/14/PBI/2006 on CG in the banking sector aims to improve banks’ performance, to protect the interests of stakeholders, to improve the compliance with regulations and business ethics applicable in the banking in-dustry. Likewise in the manufacturing sector, the corporate governance in the banking sec-tor is a mechanism to manage a variety of stakeholders’ interests so the conflict of in-terest among them can be mitigated. Based
on the above argument, we posit the hypoth-esis as follows.
H1.1: Corporate governance practice has a positive influence on bank performance.
DeYoung and Hasan (1998) find that bank performances are positively affected by bank age. DeYoung et al. (1999) assert that the bank begins its operations as a financial intermediary firm entering the market and competition on a certain scale. A newly es-tablished bank has certain characteristics and its own-way of managing the operation com-pared to an older bank. As it is reaching its maturity stage, a bank has more experience in managing and deciding appropriate poli-cies to cope with the rapid changes in the in-dustry. Therefore, based on this argument, the hypothesis can be posed as follows: H1.2: Bank performance is positively affected by its
age.
The compliance with a capital adequacy ratio (henceforth, CAR) requirement in com-mercial banks aims to improve the operational functions, security functions and bank regu-lation (Siamat 2004). An adequate CAR ac-companied by effective and efficient bank management and lending activities are ex-pected to improve the performance of a bank. Naceur and Kandil (2009) find that the role of regulators in setting the minimum level of CAR will increase the bank performance. This empirical finding is also corroborated by Supriyatna et al. (2007) who argue that CAR may reduce the deterioration of bank perfor-mance and can be used to classify the bank performance as good or bad. CAR also re-flects the compliance level of a bank with the regulation and represents their protection of public interest. Hence, we state the fol-lowing hypothesis as follows.
The existence of different types of com-mercial banks affects the level of bank per-formance. Commercial banks have a variety of financial support, reputation, and lending activities (Siamat 2004). The type of banks that have higher funding support, reputation, and lending activities should result in a bet-ter bank performance. Havrylchyk (2006) states that the existence of different types of banks affect the individual bank perfor-mances. In Indonesia, the types of banks are state-owned banks, private banks (i.e., Syari’ah banks, foreign exchange banks and non-foreign exchange banks), regional banks, and joint venture banks (mixed).
The aforementioned studies show that state-owned banks perform more efficiently than foreign banks (Chang et al. 1998; De Young and Nolle 1996; and Micco et al. 2007). This finding is also supported by Bhattacharrya et al. (1997) who state that state-owned Indian commercial banks per-form more efficiently than foreign and pri-vate banks. The argumentations are: 1) For-eign banks have a lack of understanding about the domestic market and local clients of the host country therefore this condition inhibits the foreign banks from achieving higher performance (De Young and Nolle 1996); 2) Because state-owned banks have the government as the majority shareholder, they have a higher credibility in providing bank stability and the safety of deposits and con-sequently attract a large amounts of deposits at a relatively low cost (Altunbas et al. 2001). Hence, we conclude that state-owned banks have a high financial support from the gov-ernment as well as its lower risk image by the public compared to private banks. These cir-cumstances yield a higher effectiveness in managing operational of state-owned banks compared to private banks. Thus, the state-owned banks have a higher bank performance
than that of other banks. Likewise, the argu-mentation is also applied to regional banks that obtain financial support from the local government and are perceived to have lower risk than private banks. We assert the follow-ing hypothesis.
H1.4.: State-owned banks have a higher bank per-formance than that of private banks. H1.5.: Regional banks have a higher bank
perfor-mance than private banks.
Empirical studies find that foreign own-ership increases bank return (Goldberg et al. 2000; Dahlquist and Robertsson 2001; Yudaeva et al. 2003; Choi and Hasan 2005; Havrylchyk 2006 in Kim and Rasiah 2010). They argue that foreign-owned banks are more efficient (Havrylchyk 2003) and more productive (Yudaeva et. al. 2003) than do-mestic-owned banks. But, Choi and Hasan (2005) emphasize that the positive impact of foreign ownership on a bank’s returns de-pends on their ownership level. Further, Dahlquist and Robertsson (2001) show that bank returns and risk are positively affected by the existence of foreign director on board, not determined by the number of outside board of directors. The foreign-owned banks are usually supported by their holding com-pany abroad. Hence, their management and lending activities are more effective and effi-cient than domestic-owned banks. Therefore, foreign-owned banks have a better perfor-mance than other banks.
differ-ence between foreign banks and joint ven-ture banks are their legal form. Foreign banks still have a legal form in accordance with their headquarters abroad and constitute as a sig-nificant part of the headquarters. As a con-sequence, the financial policy of foreign banks mostly depend on their headquarters, and the loans are generally provided to large firms. Whereas, joint venture banks (mixed banks) have a domestic legal form and legally con-stitute a separate entity from their headquar-ters, their legal form is one of limited corpo-ration (Hadad et al. 2011). Further, the com-pliance of joint venture banks (mixed banks) to government regulation are expected to be higher than domestic banks because joint venture banks are constituently bound to government regulation. In other words, the foreign investment in Indonesia through joint venture banks (mixed banks) is closely su-pervised and this close supervision increases their performance. So, we state the following hypothesis.
H1.6: Foreign-owned banks have a higher bank per-formance than other banks.
Previous researches investigate the endogeneity between CG and a firm’s value in manufacturing industry (Bhagat and Black 2002; Black et al. 2006). Using ordinary least square (OLS) regression, Bhagat and Black (2003) report that board independence in-creases a firm’s performance but on the other hand, a deterioration in that performance causes the firm to increase the independence of their boards of directors. But, after con-trolling this endoneity effect, this simulta-neous equation is weakened and is not sig-nificant. Further, Black et al. (2006) find the endogeneity effect between CG and a firm’s value. They show that an increase of 10 points in the corporate governance index pre-dicts a 18 percent increase in Tobin’s q and a 43 percent increase in market/book ratio, and
vice versa. They give two explanations regard-ing this causality relationship: 1) signallregard-ing, i.e. firms employ a GCG to signal their qual-ity; 2) reverse causality, i.e., higher firm value causes firms to adopt better governance rules. Bhagat and Jefferis (2002), Bolton and Bhagat (2008), Cornett et al. (2009) show the endogeneity relationship between CG and bank performance. Cornet et al. (2009) find that stronger board in the banking industry can be achieved by higher bank performance and CEO pay-based on firm performance as well, vice versa. The above argument leads us to the following hypothesis:
H2.1: Bank performance has a positive influence on CG.
Previous researches show that foreign-owned banks are positively related to CG practices (De Angelo and De Angelo 1985; Zingales 1994; and Douma, George, and Kabir 2003). They argue that banks with high foreign ownership employ better corporate governance practices because of their larger ownership, higher investment and long-term commitment.
A government regulation, No. 29 of 1999 related to share purchase of commer-cial banks, entitles foreigners to own com-mercial banks’ with a share of up to 99 per-cent. The presence of a foreign party is ex-pected to provide a source of capital and knowledge transfer and ultimately the bank’s practices and management will be improved (Bonin 2005; Williams and Nguyen 2005). Therefore, foreign ownership provides an improvement in corporate governance prac-tices in the banking sector. Based on these arguments, then the hypothesis can be for-mulated as follows:
Listed banks at the Indonesia Stock Exchange have to comply with CG regula-tions set by the Capital Market Supervisory Body (i.e., Bapepam-LK) and the central bank (i.e., Bank Indonesia). Hence, listed banks face a higher requirement in terms of GCG practices compared to non-listed banks. Akhigbe and Martin (2008) state that inves-tors in capital markets give a higher value to banks with GCG practices because they have better transparency and disclosure.
Hadad et al. (2003) documented that listed commercial banks comprised only 17 percent of all banks (24 out of 141) as of December 2002. Further, listed banks tend to have a higher performance, even though the correlation between listing status and bank performance is weak. This led us to hypoth-esize as follow.
H2.3: Listed banks have better CG practices than non-listed banks.
A previous strand of literature employs size of bank as a control variable (Demsetz 1983; Levine 2004; Kanchel 2007). They ar-gue that the extent of asymmetric informa-tion between insider and outside investors will be higher for a larger bank. A bank with larger size is characterized by higher complex-ity and information discrepancies. Therefore, GCG is required to increase bank’s transpar-ency and disclosure. Thus, we hypothesize as follow.
H2.4: Bank size has a positive impact on CG.
Methodology
Sample
We obtain a sample of all commercial banks operating in 2008 from Bank Indone-sia.1 Based on Table 1 provided below, listed
commercial banks at Bank Indonesia in 2008 amounted to 123. However, 25 of these com-mercial banks did not report their CG self-assessment rating. Therefore, the sample of commercial banks that can be used is 98. Further, we checked for outliers and yielded 90 observations after eliminating 9 outliers. An outlier is often operationally defined as a value that is at least 3 standard deviations above or below the mean.2
Financial reporting data (e.g., ROA, ROE), the age of a bank, capital adequacy ratio, the types of banks, bank size, and own-ership structure of commercial banks were gathered from Bank Indonesia and Infobank magazine. We collected the score of CG prac-tices of banks based on self-assessment on GCG implementation according to Bank In-donesia rule No. 8/14/PBI/2006 and pub-lished by Infobank magazine. The detailed aspects of CG practices being appraised are provided in Appendix. The following is Bank Indonesia rule No. 8/14/PBI/2006, Article 65 that requires banks’ self-assesment on GCG:
1) Bank must perform a self-assesment on Good Corporate Governance implemen-tation which covers items stipulated in Ar-ticle 2 Paragraph (2) at least 1 (one) time each year.
1 The period of study is year 2008 because Bank Indonesia regulation no. 8/14/PBI/2006 on GCG for
commer-cial bank was revised to Bank Indonesia regulation no. 8/14/PBI/2006 and circular letter no. 9/12/DPNP issued on May 30 2007 is effective on beginning of 2008.
2) The result of self assesment on Good Cor-porate Governance implementation as refererred to in paragraph (1) is an inte-grated part of Good Corporate Gover-nance implementation report.
3) The procedure for assesment as referred to in paragraph (1) shall be regulated in a Bank Indonesia Circular Letter.
Further, Article 75 stipulates that if a bank submits a significantly inaccurate and or incomplete report shall be imposed with administrative sanction in the form of a pay-ment obligation of Rp250,000,000 (two hudred fifty million rupiahs) and administra-tive sanctions such as lowering the bank’s health rating in the form of decreasing the level of management factor in bank’s health appraisal, freezing of certain business activi-ties, etc. The Central Bank also reviews the results of self-assessment and may require modification of the results if necessary. Be-cause the threat of sanctions and the exist-ence of inspection by the Central Bank, we believe that the self-assesment of CG prac-tices in bank report to be relatively accurate and reliable.
Definition of Variables
According to Manlagnit (2011), the bank performance can be appraised by cost efficiency and profitability. He mentions that the stochastic cost frontier analysis (Aigner
et al. 1977, and Meusen and van der Broeck 1977) and ratio of total costs to total assets of banks (Cost/TA) can deployed as proxies of cost efficient while return on assets (ROA), return on equity, and ratio of net in-terest income to average inin-terest earnings assets (NII) can be used as proxies of profit-ability. Further, he states that bank cost inef-ficiency levels usually have a positive corre-lation with the cost ratio and, by contrast, has a negative correlation with profitability measures. Further, Coleman et al. (2006) and Akhigbe and McNulty (2011) employs ROA as a control for differences in cost or profit efficiency. He corroborates that more effi-cient banks are to be more focussed on cost control. Lin and Zhang (2009) also use re-turn on assets (ROA) as measurement of bank performance (i.e. profitability). But accord-ing to Rhoades (1998) in Lin and Zhang (2009), ROA is biased upward for banks that earn significant profits from off-balance sheet operations such as derivative securities, as these activities generate revenue and expenses but not recorded as assets.
Therefore, Lin and Zhang (2009) deploy re-turn on equity (ROE) as an alternative mea-sure of profitability.
We use two proxies of bank profitabil-ity, i.e., Return on Assets (ROA) and Return on Equity (ROE). ROA reflects the deployment of bank assets to yield its income (Adams
Table 1. Summary of Sample Selection Procedure
Data N
Commercial Banks listed on Central Bank at 31 December 2008 123
Commercial Bank do not fully report the self-assessment of CG practice (25)
Commercial banks with outliers (9)
and Mehran 2003; Siamat 2004; Andres and Vallelado 2008; Chritopher 2009). ROA equals after tax net income (profits) divided by average total assets of bank (Saunders and Cornett 2005 in Christopher 2009, Lin and Zhang 2009). But, we have to be cautious with this measurement because bank perfor-mance can be increased by cutting expenses, such as advertising and R&D so the bank’s profitability will be higher in the short-term but with a sacrifice in their long-term profit-ability. Further, total assets as a denominator are very sensitive to the accounting methods used by the banks.
This study also uses ROE as a proxy of bank performance relevant to shareholder’s investment (Siamat 2004; Berger, et al. 2005; Kim and Rasiah 2010). ROE is a net income available to common stockholders divided by common equity (Brigham and Ehrhardst 2005). But, Christopher (2009) mentions that banks may employ high leverage to increase their ROE. Based on a composite index of a bank’s CG provided by Bank Indonesia, the rating has a range value between 1-5.
Accord-ing to Bank Indonesia Regulation No. 8/14/ PBI/2006 and Bank Indonesia Circular Let-ter No. 9/12/DPNP issued on May 30 2007, the categories of CG practices based on the bank’s CG are shown in Table 2.
The lower value of the composite in-dex indicates that the practice of corporate governance is better. Therefore, in order to avoid misinterpretation from the above stated hypotheses, we modify the output of the com-posite index as follows: Five – the comcom-posite index. The score of 5 (five) implies a maxi-mum value of corporate governance practice that can be obtained.
Age of bank is measured by logarithm of age of bank since its establishment. Capi-tal Adequacy Ratio (CAR) is a measurement of bank capacity in fulfilling its obligation and also a proxy of credit risk and operational risk. This is stated as a percentage of the risk from bank’s capital.3The size of bank is
calcu-lated by logarithm of total assets. We use cate-gorical variables for type of banks and assign private banks as the basis of comparison.
Empirical Models
To address the simultaneous relation-ship between CG and bank performance, we employ two-stage least square estimator (2SLS) regressions. Thus, the empirical mo-dels consist of two momo-dels: the first model is to investigate the effect of CG practice, age of bank, CAR, and types of bank on bank performance, while the second model is to in-vestigate the influence of bank performance, bank size, foreign ownership and listing sta-tus on CG practice. Each model consists of two regressions because we use two proxies of bank performance. The empirical models are provided below.
Table 2. The Categories of Bank’s CG Practices of Based on Output of Composite Index
Composite Index Category
Composite index < 1.5 very good
1.5 Composite index < 2.5 Good
2.5 Composite index< 3.5 fair
3.5 Composite index< 4.5 Poor
4.5 Composite Index< 5 very poor
Source:Bank Indonesia Circular Letter No. 9/12/DPNP
or
or
where
n, n: constants and coefficients of regressions
: error Term
ROA: Return on Assets
ROE: Return on Equity
CICG: Composite index of corporate
governance
AGE: Logarithm of age of bank
since its established
CAR: Capital adequacy ratio
SOE: Dummy variable, takes the
value of one if state-owned bank and zero otherwise. REGIONAL: Dummy variable, take the
value of one if regional bank and zero otherwise.
FOB: Dummy variable, takes the
value of one if foreign-owned bank and zero otherwise.
SIZE: Logarithm of bank’s total
as-sets
FOREIGN: Dummy variable, takes the value of one if there is an ex-istence of foreign ownership and zero otherwise.
LISTED: Dummy variable, takes the
value of one if the bank is listed at the Indonesia Stock Exchange and zero otherwise.
Results
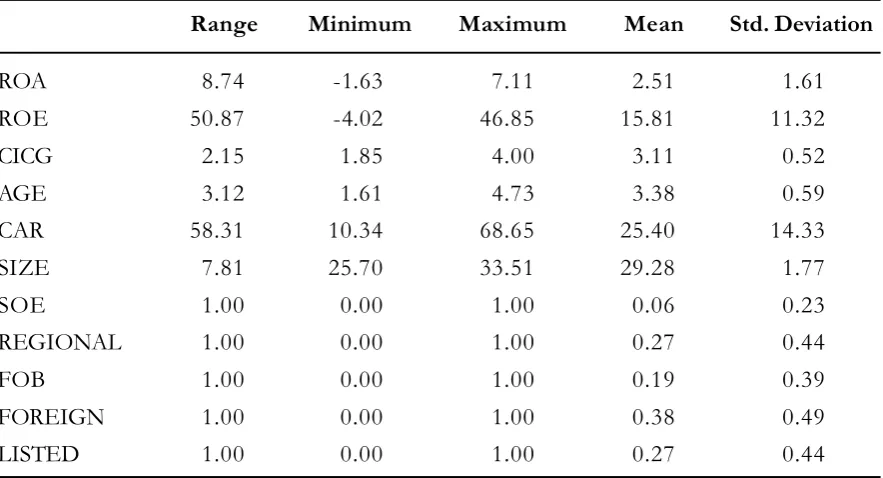
Descriptive Statistics
The descriptive statistics for data is pro-vided in Table 3, shows that the average value of ROA is 2.5109 percent with minimum value and maximum value consecutively are -1.63 percent and 7.11. While, the average value of ROE is 15.8062 percent with a mini-mum value and maximini-mum value consecutively -4.02 percent and 46.85 percent. This result shows that the average bank performance in managing its assets and return to shareholders is relatively good. The average of CICG is 1.8868 (5-3.1132 = 1.8868). CICG of 1.8868 indicates that the average CG practices in the banking sector are in a good category. The minimum value of CICG is 3.15 (5-1.85 = 3.15) or in fair category and maximum value is 1.00 (5-4 = 1) or in very good category. ROA1t= 10 +12(CICG2t) +
11(AGE1t) + 12 (CAR2t) +
13(SOE3t) +
14(REGIONAL4t) +
15(JOINT5t) + i ...(1)
ROE1t= 10 +12(CICG2t) +
11(AGE1t) + 12 (CAR2t) +
13(SOE3t) +
14(REGIONAL4t) +
15(JOINT5t) + i ...(1b)
CICG2t= 20 +21(ROA1t) + 26(SIZE6t) + 27 (FOREIGN7t) +
28(LISTED8t) + i ...(2a)
CICG2t= 20 +21(ROE1t) + 26(SIZE6t) + 27 (FOREIGN7t) +
The average of CAR in Table 3 is 25.39 percent with a minimum value and maximum value consecutively are 10.34 percent and 68.65 percent. Based on Bank Indonesia Regulation No. 9/13/PBI/2007, the mini-mum CAR is 8 percent. Therefore, the CAR held by commercial banks in Indonesia al-ready meets the requirements of the regula-tor. This condition also reflects that commer-cial banks are quite conservative in their capi-tal structure policy.
Banks in Indonesia consist of 5.6 per-cent state-owned banks (i.e. 5 banks out of 90 total banks), 26.7 percent regional banks (i.e., 24 banks out of 90 total banks), and 18.90 percent joint venture banks (i.e., 17 banks out of 90 total banks). The rest of the banks in Indonesia are private banks , that is 44 or almost 50%). In addition, the average foreign ownership in banks’ ownership struc-ture is 37.8 percent or 34 banks with foreign ownership. Finally, the percentage of com-mercial banks that are listed at the Indonesia
Stock Exchange is 26.67 percent or 24 com-mercial banks.
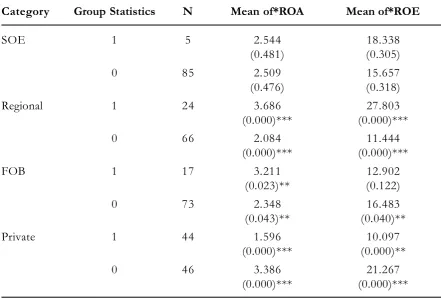
Univariate Test of Performance
Across Types of Banks
As shown in Table 4, the results of a t-test for mean difference of bank performance show that: 1) the averages of regional banks’ performances (i.e., ROA is 3.68% and ROE is 27.80%) are significantly higher than those of the other-banks (i.e., ROA is 2.084% and ROE is 11.444%). These results corroborate the H1.5 hypothesis; 2) the average of foreign-owned banks’ performance proxied by ROA is significantly higher than that of the other-banks (3.21% vs 2.35%), however it is not significantly different from other banks if performance is measured by ROE. Thus, the result with regard to the H1.6 is mixed; 3) the averages of state-owned banks’ performances (i.e., based on ROA and ROE) are not sig-nificantly different from those of the other banks. Therefore, the H1.4 is not substantiated; Table 3. Descriptive Statistics
Range Minimum Maximum Mean Std. Deviation
ROA 8.74 -1.63 7.11 2.51 1.61
ROE 50.87 -4.02 46.85 15.81 11.32
CICG 2.15 1.85 4.00 3.11 0.52
AGE 3.12 1.61 4.73 3.38 0.59
CAR 58.31 10.34 68.65 25.40 14.33
SIZE 7.81 25.70 33.51 29.28 1.77
SOE 1.00 0.00 1.00 0.06 0.23
REGIONAL 1.00 0.00 1.00 0.27 0.44
FOB 1.00 0.00 1.00 0.19 0.39
FOREIGN 1.00 0.00 1.00 0.38 0.49
Table 4.T-test for Mean Difference of Bank Performance Based on Ownership Struc-ture
Category Group Statistics N Mean of*ROA Mean of*ROE
SOE 1 5 2.544 18.338
(0.481) (0.305)
0 85 2.509 15.657
(0.476) (0.318)
Regional 1 24 3.686 27.803
(0.000)*** (0.000)***
0 66 2.084 11.444
(0.000)*** (0.000)***
FOB 1 17 3.211 12.902
(0.023)** (0.122)
0 73 2.348 16.483
(0.043)** (0.040)**
Private 1 44 1.596 10.097
(0.000)*** (0.000)**
0 46 3.386 21.267
(0.000)*** (0.000)***
Note: the p-values are shown in parentheses whereas the coefficient estimates are on the first row ***Significant at 0.01(1-tailed); **Significant at 0.05(1-tailed); *Significant at 0.10(1-tailed)
Table 5. T-test for Mean Difference of Foreign Ownership and Listed Status on Practice
of Corporate Governance
Category Group Statistics N Mean of CICG
Foreign 1 34 3.201
(0.108)
0 56 3.060
(0.114)
Listed 1 24 3.331
(0.008)***
0 66 3.034
(0.009)***
4) Private banks have a lower performance (i.e., average ROA is 1.596% and ROE is 10.097%) than that of other-banks (i.e., ROA is 3.386% and ROE is 21.267%).
Table 5 shows that the average of for-eign-owned banks’ CICIG is not significantly different from that of the other banks while the average of listed banks’ CICG on Indo-nesian Stock Exchange (i.e., CICG is 3.331) is significantly higher than that of the other banks (i.e.,CICG is 3.034).
Correlation Analysis
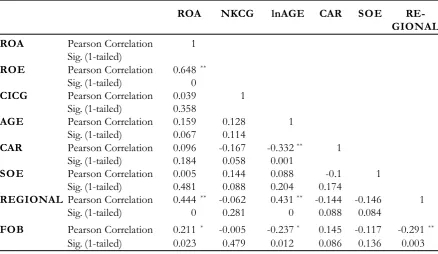
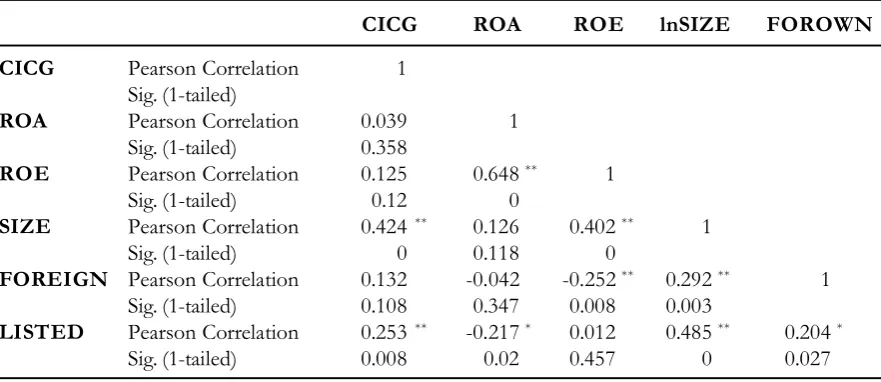
The bivariate analysis in Table 6 shows the highest correlation is between and regional banks and ROA (r = 0.444) and between re-gional banks and ROE (r = 0.642). In addi-tion, the bivariate analysis in Table 7 shows the highest correlation is between size and
CICG (r = 0.424). This should not be a con-cern until it exceeds 0.8. The table also indi-cates that apparently there is no serious multicollinearity among the independent vari-ables.
As presented in Table 6, regional banks have a significant positive correlation with ROA and ROE (both significant at 99% con-fidence level) while foreign-owned banks have a significant positive correlation with ROA (significant at 95% confidence level) and CAR has a significant positive correla-tion with ROE (significant at 99% confidence level). Further, from Table 7, it can be ob-served that the size and listing status is sig-nificantly correlated with the CICG at 99 percent confidence level with the predicted sign. The bivariate analysis is intriguing be-cause the results provide a basis for
interpret-Table 6. Pearson Correlation Analysis for Model 1a
ROA NKCG lnAGE CAR SOE
RE-GIONAL
ROA Pearson Correlation 1
Sig. (1-tailed)
ROE Pearson Correlation 0.648 **
Sig. (1-tailed) 0
CICG Pearson Correlation 0.039 1
Sig. (1-tailed) 0.358
AGE Pearson Correlation 0.159 0.128 1
Sig. (1-tailed) 0.067 0.114
CAR Pearson Correlation 0.096 -0.167 -0.332** 1
Sig. (1-tailed) 0.184 0.058 0.001
SOE Pearson Correlation 0.005 0.144 0.088 -0.1 1
Sig. (1-tailed) 0.481 0.088 0.204 0.174
REGIONAL Pearson Correlation 0.444 ** -0.062 0.431** -0.144 -0.146 1
Sig. (1-tailed) 0 0.281 0 0.088 0.084
FOB Pearson Correlation 0.211 * -0.005 -0.237* 0.145 -0.117 -0.291**
Sig. (1-tailed) 0.023 0.479 0.012 0.086 0.136 0.003
**. Correlation is significant at the 0.01 level (1-tailed). *. Correlation is significant at the 0.05 level (1-tailed).
a The untabulated results for ROE indicate regional banks have a positve correlation with ROE (sig. at 5% level) while
Table 7. Pearson Analysis for Model 2b
CICG ROA ROE lnSIZE FOROWN
CICG Pearson Correlation 1
Sig. (1-tailed)
ROA Pearson Correlation 0.039 1
Sig. (1-tailed) 0.358
ROE Pearson Correlation 0.125 0.648** 1
Sig. (1-tailed) 0.12 0
SIZE Pearson Correlation 0.424 ** 0.126 0.402** 1
Sig. (1-tailed) 0 0.118 0
FOREIGN Pearson Correlation 0.132 -0.042 -0.252** 0.292** 1
Sig. (1-tailed) 0.108 0.347 0.008 0.003
LISTED Pearson Correlation 0.253 ** -0.217* 0.012 0.485** 0.204*
Sig. (1-tailed) 0.008 0.02 0.457 0 0.027
**. Correlation is significant at the 0.01 level (1-tailed). *. Correlation is significant at the 0.05 level (1-tailed).
b The untabulated results for ROE show that none of variables have a correlation with ROE.
ing the results of two-stage least squares (2-SLS) in investigating of the endogeneity be-tween CG practices and bank’s performance.
Two-Stage Least Squares (2SLS)
Regressions Results
Table 8 and 9 present regression results of the 2SLS regressions. Both tables show that the CG practices in the banking sector positively influence the level of bank perfor-mance as measured by ROA and ROE, sup-porting hypothesis H1.1. On the other hand, the level of bank performance does not have a positive impact on CG practice. Therefore, this study corroborates the previous studies that find the positive impact of CG practices on bank performance (Adam and Mehran 2003; Gompers et al 2003; Brown and Caylor 2006; Andres and Vallelado 2008; Bhagat and Bolton 2008) but fails to support the endogeneity relationship between CG and bank performance as documented by Bhagat and Jefferis (2002), Bolton and Bhagat (2008), Cornett et al. (2009). Thus, hypoth-esis 2.1 (H2.1) is not substantiated.
The absence of a causality relationship between corporate governance and bank per-formance may be due to the bank industry being regulated. As we know, CG practices of banks are regulated by Bank Indonesia rule No. 8/14/PBI/2006 so banks with good cor-porate governance practices will achieve higher bank profitability, not vice versa.
An age of bank does not have a posi-tive effect on bank performance, so hypoth-esis H1.2 is not supported. Thus, this study does not corroborate the argumentation that age of bank yields higher experiences that are needed to increase bank performance (Mamoghli and Dhoibi 2009).
Table 8. The Causality Output Statistics of ROA and CICG
ROA CICG
Hypothesis Coefficient p-value Hypothesis Coefficient p-value
ROA + -0.017 0.385
CICG + 1.102 0.061 *
AGE + -0.029 0.4625
CAR + 0.022 0.029 **
SOE + 0.767 0.134
REGIONAL + 2.256 0.000 ***
FOB + 1.537 0.000 ***
SIZE + 0.120 0.001 ***
FOREIGN + 0.002 0.495
LISTED + 0.050 0.373
Intercept -2.318 0.158 -0.384 0.355
Adjusted R Square 0.305 0.144
F-Statistics 7.506 0.000 *** 4.746 0.002 ***
*significant at 10 percent level; **significant at 5 percent level; ***significant at 1 percent level
Table 9. The Causality Output Statistics of ROE and CICG
ROE CICG
Hypothesis Coefficient p-value Hypothesis Coefficient p-value
ROE + -0.004 0.313
CICG + 12.464 0.006 ***
AGE + 1.802 0.199
CAR + -0.119 0.069
SOE + 2.934 0.270
REGIONAL + 16.801 0.000 ***
FOB + 3.504 0.11
SIZE + 0.132 0.004 ***
FOREIGN + -0.034 0.403
LISTED + 0.050 0.361
Intercept -31.363 0.026 ** -0.693 0.294
Adjusted R Square 0.426 0.146
F-Statistik 12.019 0.000 *** 4.802 0.002 ***
We find that regional banks have a bet-ter performance (in both performance mea-sures) than private banks. Therefore, we con-clude that hypotheses H1.5 is supported. As mentioned above, regional banks have full funding support from local governments where they operate. A greater financial sup-port, as well as a good image perceived by the public provides easier access to increase lending activities and bank performance (Altunba et al. 2001).
Meanwhile, being foreign-owned has a positive influence on bank performance proxied by ROA only. This finding supports the argumentation that foreign-owned banks are more efficient (Havrylchyk 2003) and more productive (Yudaeva et al. 2003) than domestic-owned banks when using ROA as the profitability measurement. This finding is also corroborated by Demirguc- Kunt and Huzinga (2000), Bonin et al. (2005), and Micco et al. (2007). Micco et al. (2007) that show that the average foreign bank located in developing country has a ROA that is 0.37 percent points higher than that of a compa-rable private bank. Therefore, foreign banks located in developing countries tend to be more profitable than private banks. ROE may have drawbacks as a performance measure-ment so we fail to find the influence of for-eign ownership on bank profitability. Berger et al. (2005) provide two main reasons of less appealing of ROE as bank performance mea-surement, i.e.:
1) ROE does not control for the bank’s out-put which may be very difficult to change, at least in the short run other than by a large governance change. Thus, one bank may significantly more profitable than an-other due to scale or output mix, rather than quality of its management.
2) ROE is not adjusted for changes over time in the distribution of bank profitability or variability of bank profits.
Further, foreign banks may have a lack of understanding about the domestic market and local clients in the host country there-fore this condition inhibits the there-foreign banks from achieving higher performance (De Young and Nolle 1996).
Furthermore, we find that CG practices are positively affected by size of bank, or only hypothesis H2.2 is supported. This finding sup-ports the previous studies that find a posi-tive relationship between bank size and cor-porate governance practice (Black et al 2006; Sung Suk 2008). Levine (2004) argues that a larger size needs a higher GCG to reduce asymmetric information between insider and outsider investors.
unfair to other banks. Further, from the tax payers’ point of view, it may also not be in their best interests to spend their taxes on low-interest investments such as savings/deposits in regional banks. Thus, the policy of pro-viding privileges to regional banks for access-ing cheap fundaccess-ing may need to be reassessed in light of these concerns.
Conclusions
This study aims to investigate the cau-sality relationship (endogeneity) between CG practices and bank performance. The deter-minants of bank performance are CG prac-tice, age of bank, CAR, and type of banks while the determinants of CG practices are
bank performance, size of bank, foreign own-ership, and listing status.
Using a composite index of CG accord-ing to Bank Indonesia regulation No. 8/14/ PBI, we find that CG practices, CAR, re-gional bank and foreign-owned bank have positive influences on bank performance measured by ROA. But, bank performance measured by ROE is only positively affected by CG practices and regional bank.
Further, we find that CG practices have a positive impact on bank performance, but not vice versa. On the other words, we do not find the causality relationship between CG practices and bank performance. This study also shows that CG practices are posi-tively affected by size of bank.
References
Adams, R. B., and H. Mehran. 2003. Is corporate governance different for bank holding companies? Economic Policy Review 9: 123 – 142.
Adams, R. B., and H. Mehran. 2005. Corporate performance, board Structure, and its determinant in the
Banking Industry. Working Paper. http://ssrn.com/abstract= 302593.
Aigner, D., C. Lovell, and P. Schmidt. 1977. Formulation and estimation of stochastic frontier function models. Journal of Econometrics 6: 21–37.
Akhigbe, A., and A. D. Martin. 2008. Influence of disclosure and governance on risk of US financial service firms following Sarbanex-Oxley. Journal of Banking and Finance 32: 2124 – 2135.
Akhigbe, A., and J. E. McNulty. 2003. The profit efficiency of small US commercial banks. Journal of
Banking and Finance 27: 307 - 325.
Akhigbe, A., and J. E. McNulty. 2011. Bank monitoring, profit efficiency, and the commercial lending business model. Journal of Economics and Business 63: 531-551.
Altunbas, Y., L. Evans and P. Molyneux. 2001. Bank Ownership and Efficiency. Journal of Money, Credit and Banking 33 ( 4): 926-954.
Andres, P., and E. Vallelado. 2008. Corporate governance in banking: The role of board of director. Journal of Banking and Finance 32: 2570 – 2580.
Bank Indonesia. 2004. Arsitektur Perbankan Indonesia. http://www.bi.go.id/ web/id/Perbankan/ Arsitektur+Perbankan+Indonesia/
Bank Indonesia. 2006. Peraturan Bank Indonesia Nomor 8/4/PBI/2006 Tentang Pelaksanaan Good Corporate
Governance Bagi Bank Umum. http://www.bi.go.id/web/id/ Peraturan/Perbankan/pbi+8406.htm.
Bank Indonesia. 2006. Peraturan Bank Indonesia Nomor 8/14/PBI/2006 Tentang Perubahan Atas Peraturan
Bank Indonesia Nomor 8/4/PBI/2006 Tentang Pelaksanaan Good Corporate Governance Bagi Bank Umum. http://www.bi.go.id/web/id/Peraturan/ Perbankan/pbi_81406.htm.
Bank Indonesia. 2007. Surat Edaran Kepada Semua Bank Umum di Indonesia Perihal Pelaksanaan Good
Corpo-rate Governance Bagi Bank Umum. http://www.bi.go.id/web/id/Peraturan/Perbankan/ pbi_81406.htm.
Bank Indonesia. 2007. Peraturan Bank Indonesia Nomor:9/13/PBI/2007 Tentang Kewajiban Modal Minimum
Bank Umum dengan Memperhitungkan Risiko Pasar. http://www.bi.go.id/web/id/Peraturan/ Perbankan/pbi_091307.htm
Berger, A. N., G. R. G. Clarke, R. Cull, L. Klapper, and G. F. Udell. 2005. Corporate governance and bank performance: A joint analysis of the static, selection, and dynamic effects of domestic, for-eign, and state ownership. Journal of Banking and Finance 29: 2179-2221.
Bhagat, S., and B. Black. 2002. “The non-correlation between board independence and long-term firm performance”. Journal of Corporation Law 27: 231–274.
Bhagat, S., and J. H. Jefferris. 2002. The Econometrics of Corporate Governance Studies.The MIT Press, Cam-bridge, Massachusetts.
Bhattacharyya, A., C.A.K. Lovell, and P. Sahay. 1997. The Impact of Liberalization on the Productive Efficiency of Indian Commercial Banks, European Journal of Operational Research 98: 332-345. Black, B., H. Jang, and W. Kim. 2006. Does corporate governance predict firms market value? Evidence
from Korea. ECGI Working Paper Series, http://ssrn.com/abstract=311275 .
Bodie, Zvi, A. Kane, and A. J. Marcus. 2009. Investments Eighth Edition. Singapore : McGraw Hill International Edition.
Bolton, B., and S. Bhagat, S. 2008. Corporate Governance and Firm Performances. Journal of Corporate
Finance 14: 257 – 273.
Bonin, J., P. I. Hasan, and P. Watchel. 2005. Bank performance, efficiency and ownership in transition countries. Journal of Banking and Finance 29: 31 – 53.
Boyd, J. E, Levine, R., Smith, B.D. (2001). The impact of inflation on financial sector performance Journal of Monetary Economics 47: 221 – 248.
Brooks, C. 2007. Introductory Econometrics for Finance. United Kingdom : Cambridge University Press.
Brown, L. D. and M. L. Caylor. 2006. “Corporate Governance and Firm Valuation”. Journal of Accounting
and Public Policy 25: 409 – 434.
Caprio, G., L. Laeven, and R. Levine. 2007. Governance and bank valuation. Journal of Financial Intermedia-tion 16: 584 – 617.
Chang, C. E., I. Hasan and W.C. Hunter, W. C. 1998. Efficiency of multinational banks: an empirical investigation ‘, Applied Financial Economics 8 (6): 689-696
Choe, H., and B.S. Lee. 2003. Korean bank governance reform after the Asian financial crisis. Pacific-Basin Finance Journal 11: 483-508.
Choi, S., and I. Hasan. 2005. Ownership, governance, and bank performance: Korean experience. Financial Markets, Institutions, and Instruments 14(4), New York: Blackwell Publishing Inc.
Christopher, M.F.Y. 2009. The relationship between corporate governance and bank performance in Hong Kong, Dissertation, Auckland University of Technology, http://aut.researchgateway.ac.nz/ bitstream/10292/739/4/YungMF.pdf
Claessen, S., A. D. Kunt, and H. Huizinga. 2001. “How Does Foreign Entry Affect Domestic Banking Markets?”. Journal of Banking and Finance vol 25, pp 891 – 911.
Coleman, A. D. F., N. Esho, and I.G. Sharpe. 2006. Does bank monitoring influence loan contract terms? Journal of Financial Services Research 30: 177–198.
Cornett, M.M., J.J. McNutt, and H. Tehranian. 2009. Corporate governance and earnings management at large US bank holding companies. Journal of Corporate Finance 15: 412-430.
Cooper, E. W. 2009. Monitoring and governance of private banks. The Quarterly Review of Economics and
Finance vol 49, pp 253 – 264.
Dahlquist, M., and G. Robertsson. 2001. Direct foreign ownership, institutional investors, and firm char-acteristics. Journal of Financial Economics 59: 413-440.
Damodaran, A. 2002. Investment Valuation (2nd Edition). New York : John Wiley & Sons, Inc.
DeAngelo, H., and L. DeAngelo. 1985. Managerial ownership of voting rights: a study of public corpo-ration with dual classes of common stock. Journal of Financial Economics 14: 33-69.
DeYoung, R., and I. Hasan. 1998. The performance of the Novo bank commercial bank : A profit efficiency approach. Journal of Banking and Finance 22: 565-587.
DeYoung, R., L.G. Golberg, and L.J. White. 1999. Youth, adolescence, and maturity of banks : credit availability to small business in an era of banking consolidation. Journal of Banking and Finance 23: 463 – 492.
De Young, R. and D.E. Nolle. 1996. Foreign-Owned Banks in the United States: Earning Market Share or Buying It? Journal of Money, Credit, and Banking 28 (4): 622-636.
Douma, S., R. George, and R. Kabir. 2003. Foreign and domestic ownership, business group, and firm
performance: evidence from large emerging market. Working Paper. Tilburg University.
Fama, E. F. 1980. Agency problem and the theory of the firm. The Journal of Political Economy 88 (2): 288 – 307.
Fama, E. F., and M.C. Jensen. 1983. Separation of ownership and control. Journal of Law and Economics
XXVI (June).
Goldberg, L.S., B.G. Dages, and D. Kinney. 2000. Foreign and domestic bank participation in emerging
markets: lessons from Mexico and Argentina. Working paper 7714, http://www.nber.org/papers/
w7714.
Hadad, M. D., A. Sugiarto, W. Purwanti, M. J. Hermanto, and B. Arianto. 2003. Kajian mengenai Struktur Kepemilikan Bank di Indonesia, www.bi.go.id/NR/...5D87.../Kajian mengenai Struktur kepemilikan Bank.pdf
Hadad, M. D., W. Santoso, D. S. Besar, I. Rulina, W. Purwanti, and R. Satria. 2011. Fungsi Intermediasi Bank Asing dalam Mendorong Pemulihan Sektor Riil di Indonesia, http://www.bi.go.id/NR/ rdonlyres/1414FFFC-16AE-4506-9513-BAF6D12B764A/7819/BankAsing.pdf.
Handy. 2008. Hubungan Simultan antara Nilai Perusahaan dengan Praktek Corporate Governance di Bursa Efek Indonesia. Thesis, Fakultas Ekonomi Universitas Indonesia.
Havrylchyk, O. 2006. Efficiency of the polish banking industry: foreign versus domestic bank.. Journal of Banking and Finance 30: 1975 – 1996.
Hermalin, B. E., and M.S. Weisbach. 1988. The determinant of board composition. The RAND Journal of
Economics 19 (4): 589 – 606.
Hermalin, B. E., and M. S. Weisbach. 1991. The effect of board composition and direct incentives on firm performance. Financial Management 20 (4): 101 – 112.
Jensen, M. C., and W. H. Meckling. 1976. Theory of the firm: managerial behavior, agency Cost and ownership structure. Journal of Financial Economics 3 (4): 305-360.
Kanchel, I. 2007. Corporate governance: measurement and determinant analysis. Managerial Auditing
Jour-nal 22 (8): 740 – 760.
Kim, P. K., and D. Rasiah. 2010. Relationship between corporate governance and bank performance in Malaysia during the pre and post Asian financial crisis. European Journal of Economics, Finance, and Administrative Sciences 21: page?
La Porta, R., F. Lopez-de-Silanez, and A. Shleifer. 2002. Government ownership of banks. The Journal of
Finance 57 (1): 265 – 301.
Levine, R. 2004. The Corporate governance of banks : A concise discussion of concept and evidence. Working Paper 3404, World Bank Policy Research.
Lin, X. And Y. Zhang. 2009. Bank ownership reform and bank performance in China. Journal of Banking
and Finance 33: 20-29.
Mamoghli, C., and R. Dhouibi. 2009. Bank corporate governance and insolvency risk, Evidence from an
emerging market. Working Paper Series, http://ssrn.com/abstract=1391878.
Manlagnit, M. C. V. 2011, Cost efficiency, determinants, and risk preferences in banking: A case of stochastic frontier analysis in the Phillipines. Journal of Asian Economics 22: 23-35.
Meeusen, W., and J. van der Broeck. 1977. Efficiency estimation from Cobb–Douglas production func-tions with composed error. International Economic Review 18: 435–444.
Micco, A., U. Panizza, and M. Yanez. 2007. Bank ownership and performance. Does politics matter?. Journal of Banking and Finance 31: 219 – 241.
Naceur, S. B., and M. Kandil. 2009. The impact of capital requirements on banks cost of intermediation and performance: the case of Egypt. Journal of Economics and Business 61: 70 – 89.
Nachrowi, N. D., and H. Usman. 2005. Penggunaan Teknik Ekonometri Edisi Revisi. Jakarta : PT RajaGrafindo Persada.
Nachrowi, N. D., and H. Usman. 2006. Pendekatan Populer dan Praktis Ekonometrika Untuk Analisis Ekonomi
OECD. 1999. OECD Principle of Corporate Governance.
Peraturan Pemerintah Republik Indonesia. 1999. Peraturan Pemerintah Republik Indonesia Nomor 29 Tahun
1999 Tentang Pembelian Saham Bank Umum. http://www.bpkp.go.id/unit/hukum/pp/1999/029-99.pdf
Rhoades, S., 1998. The efficiency effects of bank mergers: An overview of case studies in nine mergers. Journal of Banking and Finance 22 (3): 273–291.
Roseinstein, S., and J.G. Wyatt. 1990. Outside directors, board independence, and shareholder wealth. Journal of Financial Economics 26: 176-191.
Saunders, A., and M. Cornett. 2005. Financial Markets and Institutions: An Introduction to the Risk Management Approach, Boston, Mass: McGraw-Hill/Irwin.
Shleifer, A., and R. W. Vishny. 1997. A Survey of corporate governance. Journal of Finance vol 52 (2): 737 – 783.