Preparation and Characterization of Carbon Foam
Derived from Fine Coal and Phenolic Resin
Dodi Irwandi
1,2, Zainal Alim Mas’ud
1,*, Komar Sutriah
1, and Muhammad Khotib
1 1Department of Chemistry, Faculty of Mathematic and Natural Sciences, Bogor Agricultural University,Darmaga Campus, Kimia Building, Tanjung Street, Bogor 16680, Indonesia
2Health Polytechnic of Ministry of Health Jakarta II,
Jl. Hang Jebat III Blok F3 Kebayoran Baru Jakarta Selatan 12120, Indonesia
Received February 2, 2016; Accepted May 26, 2016
ABSTRACT
Carbon foam from fine coal and phenolic resin mixture had been prepared by heating in nitrogen atmosphere. The composition of fine coal in a mixture was 30, 35, 40, 45 and 50%. Physical and mechanical characters of carbon foam that were determined from each of these compositions were density, porosity, compressive strength, and oxidation resistance and thermal insulation. Microstructure was observed by scanning electron microscope (SEM). Thermal insulation was tested using an insulation index approach with Styrofoam for comparison. The result showed that the density and compressive strength were proportional to the composition, otherwise, the porosity. Oxidation resistance that was up to 45% composition still showed proportional value. Microstructure observations showed an irregular distribution of pore and uninform diameter. Insulation index of 34 to 50 °C showed almost the same values of all compositions and greater than styrofoam up to 50-150% which mean carbon foam had a better thermal insulation properties than styrofoam.
Keywords:carbon foam; thermal insulation; insulation index; fine coal; phenolic resin
ABSTRAK
Karbon foam berbahan dasar campuran fine coal dan resin fenolik telah dibuat dengan cara pemanasan pada suasana nitrogen. Komposisi fine coal dalam campuran yaitu 30, 35, 40, 45 dan 50%. Karakter fisik dan mekanik carbon foam yang ditentukan dari setiap komposisi tersebut yaitu densitas, porositas, kuat tekan, resistensi oksidasi dan insulasi termal. Karakter struktur mikro diamati menggunakan mikroskop elektron payaran. Uji insulasi termal menggunakan pendekatan indeks insulasi dengan styrofoam sebagai pembanding. Hasil pengujian menunjukkan nilai densitas dan kuat tekan berbanding lurus dengan kenaikan komposisi fine coal sedangkan porositas sebaliknya. Resistensi oksidasi sampai dengan komposisi 45% menunjukkan nilai yang berbanding lurus dengan kenaikan komposisi. Pengamatan mikrostruktur menunjukkan sebaran pori yang tidak teratur dan diameter yang tidak seragam. Indeks insulasi suhu 34 sampai dengan 50 °C menunjukkan nilai yang hampir sama dari semua komposisi dan lebih besar dari styrofoam sampai dengan 50-150%. Hal ini menunjukkan carbon foam memiliki sifat insulasi termal yang lebih baik dari styrofoam pada rentang suhu tersebut.
Kata Kunci:carbon foam; insulasi termal; indeks insulasi; fine coal; resin fenolik
INTRODUCTION
Coal is one of the most important energy sources in the world. Coal processing is important to produce the best quality of coal. The treatment process produces a residue as fine coal that found in pools of storage. The number of fine coal in the world at 2011 is estimated reach 58 Gt [1]. This number will continues to grow in line with increased production capacity of coal.
Fine coal contains high enough coal and ash [2]. Its also contains volatile matter, fixed carbon and sulphur, which are relatively small [3]. Silica and alumina are the
main minerals contained in it [4-5]. Fine coal briquettes are made for a heat source in small-scale power generation, metals and cement industries. However, its release fly ash and sulphur that is harmful to the environment.
Several methods have been developed for the recovery of fine coal that was flotation [3] and agglomeration [2]. However, these methods required much reagent, which needed a higher cost [6].
[10]. These applications are determined by the properties of carbon foam that is influenced by the precursor and process control during synthesis [11].
Ford first introduced carbon foam as thermal insulation in 1964. Ford [12] using a phenol-formaldehyde resin (phenolic resin) as precursors and reagents as a foaming agent. The mixture of both was heated in a non oxidizing atmosphere with a constant temperature rising until carbonization temperature was reached. During the heating, volatile and decomposed fractions of precursor are served as a producer of bubbles to form foam cells then these cells will harden.
Aluminosilicate and clay was an additive that has been used in the manufacture of carbon foam. Research conducted by Wu et al. [7] using a mixture of a phenolic resin precursor and additives aluminosilicate resulted carbon foam with compressive strength properties, bulk density and oxidation resistance increased with the increase of alumina silicate was added. The addition of the clay to the precursor CTP (coal tar based mesophase pitch) improved the compressive strength properties and lower thermal conductivity of the carbon foam [13]. The use of coal as a precursor resulted carbon foam with a low apparent density property [14-15].
The aim of our research was to produce carbon foam using mixture of fine coal and phenolic resin as precursor. The minerals containing in fine coal were function as additive. The carbon foam product was characterized for its physical, mechanical, and oxidation resistance and micro structural observations.
EXPERIMENTAL SECTION
Materials
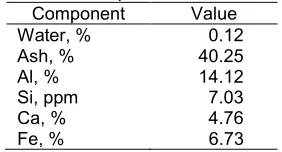
Materials used were Fine coal (analysis of data was listed in Table 1), Phenolic resin (Tamanol 586) purchased from Arakawa Taiwan Chemical with formaldehyde composition and PTBP (para tertier butyl phenol) 50% (w/w) respectively, and nitrogen.
Instrumentation
Mineral analysis of the fine coal was determined using ICP (Inductively Coupled Plasma) Spectrometer (Thermo Scientific 7000). Weight loss of mixture fine coal and phenolic resin (40:60) was determined using TGA (Exstar SII 7300). The electric furnace (Thermo
Ca, % 4.76
Fe, % 6.73
Scientific Thermolyne) with interior dimension (12.7 x 17.7 x 25.4 cm) was used as reactor heater. Carbon foam microstructure was observed using SEM (scanning electron microscope) (Carl Zeiss EVO MA 10). Compressive strength was tested using the UTM (universal testing machine) (Instron 3369).
Procedure
Synthesis of carbon foam [7,14]
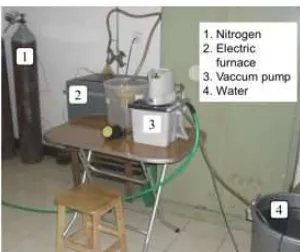
Fine coal and phenolic resins were crushed to < 60 mesh. Both were mixed with the composition of fine coal as follow 30, 35, 40, 45 and 50 (% w/w). That was symbolized as follow FC30, FC35, FC40, FC45 and FC50, respectively. The samples were poured into a cube-shaped mold (3 x 10 x 10 cm) made of iron plates. The mold inside was coated by aluminum sheet (Fig. 1a). Once the mold was sealed and then was inserted into the pyrolysis reactor. The reactor was made of iron plates cube (10 x 15 x 15 cm) and was equipped with connections for connecting copper pipes with nitrogen gas source (Fig. 1b). The reactor was sealed and then inserted into an electric furnace (Thermo Scientific Thermolyne). Nitrogen gas was flowed at a constant rate into the reactor through a copper pipe. The schemes were presented in Fig. 2.
The furnace was turned on and regulated the temperature to generated heat with an average increase of 5 °C per minute during the synthesis process. Heating was done with the following settings: hold at a temperature of 130 °C for 45 min and at a temperature of 235 °C for 1 h, after the temperature reached 330 °C the furnace was turned off. The furnace at off condition let its temperature drops to 200 °C with nitrogen gas still be flowing into the reactor. Nitrogen flow was stopped and the temperature was allowed until room temperature was reached. The reactor was removed from the furnace and synthesis products were removed from the mold.
Bulk density test
Fig 1. Synthesis equipments of carbon foam (a) mold
coated by aluminum sheet (b) pyrolysis reactor Fig 2. Instrumentation scheme of carbon foam synthesis
Fig 3.Insulation test (a) Face A sample (b) thermometer position at face B sample
Porosity test
Samples predetermined volume and weight was put into the water in the beaker. Samples were left a few minutes in the water to ensure the pores filled with water. Furthermore, the sample was weighed using the analytical balance (Ohaus pioneer) with a precision of 0.0001 g. Porosity values was calculated using Eq. 1 [16].
Weight absorbed water
Porosity (%) = x 100
Density of water x Volume of sample
Weight of water absorbed was the difference of the weight after and before the sample was introduced into the water in unit of gram, the density of water at a temperature of 25 °C is 0.99704 g/cm3, the volume of
the sample was in cm3. Porosity value of each sample
was the average value of three times of testing.
Compressive strength test
The compressive strength test was performed using UTM (Instron 3369). The emphasis on speed was set to 1.5 mm/min. The compressive strength was calculated by dividing the maximum load value in units of kgf and area of the sample in units of mm2. The area
was a multiplication of the length and width of the sample stated respectively in units of mm. The compressive strength value obtained was five times the average value of the test and expressed in units of MPa.
Oxidation resistance measurement [7]
The sample was heated in an electric furnace at temperatures of 400 °C for 3 h. The weight of the sample before and after heating was weighed using the analytical balance (Denver instrument TB-214) with a precision of 0.0001 g. The percentage of weight lost oxidized calculated by the Eq. 2.
1 2
1
M - M
R= x 100%
M
R was the percentage of weight lost oxidized, M1 and M2 was the mass of the sample before and after sample heated respectively. The result that was reported was the average of three tests.
Microstructure characterization
Microstructure of carbon foam that was observed was pore diameter and its distribution. Observations were carried out using SEM (Carl Zeiss EVO MA 10) to the FC40 and FC45.
Thermal insulation test
Thermal insulation test was performed using a hot plate (Barnstead Thermolyne Cimarec) that temperature was set up to 80 °C. Further samples in cubes form were put in a box made of styrofoam. One face (A) of the sample was exposed to the heating plate (Fig. 3a). The opposite face (B) covered with styrofoam. A hole was drilled in the center of the covered styrofoam and a thermometer was inserted until it touched the specimen (Fig. 3b).
Alcohol thermometer was used with a reading accuracy of 0.5 °C. The sample was heated for 30 min. During this time the temperature changes and achievements of the time recorded manually. The same treatment was done well against the styrofoam (STR) as a comparison. Insulation index was calculated using the Eq. 3 [11].
34 50
t I
δ
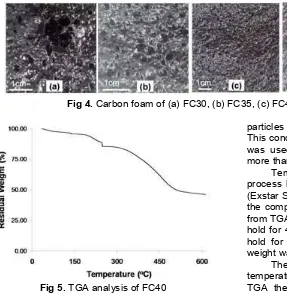
Fig 4.Carbon foam of (a) FC30, (b) FC35, (c) FC40, (d) FC45 and (e) FC50
Fig 5.TGA analysis of FC40
Table 2. Density, porosity and compressive strength of carbon foam
Sample Density
(g/cm3)
Porosity (%)
Compressive strength (MPa)
FC30 0.429 12.81 0.29
FC35 0.466 6.70 0.52
FC40 0.569 6.66 0.75
FC45 0.664 5.68 1.50
FC50 0.682 4.54 2.38
I34-50was insulation index (min/cm) at temperatures face
B from 34 to 50 °C, t is the time in min, sample thickness in cm. The result that was reported was the average of three replications testing and plotted into a curve with temperature as the x-axis.
RESULT AND DISCUSSION
Synthesis of Carbon Foam
Carbon foam based on usage of final temperature synthesis was classified into three type : green foams (< 600 °C), calcined foams (600–1600 °C) and graphitized foams (> 1600 °C) [17]. The study used a final temperature of 330 °C so the carbon foam produced was green foams. The resultant of carbon foam was presented in Fig. 4. Visual observation showed FC30 had a rougher surface than FC35. Surface of FC40 was seen smoother than FC45. Some fine coal
particles in FC50 were not bound to a phenolic resin. This condition gave the information that fine coal which was used in the synthesis of carbon foam was not more than 50% of the total mixture.
Temperature parameters on the synthesis process have been confirmed by analysis of the TGA (Exstar SII 7300) using a mixture of raw materials with the composition of fine coal was 40%. Based on data from TGA (Fig. 5) when the temperature of 130 °C was hold for 45 min and at the temperature of 235 °C was hold for 1 h and final temperature was 330 °C the weight was reduced to 5, 13 and 20%, respectively.
The temperature 330 °C was chosen as best temperature on the synthesis although according to TGA the temperature that can be used was up to 600 °C. At this temperature occur weight reduction was about 55% and a reduction in weight tends to be stable at temperatures above. In the preliminary research it has been conducted synthesis of carbon foam using a final temperature of 500, 400 and 330 °C but the resulting product at a temperature of 500 and 400 °C was very fragile.
This condition was occurred due to the limitations of the mold that was not designed to control the pressure. Though the pressure was one factor which determined the strength of the carbon foam structure [18]. The higher the pressure, the stronger the structure of carbon foam was produced and conversely it was brittle and easily to be shattered.
Density, Porosity and Compressive Strength
The value of density, porosity and compressive strength of carbon foam was presented at Table 2. It was seen that the density and compressive strength was directly proportional to the composition of fine coal. Otherwise the value of porosity was inversely related to the composition of fine coal. The density of all composition had a range of 0.4 to 0.7 g/cm3, this value
was smaller than the density carbon foam synthesized by Wang et al. [13] which had a range of 0.6 to 0.7 g/cm3.
Fig 6.Weight loss of carbon foams with different content of fine coal
Fig 7. SEM image of carbon foam (a) FC40 and (b)
FC45
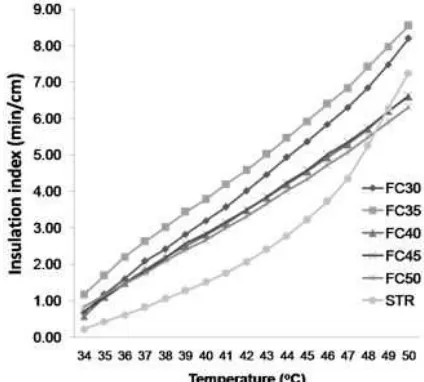
Fig 8. Plot temperatures vs insulation index of carbon foams and styrofoam (STR)
carbon foam so its density becomes higher. Minerals improve the compressive strength of carbon foam by filling in void at the cell structure of carbon foam.
Oxidation Resistance
Oxidation resistance was expressed as the amount of weight lost after carbon foam was heated at atmospheric oxidation. Therefore, oxidation resistance was inversely proportional to the weight lost on heating. Lost of Weight FC30 to FC45 was inversely related to the composition of fine coal (Fig. 6). It was believed as the effect of alumina and silica contained in fine coal. Research conducted by Wu et al. [7] showed that aluminum and silica could reduce the weight of the carbon foam loss during heating thereby increasing the oxidation resistance. FC50 in the sample lost weight value back upward, this was due to the uneven distribution of silica and alumina in the carbon foam. This situation was supported by the carbon foam product FC50 (Fig. 4e) that some parts of fine coal was not bonded with phenolic resin.
Microstructure of Carbon Foam
The microstructures observation of carbon foam FC40 and FC45 presented in Fig. 7. Apparently pores size diameter was very different each others and the distribution of pore were irregular. Min et al. [19] found that the low temperature and pressure at synthesis process resulted carbon foam which has a large pore diameter and was not uniform. This was in line with the synthesis that was done at the temperature of 330 °C in atmospheric pressure.
Thermal Insulation Properties
The relationship curve between the achievements of temperature with an index value of thermal insulation presented in Fig. 8. As can be seen that insulation index of FC40, FC45 and FC50 was not significantly different at every temperature. FC35 and FC30 have the insulation index value was higher than the others samples. But the all sample of carbon foam has an index value higher about 50 to 150% compared to styrofoam. This condition illustrates that all samples of carbon foam, has a thermal insulation properties better than styrofoam at temperatures below 50 °C.
carbon foam were linearly proportional to the increase of the fine coal composition. The porosity was inversely related to the composition of fine coal. Oxidation resistance up to 45 wt.% of fine coal composition demonstrates the value that was directly proportional to the composition of fine coal. Microstructure observations showed the irregular of pore distribution and non-uniform of diameter. Carbon foam from all composition of fine coal has an insulation index of 50–150% greater than styrofoam at 34–50 °C which mean that carbon foam had better thermal insulation properties than styrofoam in the temperature range of 34–50 °C.
ACKNOWLEDGEMENT
This study was supported by Ministry of Health, Certification Standardization Center and Continuing Education of Health Human Resources (Pustanserdik SDMK) of PPSDM. We thank to The Ministry of Science, Department of Chemistry, Faculty of Mathematics and Natural Sciences, Bogor Agricultural University, Health Polytechnic of Ministry of Health Jakarta II for the laboratory facilities and Mr. Kosasih for his valuable help in the part of this research.
REFERENCES
1. [IEA] International Energy Agency Clean Coal Centre, 2011, Opportunities for fine coal utilisation, http:// www.iea-coal.org.uk.
2. Valdés, A.F., and Garcia, A.B., 2006,Fuel, 85 (5-6), 607–614.
3. Barraza, J., Guerrero, J., and Pineres, J., 2013,Fuel Process. Technol., 106, 498–500.
49–59.
6. Uslu, T., Sahinoglu, E., and Yavuz, M., 2012,Fuel Process. Technol., 101, 94–100.
7. Wu, X., Liu, Y., Fang, M., Mei, L., and Luo, B., 2011,Carbon, 49 (5), 1782–1786.
8. Chen, C., Kennel, E.B., Stiller, A.H., Stansberry, P.G., and Zondlo, J.W., 2006, Carbon, 44 (8), 1535–1543.
9. Baran, D., Yardim, M.F., Atakül, H., and Ekinci, E., 2013,New Carbon Mater., 28 (2), 127–133.
10. Liu, H., Li, T., Wang, X., Zhang, W., and Zhao, T., 2014,J. Anal. Appl. Pyrolysis, 110, 442–447. 11. Farhan, S., Wang, R.M., Jiang, H., and Ul-Haq, N.,
2014,J. Anal. Appl. Pyrolysis, 110, 229–234. 12. Ford, W.D., 1964,US Patent, US3121050.
13. Wang, X., Zhong, J., Wang, Y., and Yu, M., 2006,
Carbon,44 (8), 1560–1564.
14. Rogers, D.K., and Plucinski, J.W., 2003, US Patent, US6656238 B1.
15. Calvo, M., García, R., and Moinelo, S.R., 2008,
Energy Fuels,22 (5), 3376–3383.
16. Manocha, S.M., Patel, K., and Manocha, L.M., 2010,Indian J. Eng. Mater. Sci., 17, 338–342. 17. Rogers, D.K., Plucinski, J.W., and Dale, G., 2009,
US Patent, US7544222 B2.
18. Wang, Y., Min, Z., Cao, M., and Xu, D., 2009,New Carbon Mater., 24 (4), 321–326.
19. Min, Z., Cao, M., Zhang, S., Wang, X., and Wang, Y., 2007,New Carbon Mater., 22 (1), 75–79. 20. Smith, D.S., Alzina, A., Bourret, J., Nait-Ali, B.,