Full Terms & Conditions of access and use can be found at
http://www.tandfonline.com/action/journalInformation?journalCode=cbie20
Download by: [Universitas Maritim Raja Ali Haji] Date: 18 January 2016, At: 20:04
Bulletin of Indonesian Economic Studies
ISSN: 0007-4918 (Print) 1472-7234 (Online) Journal homepage: http://www.tandfonline.com/loi/cbie20
ASIAN DEVELOPMENT STRATEGIES: CHINA AND
INDONESIA COMPARED
Bert Hofman , Min Zhao & Yoichiro Ishihara
To cite this article: Bert Hofman , Min Zhao & Yoichiro Ishihara (2007) ASIAN DEVELOPMENT STRATEGIES: CHINA AND INDONESIA COMPARED, Bulletin of Indonesian Economic Studies, 43:2, 171-200, DOI: 10.1080/00074910701408057
To link to this article: http://dx.doi.org/10.1080/00074910701408057
Published online: 10 Apr 2008.
Submit your article to this journal
Article views: 304
View related articles
ISSN 0007-4918 print/ISSN 1472-7234 online/07/020171-29 © 2007 Indonesia Project ANU DOI: 10.1080/00074910701408057
ASIAN DEVELOPMENT STRATEGIES:
CHINA AND INDONESIA COMPARED
Bert Hofman and Min Zhao* Yoichiro Ishihara*
World Bank, Beijing World Bank, Jakarta
China’s and Indonesia’s development strategies have been compared with others, but rarely with each other. Radically different political contexts have produced both similar and distinctly different development patterns. Each using formal planning, Indonesia spurred radical reforms to promote growth, whereas China opted for in-cremental reforms to ‘grow out of the Plan’, as a political device and to discover what policies and institutions worked. Both strategies produced environments largely conducive to rapid development. Indonesia relied on a few economic technocrats to oversee development; China used decentralisation and party reforms to create a cred-ible environment for non-state investment. Both shared concern for agricultural re-form and food security; both opted to open up for trade—China gradually, Indonesia radically. Both did well in growth and poverty reduction following reform. China’s growth performance is in a league of its own, especially since Indonesia’s Asian crisis setback, but Indonesia had more equitable growth and survived a diffi cult political transition with, in hindsight, modest costs.
INTRODUCTION
In some ways, China and Indonesia are as different as countries can be. China is the emerging economic superpower with one-quarter of the world’s population, contributing 28% of world growth in purchasing power terms in 2005—a politi-cally centralised state that has dubbed its economy a ‘socialist market economy’. Indonesia has only one-sixth of China’s population, has just found its feet eco-nomically after a major crisis, is now the third-largest competitive democracy on the planet, and has radically decentralised political power. Until recently their paths were almost separate, as trade and investment between them faced ideo-logical and diplomatic barriers, but this is rapidly changing.1
There is large and growing attention to the China–India theme, and Indonesia is regularly compared with the newly industrialising economies and other ‘East
* Opinions expressed are those of the authors and should not be attributed to the World Bank, its executive directors or its member countries. Thanks to Homi Kharas, Louis Kuijs, Ross McLeod, William E. Wallace and two anonymous referees for comments on an earlier version of the paper. Corresponding author: Bert Hofman, bhofman@worldbank.org. 1 The economic relationship between China and Indonesia has been stronger in recent times. For example, China’s share of Indonesia’s exports and imports rose from less than 3% in the late 1980s to 8–10% in the past few years.
cBIEAug07.indb 171
cBIEAug07.indb 171 27/6/07 5:33:32 PM27/6/07 5:33:32 PM
Asia miracle’ countries (World Bank 1993), and even with India (Lankester 2004). Yet to our knowledge no comparison has been made between China’s and Indo-nesia’s development paths and strategies, although aspects of their policies and institutions have been compared before.2 Myrdal’s famous Asian Drama covers
Indonesia, but leaves out China, the big unknown at the time (Myrdal 1968), while the monumental Indonesian Economy of Hal Hill (1996, 2000) compares data on the two countries, but focuses only on Indonesia’s development strategy.
A sceptic may argue that the countries are simply too different to make com-parison useful. Look again, though, and similarities emerge. They are the two most populous countries and the two largest economies in developing East Asia. Both experienced rapid economic development after their reforms ‘took off’—in Indonesia in the 1960s and in China at the end of the 1970s. Both initiated reform after massive economic disruption—Indonesia after the hyperinfl ation and stag-nation of the latter-day Soekarno reign, and China after the disastrous Great Leap Forward and the disruptive Cultural Revolution (1966–76). Each country started its reforms with a heavily distorted economy and, in the broadest sense, reformed by opening up the economy, introducing more market elements and maintaining macroeconomic stability. Both developed rapidly under non-competitive regimes (at opposite ends of the political spectrum), and both experienced rapid growth that dramatically reduced poverty—Indonesia even more so than China. Both countries have long-term and fi ve-year plans, although these are very different and have varied considerably over time.
The paper compares China’s and Indonesia’s development strategies since the ‘take-off’ of reforms. This is taken to be 1966 for Indonesia, the year in which Soe-harto established a fi rmer grip on power and a stabilisation plan was initiated. For China, year zero is 1978, the year of the path-breaking third plenum of the 11th congress of the Central Committee of the Communist Party of China (CCCPC). Of course, describing more than 60 years of economic history for two countries in a limited space forces undue selectivity, and this paper can touch only on key features of development strategy and sectoral reform. It focuses on areas where both countries underwent signifi cant reforms. Mindful of BIES’s readership, it provides more detail on China than on Indonesia. While the paper focuses on economic reforms, these cannot be seen in isolation from political developments in the periods considered. The next section describes broad development patterns and outcomes, comparing the two countries with others where relevant. The third section outlines their broad development strategies, while the fourth compares major sectoral reforms. The fi nal section offers some conclusions on what each country can learn from the other.
GROWTH PATTERNS
While both Indonesia and China are counted among the rapidly growing countries in Asia (IMF 2006: chapter 3), China is clearly in a class of its own. After reforms took off in 1978, its annual GDP growth averaged more than 9.5%, while Indonesia
2 Zhang and Cooray (2004) make a comparison, but focus only on industrialisation strat-egy. Kong (forthcoming) includes a comparison of Chinese and Indonesian development policy in a study of the relationship between economic growth and political institutions.
cBIEAug07.indb 172
cBIEAug07.indb 172 27/6/07 5:33:32 PM27/6/07 5:33:32 PM
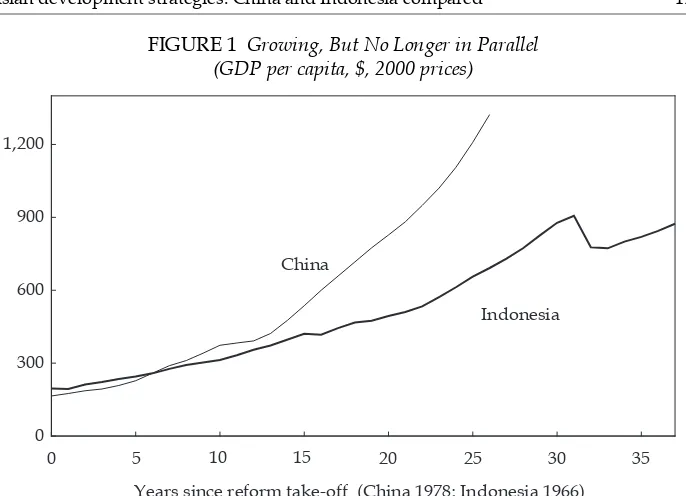
‘only’ achieved a little over 6%. That difference in growth rates, combined with lower population growth in China, mattered a lot for GDP per capita over the course of the reform periods. While both started out almost equally poor—China had per capita GDP of $165 in 1978, and Indonesia $195 in 1966 (fi gure 1)3—China
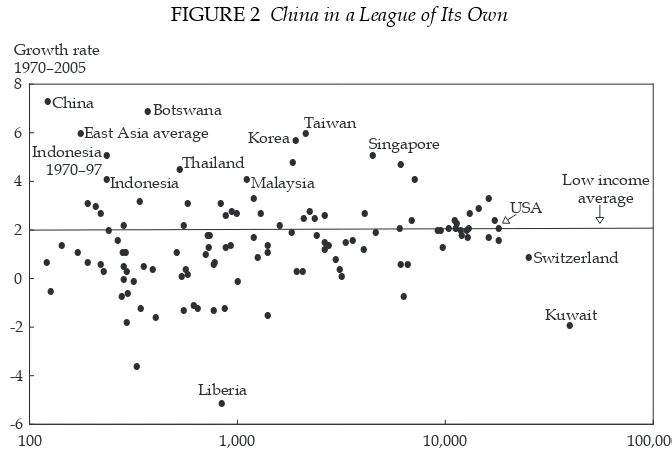
managed to increase this sevenfold within a quarter of a century, whereas Indo-nesia took a decade longer to ‘only’ quadruple its GDP per capita. China’s growth in recent decades is truly exceptional: of the 119 countries for which data are avail-able from 1970, China ranks fi rst in terms of growth in GDP per capita (fi gure 2), and only small, diamond-rich Botswana comes near—although Korea and Tai-wan (China) experienced almost similar growth rates in the 25-year period after the early 1960s. But Indonesia ranks a very respectable 12th despite the crisis, and without it, it would have ranked 7th or 8th.
China had consistently high growth in every decade of reform, despite signifi -cant slowdowns in 1981, 1989 and 1990; these years were followed by accelerated growth that recovered lost ground. Indonesia experienced much more variation in growth, but this is due solely to the Asian crisis years. Over the reform period as a whole, the standard deviation of China’s growth is 2.8, compared with 4.0 for Indonesia; however, measured over the fi rst three decades (1966–96), the standard deviation of Indonesia’s growth is only 2.3. China, on the other hand, did bet-ter than Indonesia on infl ation: even if its stabilisation years (1966–69) and 1998 are excluded, Indonesia’s annual infl ation rate (calculated using a GDP defl ator) averaged more than twice China’s modest 5.3% infl ation.
3 There is considerable debate on the reliability of the numbers in both countries for the early reform period, but especially in China. Part of the explanation for China’s extra-ordinary growth may therefore lie in the under-estimation of GDP in the early years of reform (see Naughton 2006 for an extensive discussion of various data issues).
FIGURE 1 Growing, But No Longer in Parallel (GDP per capita, $, 2000 prices)
Source: WDI (2006).
0 5 10 15 20 25 30 35
0 300 600 900 1,200
China
Indonesia
Years since reform take-off (China 1978; Indonesia 1966)
cBIEAug07.indb 173
cBIEAug07.indb 173 27/6/07 5:33:33 PM27/6/07 5:33:33 PM
Despite China’s higher per capita income, Indonesia has fewer people in pov-erty. Indonesia’s poor, as measured by the World Bank’s $1 per day purchasing power parity (PPP) consumption measure, represented 7.4% of the population in 2006, considerably lower than China’s 10.3% in 2004 (fi gure 3). In both countries poverty declined rapidly during the reform period. China’s poverty rate at $1 per day PPP consumption fell from over 60% of the population in the early 1980s to 10.3% in 2004 (Ravallion and Chen 2004; World Bank 2006a), although the early numbers probably overstate poverty because of defl ator problems. Indonesia’s lower poverty rate is due to more equal income distribution. In China, inequal-ity rose sharply over the reform period, whereas Indonesia’s income distribution barely changed (fi gure 3). Indonesia’s growth has thus been more pro-poor than that of China, and indeed of most countries (Timmer 2004).
The sharp rise in China’s inequality is due partly to the country’s rapid trans-formation, which compressed Arthur Lewis’s process of modernisation and rising inequality into a few decades. Changes in measured inequality occurred in part because in-kind benefi ts under the planned economy—better housing, access to cars and domestic personnel—were monetised under the market economy. But rising inequality also resulted from the country’s development strategy: China’s coastal development strategy increased inter-provincial inequalities, while the household registration system hampered rural citizens in competing for higher-paid urban jobs.4 Finally, China’s heavy reliance on investment and
manufactur-ing meant that urban formal sector jobs became rapidly more productive, and
4 China’s household registration system, or hukou, has been in place since the 1950s. It tied most citizens to their place of birth, as health care, education, social security, housing and, previously, grain distribution were available only in a citizen’s locality of registration.
FIGURE 2 China in a League of Its Own
East Asia average Korea Taiwan
Thailand
Per capita income 1970 ($, 2000 prices, log scale)
cBIEAug07.indb 174
cBIEAug07.indb 174 27/6/07 5:33:33 PM27/6/07 5:33:33 PM
wages rose in line. As a result, agricultural incomes increasingly lagged behind average income per capita, contributing to inequality. China’s agricultural value added in 2002 was about one-third of GDP per capita, Indonesia’s about two-thirds. More recently, intra-urban and intra-rural inequality has been on the rise as well (World Bank forthcoming).
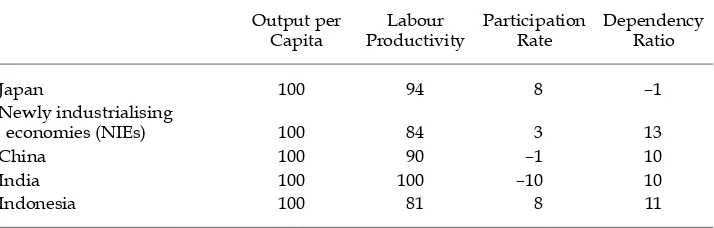
How did the two countries achieve their high growth rates per capita? In accounting terms, GDP per capita is determined by labour productivity, the dependency ratio and the labour force participation ratio. China achieved the bulk of its increase in GDP per capita from an increase in labour productivity, with about 10% contributed by a decline in the dependency ratio. Almost one-fi fth of Indonesia’s growth per capita was due to demographic factors (the participation and dependency ratios), the highest among the rapid growers in Asia (table 1). China’s lower demographic contribution can be explained by the fact that a larger
FIGURE 3 Poverty and Inequalitya
Indonesia has fewer poor ... ... because it is more equal than China
a PPP = purchasing power parity.
Source: World Bank (2006a, 2006b); Hill (2000: 199).
0 5 10 15 20 25 30 35
Years since reform take-off (China 1978; Indonesia 1966)
TABLE 1 Contribution to GDP Growth per Capita since Growth Take-off (% of output per capita growth)
Output per
economies (NIEs) 100 84 3 13
China 100 90 –1 10
India 100 100 –10 10
Indonesia 100 81 8 11
Sources: IMF (2006) and authors’ calculations for China and Indonesia based on World Development Indicators (WDI), National Bureau of Statistics of China (NBS) and Indonesian central statistics agency (BPS) data.
cBIEAug07.indb 175
cBIEAug07.indb 175 27/6/07 5:33:33 PM27/6/07 5:33:33 PM
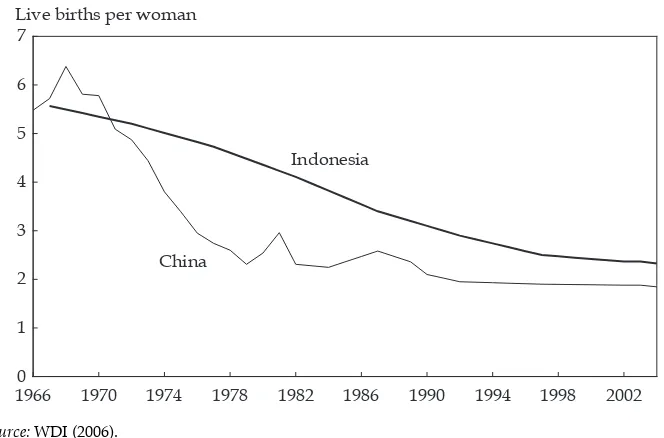
part of its demographic transition was already completed before reforms took off (fi gure 4), as a result of the population policy initiated in the early 1970s—well before the much-discussed one-child policy was introduced at the end of the dec-ade. Indonesia started a more active population policy only after reforms began, so its effects were fully registered within the reform period. While demographics in China accounted for about 10% of output growth per capita, during the fi rst decade of reform their contribution was almost one-sixth.
Labour productivity growth is due to increased human capital, increased phys-ical capital per worker, and growth in total factor productivity (TFP, a measure of the overall effi ciency with which an economy uses capital and labour). Physi-cal capital accumulation provided the largest contribution to labour productiv-ity growth in both Indonesia (about 60%) and China (55%). Contributions from human capital (measured as average years of schooling in the labour force) are small for both countries—9% for Indonesia and 5% for China. Both countries show a considerable contribution of TFP to labour productivity growth throughout the reform period; TFP growth accounts for a respectable one-third of labour pro-ductivity growth in Indonesia, and a remarkable 40% in China. Over the whole reform period, TFP growth contributed 3.0 percentage points to growth in China; the reduction to a 2.2% contribution in the most recent decade may be related to slowing growth following the Asian crisis (table 2).
The fairly even TFP growth pattern over the reform period refl ects not only China’s consistent growth performance but also its more gradual reform process. Indonesia’s record on TFP is more mixed, but was still remarkably solid, espe-cially in the fi rst decade of the New Order and after the 1986 reforms in trade and industrial policies. In between, when reforms were reversed and trade and industrial policies turned inward, TFP growth was very modest, and GDP growth relied most on capital accumulation fi nanced from abundant oil revenues. In the
19660 1970 1974 1978 1982 1986 1990 1994 1998 2002 1
2 3 4 5 6 7
Indonesia
China Live births per woman
Source: WDI (2006).
FIGURE 4 Rapid Decline in Fertility Rates
cBIEAug07.indb 176
cBIEAug07.indb 176 27/6/07 5:33:34 PM27/6/07 5:33:34 PM
years after the crisis, which on net showed virtually no growth in GDP per cap-ita, Indonesia’s TFP performance was dismal. In part, this can be explained by excess capacity created in the pre-crisis boom years standing idle as demand fell. Between 2001 and 2004, Indonesia’s TFP growth matches that of China, with a 2.2 percentage point contribution to growth.
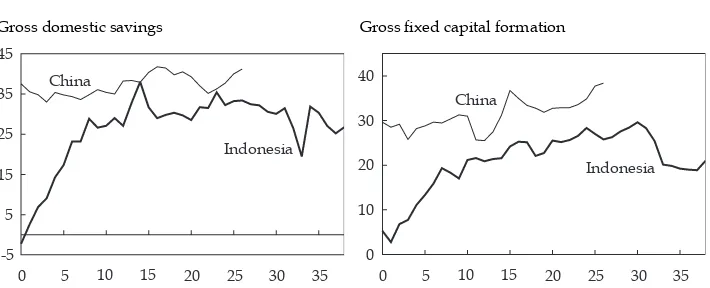
The ratio of investment to GDP has been consistently higher in China (fi gure 5). Driven by high domestic savings, China was already investing a great deal before the reforms: on average gross fi xed capital formation was above 30% of GDP, with a rising trend throughout the reform period. Indonesia’s investment (and sav-ings) rate rose rapidly after stabilisation in the 1960s, and continued to increase until the sharp drop after the crisis.
TABLE 2 Contribution of TFP per Decade since Growth Take-off (percentage point growth)
Decade 1 Decade 2 Decade 3 Decade 4
Japan 2.31 0.39 0.20
NIEs 1.05 1.49 2.33 0.85
Chinaa 3.30 3.40 2.20 NA
India 1.52 1.50 3.17 NA
Indonesiaa 2.79 0.23 2.20 –1.20
a For China and Indonesia, TFP is estimated assuming an initial capital–output ratio of 1.1 (1960 for Indonesia, 1965 for China), and a depreciation rate of 4%. The capital share for Indonesia is taken to be 0.35—equal to the IMF (2006) estimate for other countries; for China it is 0.5, following Kuijs and Wang (2005). NA = not applicable.
Sources: As for table 1.
FIGURE 5 Savings and Investment (% of GDP)
Gross domestic savings Gross fi xed capital formation
Source: WDI (2006).
0 5 10 15 20 25 30 35
-5 5 15 25 35 45
China
Indonesia
0 5 10 15 20 25 30 35
0 10 20 30 40
China
Indonesia
Years since reform take-off (China 1978; Indonesia 1966)
cBIEAug07.indb 177
cBIEAug07.indb 177 27/6/07 5:33:34 PM27/6/07 5:33:34 PM
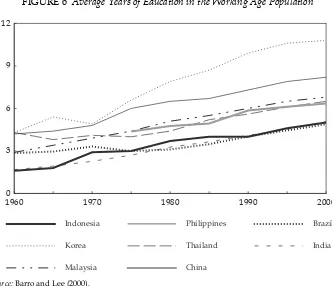
The contribution of human capital to GDP growth in China (0.4 percentage points) was similar to that in Indonesia (0.3 percentage points), but was unre-markable compared with that of other rapid growers in the region, and especially of stellar performers such as Korea, which rapidly expanded secondary and terti-ary education from the late sixties onward (fi gure 6). This is no surprise—both countries are only just approaching Korea’s early 1970s per capita income. Indo-nesia’s rapid expansion of the education system in the 1970s accelerated the accu-mulation of human capital among workers, but this acceleration levelled off in the 1980s and 1990s. China, which started its reforms with relatively high human capital for its level of income, followed a similar trend to Indonesia through the reform period up to the year 2000 (Barro and Lee 2000). In recent years, China has rapidly expanded tertiary education, tripling cohort enrolments over the last decade; this should pay off in terms of future contribution to growth, but in the transition phase unemployment among young graduates is high.
Sectoral shifts in the economy, opening up to trade and competition, changes in the ownership structure of the economy, and urbanisation are all factors that can account for the considerable contribution of TFP to per capita GDP growth in both countries. Both countries experienced a sharp relative decline in agriculture over the reform period, but while China’s share of industry in GDP was already high in 1978, Indonesia’s reform period saw a rapid expansion of the sector (fi gure 7). For China, on net, the sectoral shift took place more from agriculture to services, which had been suppressed under the command economy and still lags behind what could be expected for an economy with China’s per capita income.
FIGURE 6 Average Years of Education in the Working Age Population
Source: Barro and Lee (2000).
1960 1970 1980 1990 2000
0 3 6 9 12
Indonesia
Korea
Malaysia
Philippines
Thailand
China
Brazil
India
cBIEAug07.indb 178
cBIEAug07.indb 178 27/6/07 5:33:34 PM27/6/07 5:33:34 PM
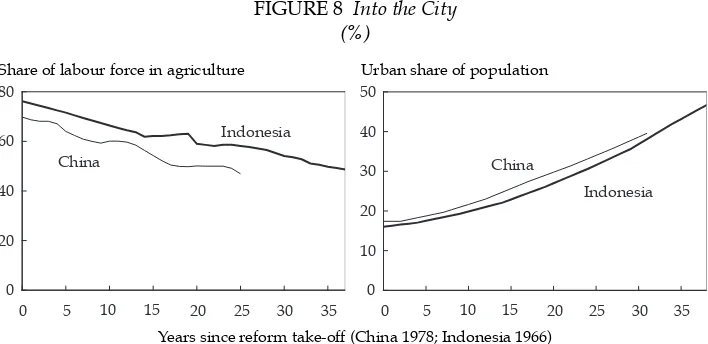
In both countries the share of agriculture in the labour force declined precipi-tously (fi gure 8), raising the overall productivity of the economy. This accompanied rapid urbanisation in both countries, which is remarkable especially for China, given the household registration system, which discouraged rural residents from moving to the city, and the one-child policy, which is better enforced in the cities than in the countryside. Despite these policies discouraging migration, China urbanised as rapidly as Indonesia (fi gure 8). Given its large fl oating population (estimated at some 150 million people or 12% of the population), China’s urbanisation is prob-ably higher than Indonesia’s, and more consistent with China’s per capita income. Besides migration and natural population growth in the cities, reclassifi cation of rural areas into urban ones plays a signifi cant role: in China, about one-third of urbanisation is due to this phenomenon (Biller 2006), and estimates suggest an even higher fi gure for Indonesia (World Bank 2006b: 92).
FIGURE 8 Into the City (%)
Share of labour force in agriculture Urban share of population
Source: WDI (agricultural labour based on FAO data); authors’ estimates. Chinese data for urban pop-ulation are based on household registration, not actual place of residence.
0 5 10 15 20 25 30 35
Years since reform take-off (China 1978; Indonesia 1966)
1966 1971 1976 1981 1986 1991 1996 2001 0
1978 1983 1988 1993 1998 2003 0
Years since reform take-off (China 1978; Indonesia 1966)
cBIEAug07.indb 179
cBIEAug07.indb 179 27/6/07 5:33:35 PM27/6/07 5:33:35 PM
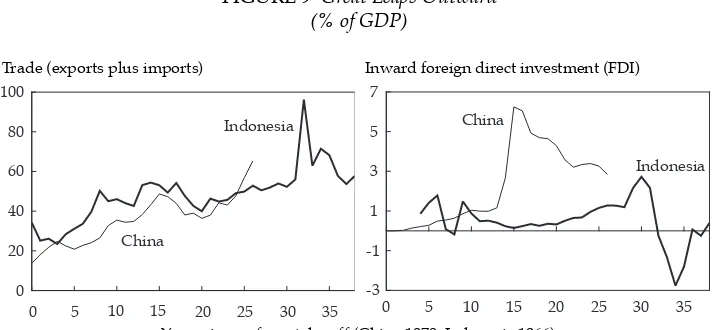
A second major structural change in both countries is the opening of the econ-omy (fi gure 9). China, with trade approaching 65% of GDP, is now exceptionally open for a country of its size. Indonesia’s exports in the 1960s and 1970s were dominated by oil, other natural resources and agriculture, but this changed after the reforms of the early and mid-1980s, and manufacturing’s share of merchan-dise exports jumped from barely 3% of total exports in 1980 to some 56% by 2004. China had already achieved that level by the mid-1980s, and its share of manufac-turing in merchandise exports is now more than 90%. Indonesia’s trade as a share of GDP peaked in the aftermath of the crisis, owing to the sharp depreciation of the real exchange rate in 1998, but then settled at levels not too different from those of China.
Indonesia was quick to adopt a very open capital account, and an active policy to promote foreign direct investment (FDI). By the early 1970s, FDI stood at some 2% of GDP, unprecedented for the time.5 After the 1974 Malari incident, when anti-FDI
protests greeted Japanese Prime Minister Tanaka’s visit, enthusiasm for FDI waned, and the ratio of FDI to GDP did not reach 1970s levels again until the mid-1990s, only to reverse dramatically during the crisis years before making a hesitant recov-ery. FDI in China took off slowly, and was largely restricted to special economic zones (SEZs) until the early 1990s, after which Deng Xiaoping’s ‘Tour through the South’ triggered a sharp increase, with FDI peaking at 6.3% of GDP in 1993.6 Since
then its importance has subsided, although China’s entry into the World Trade Organization (WTO) in 2001 saw renewed enthusiasm for investing in the country.
5 Indonesia’s defi nition of FDI differs from the international standard in including over-seas bank loans to subsidiaries of foreign companies, which are usually included in ‘other capital fl ows’. This convention is the reason that Indonesia’s measured FDI turned nega-tive after the crisis.
6 A considerable share of China’s FDI is likely to consist of money from Chinese investors trying to take advantage of the incentives that foreign investors receive (so-called ‘round-tripping’, Zhao 2006).
FIGURE 9 Great Leaps Outward (% of GDP)
Trade (exports plus imports) Inward foreign direct investment (FDI)
Source: WDI (2006).
0 5 10 15 20 25 30 35
0 20 40 60 80 100
China
Indonesia
0 5 10 15 20 25 30 35
-3 -1 1 3 5 7
China
Indonesia
Years since reform take-off (China 1978; Indonesia 1966)
cBIEAug07.indb 180
cBIEAug07.indb 180 27/6/07 5:33:35 PM27/6/07 5:33:35 PM
DEVELOPMENT STRATEGIES7
The two countries’ focus on rapid growth from the start of reform was quite simi-lar. Some would argue that the political setting called for rapid growth as a key to the legitimacy of the regime. Deng Xiaoping’s ‘Development is the hard truth’ and Soeharto’s ‘Development yes, democracy no’ are remarkably alike in intent.8
Political circumstances differed quite sharply, though. Absence of political oppo-sition and dire economic conditions in 1966 were conducive to the rapid reforms and pragmatic economic policies implemented in the Soeharto era (Lankester 2004). In contrast, although the Gang of Four and the Cultural Revolution had discredited extreme ‘leftism’, China can hardly be said to have embraced the mar-ket from the start, and ideological debates lasted throughout the 1980s. Only in 1993 did the ‘socialist market economy’ become mainstream ideology, suggesting an end to the ideological debate over the direction of economic reform.
China
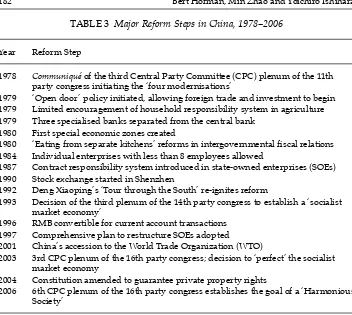
China’s reforms had their tentative beginnings after the death of Mao Zedong in 1976. In a diffi cult political environment, Deng Xiaoping’s 1978 ‘Truth from facts’ speech at the end of 1978 (Deng 1991) became the breakthrough for reform; it was followed by the Communiqué of the third plenary session of the 11th CCCPC, which laid out a tentative program of reform to move away from the planned economy (table 3). But reforms developed only gradually, starting in agriculture with the household responsibility system and township and village enterprises, and some hesitant steps to open up the economy to foreign trade and investment, which took off in earnest only in the 1990s. Equally gradual were the moves on state-owned enterprise (SOE) reform, which were much discussed throughout the 1980s, but gained momentum only in the mid-1990s. Before that, the policy was to encourage entry of new non-state enterprises, rather than privatisation of SOEs, and to improve SOE effi ciency through performance contracting and technological improvements rather than through retrenchment and privatisation.
In contrast with many of the former Soviet republics and Eastern Europe, Chi-na’s planning system itself was not abolished overnight. Instead, the economy was allowed to ‘grow out of the Plan’.9 Planning targets and material allocation grew
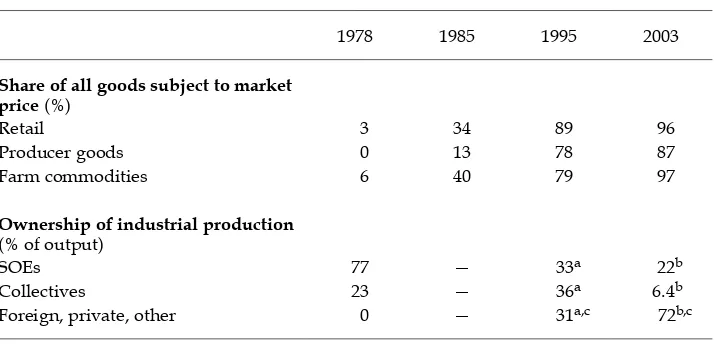
more slowly than the overall economy, while prices followed a dual track, one within the Plan and one outside of the Plan, until well into the 1990s (table 4). This preserved the level of production, while giving strong incentives to enterprises to grow and receive the outside-Plan prices. The fi ve-year plan still exists, although its
7 For Indonesia, extensive use is made here of Hill (1996, 2000); Hofman, Rodrick-Jones and Thee (2004); Timmer (2004); Schwarz (1994); and Booth and McCawley (1981). For China, key sources are World Bank (1981); Naughton (1995, 2006); Lin et al. (2003); Lardy (2003); Wu (2005); and Lou (1997).
8 However, for Deng, development was the focus of socialism, the fi rst stage of commu-nism, which was needed to create the material wealth required to enable communism. For Soeharto, development was the alternative to the democracy of the early days of the republic.
9 ‘Growing out of the Plan’ was a phrase originally coined by Barry Naughton in 1984 to describe the fact that within-Plan targets of output were almost fl at, while overall economy-wide targets showed a large increase (Naughton 1995).
cBIEAug07.indb 181
cBIEAug07.indb 181 27/6/07 5:33:35 PM27/6/07 5:33:35 PM
nature has fundamentally changed, and it can now best be considered a strategic plan for the government rather than a plan for the economy as a whole.
Financial sector reforms were initiated in 1979, but commercialisation of the banks only started in earnest after 2000, in part because commercialisation proved impossible as long as unreformed SOEs needed fi nancial sector support to per-form their social functions, including provision of jobs, housing, health and edu-cation services.
‘Feeling the stones in crossing the river’ became China’s mode of economic reform, implementing partial reforms in an experimental manner, often in a few regions, and expanding them upon proven success. Only with the 1993 Decisions on the Establishment of a Socialist Market Economy did a broader overall strategy emerge; it too was implemented gradually and experimentally rather than com-prehensively. There were several reasons for this approach. First, gradualism was a means to circumvent political resistance against reforms (Wu 2005). Second, gradual, experimental reform was a pragmatic approach in a heavily distorted environment in which ‘fi rst best’ solutions were unlikely to apply. Experimental reforms, confi ned to specifi c regions or sectors, allowed the authorities to gather information on effects that could not be analysed in advance. They were also nec-essary to develop and test the administrative procedures and complementary pol-icies needed to implement the reforms. With proven success the experiment could
TABLE 3 Major Reform Steps in China, 1978–2006
Year Reform Step
1978 Communiqué of the third Central Party Committee (CPC) plenum of the 11th party congress initiating the ‘four modernisations’
1979 ‘Open door’ policy initiated, allowing foreign trade and investment to begin 1979 Limited encouragement of household responsibility system in agriculture 1979 Three specialised banks separated from the central bank
1980 First special economic zones created
1980 ‘Eating from separate kitchens’ reforms in intergovernmental fi scal relations 1984 Individual enterprises with less than 8 employees allowed
1987 Contract responsibility system introduced in state-owned enterprises (SOEs) 1990 Stock exchange started in Shenzhen
1992 Deng Xiaoping’s ‘Tour through the South’ re-ignites reform
1993 Decision of the third plenum of the 14th party congress to establish a ‘socialist market economy’
1996 RMB convertible for current account transactions 1997 Comprehensive plan to restructure SOEs adopted 2001 China’s accession to the World Trade Organization (WTO)
2003 3rd CPC plenum of the 16th party congress; decision to ‘perfect’ the socialist market economy
2004 Constitution amended to guarantee private property rights
2006 6th CPC plenum of the 16th party congress establishes the goal of a ‘Harmonious Society’
Sources: Wu (2005); Naughton (1995); Zhao (2006); and Zheng and Wang (2006).
cBIEAug07.indb 182
cBIEAug07.indb 182 27/6/07 5:33:36 PM27/6/07 5:33:36 PM
be expanded to other regions and sectors. Third, experimental reform may have suited the Chinese culture well as a means to avoid ‘loss of face’: if an experiment did not work, it could be abandoned as an experiment, rather than considered a policy failure.
Combined with decentralisation to local government of ownership, plan allocation, investment approvals and other decision making powers after 1980, the experimental approach to reform became a powerful tool for progress: within the confi nes of central political guidance from the China Communist Party (CCP), provinces, municipalities and even counties could experiment with reforms in specifi c areas, and successful experiments then became offi cial policy and were quickly adopted throughout the county.
Administrative and fi scal decentralisation distributed the benefi ts of reforms to a fairly large part of the population as well as to local government and party offi -cials, who therefore had strong incentives to pursue growth and promote a mar-ket economy (Qian and Weingast 1997). On the administrative side, investment approval and detailed implementation of central policies was left largely to local governments. On the fi scal side, the tax contracting system gave a large share of the marginal revenues to local governments, topped up with ‘extra-budgetary funds’ they raised themselves, giving local governments wide discretion over the use of funds. Even the fi nancial sector, through the local branches of the state banks and the central bank, was under the partial control of local offi cials, who could direct lending towards government-favoured projects and industries. Taken together, this environment provided a strong incentive for growth. A disadvantage was imperfect macroeconomic control and repeated bouts of infl ation driven by local government loosening of investment and credit controls. Further, these conditions gave rise to
TABLE 4 China: Growing Out of the Plan
1978 1985 1995 2003
Share of all goods subject to market price (%)
Retail 3 34 89 96
Producer goods 0 13 78 87
Farm commodities 6 40 79 97
Ownership of industrial production (% of output)
SOEs 77 — 33a 22b
Collectives 23 — 36a 6.4b
Foreign, private, other 0 — 31a,c 72b,c
a 1996.
b 2004.
c The private share in investment is much smaller than that in production, as state enterprises con-tinue to do more than 50% of investment.
Sources: Naughton (2006); OECD (2005); China Statistical Yearbook, various years.
cBIEAug07.indb 183
cBIEAug07.indb 183 27/6/07 5:33:36 PM27/6/07 5:33:36 PM
local protectionism, which threatened to undermine China’s unifi ed market and competition among domestic fi rms. When in 1992 reforms regained momentum lost after the 1989 Tiananmen Square events, and infl ation re-emerged, the agenda became one of centralisation of policies, with major effects on macroeconomic con-ditions. The fi scal and fi nancial reforms that followed were aimed at creating the tools for macroeconomic management in a market economy.
Why did gradual reform work in China while it failed in most other former Soviet republics and Eastern Europe? Indeed, as others have pointed out,10
grad-ual reform of the planning system is likely to fail because reforms lack credibility, undermining positive responses to them by economic actors, and because rent-seeking occurs in a semi-reformed system. This did not happen in China—at least not to an extent that led reform to fail—for several reasons: the strong commit-ment to reform expressed by China’s leadership; a gradual improvecommit-ment in the legal framework to protect private investment and property; and at times forceful action against corruption.
Deng Xiaoping’s 1984 statements that reforms and opening up were to last for at least 50–70 years11 and his 1992 ‘Development is the hard truth’ are good
exam-ples of strong commitment to reform. This and consistency in reform actions at least in part substituted for the formal trappings of a market economy. More tangi-ble were the rewards that offi cials within the party system received for delivering on key reform goals: growth, attracting FDI, creating employment, and maintain-ing social stability (apart from meetmaintain-ing targets on population control). Changes introduced in the 1980s to the rules of succession in party and state also helped to avoid political disruption—with the exception of the Tiananmen Square events (Keefer 2007). More recently, changes in the party constitution that refl ect former President Jiang Zemin’s ‘Three represents’, which opened up party membership for entrepreneurs, solidifi ed the position of the non-state economy. Increasingly, the legal system included protection of property rights: the 1979 Law on Foreign Joint Venture Enterprises (JVEs) stipulated that the state shall not nation-alise or expropriate joint ventures; the 1994 company law explicitly recognised private companies. But it was not until 1997 that the CCP recognised the role of private enterprises as being a useful force in the ‘early phase of socialism’, and not until 2004 that private property gained equal status with state property in China’s constitution. The property law passed in March 2007 establishes equal protection under the law for all ownership forms.
Finally, the often stern action against corruption probably limited opportun-istic behaviour by insiders who could have abused the semi-reformed system. The numbers show that corruption was far from absent. Nevertheless, the con-siderable resources invested in the state and party apparatus and the numerous cases brought before the party’s disciplinary committee or prosecuted by the state procurator—even at the highest levels—suggest a seriousness in fi ghting cor-ruption that is often lacking in one-party dominated states. Within the party, the
10 See World Bank (1996) for an overview of the arguments. Roland (2000) derives more formal models of transition that suggest gradualism may have lower uncertainty and re-versal costs than ‘Big Bang’ reforms.
11 See, for instance, Deng Xiao Ping, ‘Our magnifi cent goals and basic policies’, in Deng (1994).
cBIEAug07.indb 184
cBIEAug07.indb 184 27/6/07 5:33:36 PM27/6/07 5:33:36 PM
Organisational Bureau is responsible for day-to-day monitoring of party member behaviour and the party disciplinary committee punishes abuse of power, party indiscipline or corruption. Within the government, the Ministry for Supervision, supported by supervision departments in every agency, investigates allegations of corruption and imposes administrative sanctions, whereas the state procurator is responsible for criminal investigations. The Supreme People’s Procurator is the country’s highest anti-corruption body. In 2005, 41,449 government employees (0.1% of the total) were probed by the procurator’s offi ces for corruption and der-eliction of duty; of these, 30,205 were brought to court.12
China’s gradual strategy probably reinforced the credibility of reform. By mak-ing reforms one step at a time, and startmak-ing with those most likely to deliver results, the government built up its reputation for delivering on reform. With every suc-cessful reform, the likelihood that the next one would be a success undoubtedly increased.
Indonesia
Indonesia followed a very different path to reform. From its onset in 1966, reform progressed in several waves of rather radical measures, followed by periods of par-tial back-tracking (table 5). Reform opportunities occurred predominantly in times of economic crisis, such as the aftermath of Soekarno’s failed ‘Ekonomi Terpimpin (Guided Economy)’, the state oil company Pertamina’s foreign debt crisis of 1975 and the sharp drop in oil prices in the 1980s. In between, ambitious industrial policies and protectionism emerged. Hill (1996) aptly characterised Indonesia’s economic policies as ‘good policies in bad times’. Early reforms emphasised rural development and food self-suffi ciency, and were highly successful. The govern-ment maintained its focus on macroeconomic stability throughout, and built some strong macroeconomic policy institutions to do so. In times of macroeconomic diffi culty, the microeconomic policies pursued were largely aimed at liberalisa-tion—which was duly rewarded with renewed growth. But microeconomic poli-cies deteriorated in times of relative stability. On the one hand, they were under threat from the heavy industry lobby and later the ‘technologists’ who aimed for rapid state-led technological development. On the other, especially since the early 1990s, the threat to good policies came increasingly from the crony capitalism of the fi rst family and its affi liates. A liberalised but lightly supervised fi nancial sec-tor fed the boom in the early 1990s, while efforts to tighten domestic monetary policy resulted in a rapid increase in corporate external debt. When contagion from the Thai baht depreciation hit Indonesia in 1997, and Soeharto was seen to be reneging on Indonesia’s letter of intent to the IMF, policies that had worked well in previous crises (depreciation, sharp tightening of monetary policy, fi scal retrenchment, structural reform) no longer did.
What had changed by the 1990s were the complexity of the economy, the exter-nal environment and the nature of the Soeharto regime. The reforms of the 1980s had made Indonesia a much more diversifi ed, private sector-led economy with a rapidly developing fi nancial sector in need of a strong legal system and strong supervisory institutions. Both were lacking. The surge in international capital fl ows had made two cornerstones of macroeconomic policy less appropriate for
12 Jia Chunwang, procurator-general, in his 2006 work report to the parliament.
cBIEAug07.indb 185
cBIEAug07.indb 185 27/6/07 5:33:37 PM27/6/07 5:33:37 PM
TABLE 5 Major Reform Steps in Indonesia, 1966–2004
Year Reform Step
1966 Soekarno hands power to Soeharto; Economic Stabilisation and Rehabilitation plan; fi rst Paris Club rescheduling
1967 Foreign investment law; Indonesia co-founds ASEAN
1968 Soeharto sworn in as president; central bank law; foreign banks allowed 1969 First Five-year Development Plan
1970 ‘Commission of Four’ against corruption appointed. Removal of foreign capital and exchange controls, exchange rate unifi ed, 2nd Paris Club agreement 1973 First OPEC oil price hike
1974 Malari riots against foreign investment during Japan Prime Minister Tanaka’s visit
1975 Pertamina crisis (state oil company unable to meet its foreign debt obligations) 1977 Jakarta Stock Exchange opens
1978 Devaluation of the rupiah by 50% against the dollar 1979 Second OPEC oil price hike
1983 Budgetary retrenchment; devaluation of rupiah by 38.5%; elimination of bank credit ceilings; VAT, global income tax introduced
1985 Soeharto honoured for Indonesia’s achievement of food self-suffi ciency; transfer of most customs functions to Swiss fi rm SGS (Société Générale de Surveillance) 1986 Pakem (6 May 1986 package) reforms include simpler investment approvals,
more liberal foreign ownership, a duty exemption and drawback scheme. Devaluation of rupiah by 45%
1987 ‘Sumarlin shock’: banks required to buy back SBPUs (money market securities); state-owned enterprises required to put deposits at central bank
1988 Pakto (October package) major banking reform and deregulation. Pakdes (December package) II: NBFIs (non-bank fi nancial institutions) authorised and regulated; foreign ownership in securities companies allowed; state-owned investment bank Danareksa’s privileges limited
1990 Bank Duta crisis; normalisation of relations with China
1991 Pakfeb (February package): tighter banking supervision measures issued; loan team established to limit overseas borrowing of state-owned fi rms; Bank Summa collapse
1992 Banking law enacted; Intergovernmental Group on Indonesia (IGGI) abolished 1993 Prudential regulations on banks relaxed; central bank head of supervision fi red 1994 New investment law allows 100% foreign-owned companies; new Tariff and
Fiscal Team imposes ‘surcharge’ on imports 1995 Company law, capital markets law approved
1996 Customs takes back duties from SGS; ASEAN Free Trade Area (AFTA) tariff reduction schedule announced
1997 Rupiah fl oated; fi rst IMF-supported program
1998 Indonesian Bank Restructuring Agency (IBRA) established; Soeharto resigns; new banking law passed (Law 10/98)
2001 Decentralisation law implemented
2002 Law on anti-corruption commission passed
2003 State fi nances law passed (Law 17/2003); graduation from IMF-supported program
2004 Closure of IBRA
Source: Hofman, Rodrick-Jones and Thee (2004).
cBIEAug07.indb 186
cBIEAug07.indb 186 27/6/07 5:33:37 PM27/6/07 5:33:37 PM
the times: the managed exchange rate combined with an open capital account gave fi rms strong incentives to borrow abroad and left the currency and the economy vulnerable to speculative attacks. But perhaps most important was the change in the nature of the regime, which had become increasingly prone to corruption. This undermined its legitimacy and, in turn, the credibility of its policies. Weak governance coloured the perception of how Indonesia would manage the crisis, and this lack of confi dence appears to be the main reason why Indonesia was hit harder than other countries affected by the Asian crisis. Or, as Boediono (2005: 321) puts it: ‘The crisis brought not only an acute awareness of how treacherous it can be to live in an interconnected world, but also a growing realisation that insti-tutions of society and the way they are run (governance) matter a great deal ...’.
Following the crisis, reformasi began to build institutions that put effective checks on power. There has been remarkable progress over a short period, includ-ing direct elections for president, governors and mayors; decentralisation of power to over 400 local governments; creation of a host of new oversight institu-tions, including an anti-corruption commission; and introduction of an extensive legal framework for better management of state fi nances. Meanwhile a vibrant civil society and unfettered media have emerged. Many of the new institutions have teething problems, but they promise to become a solid institutional basis for Indonesia’s future development.
MAJOR POLICY AREAS Macroeconomic policy
From the onset of reform, macroeconomic stability was a key issue for both coun-tries. Indonesia was tainted by the hyperinfl ation of the latter Soekarno days, while China’s memories of the Guomindang regime’s demise amid high infl a-tion were still vivid. Indonesia was prone to macroeconomic shocks because of its commodity dependence in the fi rst decades of reform, whereas China repeatedly experienced bouts of overheating and infl ation due to local governments’ drive for investment and growth.
China’s economy showed a pattern of fl uctuating economic growth and infl a-tion throughout the 1980s and 1990s. Each wave of reform was taken as a signal by local governments to reduce controls over enterprises and credit. State enter-prises could at fi rst obtain easy credit from the state banking system, and were little concerned about profi ts and losses—a soft budget constraint like the one found in other transition countries. Macroeconomic management was therefore more a matter of accelerating or slowing reforms and decentralisation of invest-ment approvals, rather than one of using ‘modern’ tools of indirect aggregate demand management. Monetary policy started to play a role in macroeconomic management only after the mid-1990s when the central bank law was passed. Until then, local governments’ infl uence on monetary expansion was large. Local branches of the central bank were in charge of part of the credit plan, which was often overtaken by local or central leaders’ desire to fi nance favourite projects from state bank credit; this in turn was refi nanced by the central bank (Hof-man 1993). Expansionary periods were followed by periods of macroeconomic retrenchment, which were largely managed through the planning system, notably the fi xed investment plan. Monetary policy played only a minor role in managing
cBIEAug07.indb 187
cBIEAug07.indb 187 27/6/07 5:33:37 PM27/6/07 5:33:37 PM
demand, and interest rates remained controlled well after 2000. But even a more fl exible interest policy probably would have failed to control investment demand in the presence of state enterprises that were little concerned with the ‘bottom line’. Changes in deposit interest rates were used on occasion, though, to reduce consumer demand by luring deposits into the banking system.
Fiscal policy played a limited role in the fi rst decades of reform, as it had in the socialist planning period. Gradual price liberalisation, combined with entry of non-state enterprises, had eroded the monopoly profi ts of SOEs and with them the traditional tax base. The intergovernmental fi scal system had given strong incen-tives for local governments to grow, but had also undermined the central gov-ernment’s share of revenue. By the mid-1990s general government revenues had fallen to 10% of GDP, down from more than 30% in 1978, and the central govern-ment share of these revenues was below 30%. Meanwhile, extra-budgetary funds had become as large as budgetary funds, and although offi cial budget defi cits remained small, quasi-fi scal operations through the banking system amounted to some 5–7% of GDP in the early 1990s. At that time, China would have been highly vulnerable to a fi nancial crisis were it not for its closed capital account.
Since the 1993 Decisions of the CCCPC on Establishing the Socialist Market Econ-omy, China has gradually developed the instruments of modern macroeconomic management. The central bank law and the reorganisation of the central bank sys-tem recentralised control over monetary policy. The establishment of three bond-fi nanced policy banks reduced the need for the central bank to fi nance policy loans with base money creation. And more rapid SOE reforms in the late 1990s reduced the need for banks to continue to fi nance loss-making state enterprises. The 1994 reforms in the fi scal system, which included a VAT and a tax-sharing system to replace tax contracting (Lou 1997), gradually increased the share of government revenues in GDP (to some 19% in 2006), and the central government share of those revenues from less than 30% in 1994 to almost 60% in 2006. The creation of a government bonds market also allowed the government to pursue a more active fi scal policy and seek non-infl ationary means of fi nancing the defi cit.13 This proved useful in mobilising a fi scal stimulus in the aftermath of the Asian crisis, which did not hit China directly but lowered growth signifi cantly in 1998 and 1999. Meanwhile, monetary policy gained in importance through the gradual lib-eralisation of interest rates, starting with the interbank rate in the mid-1990s and a gradual liberalisation in lending rates. Nowadays, lending rates in urban areas are liberalised above the minimum rate set by the central bank, while restrictions remain in rural areas, where interest rates are capped, as are deposit rates, in part to avoid the weakest banks attracting most deposits.
Despite progress in creating indirect tools of macroeconomic management, China still has to rely on the administrative system to manage demand. A key rea-son for this is its exchange rate policy which, after unifi cation of the exchange rate in 1993, remains a tightly managed fl oat with only limited fl exibility and, some would argue, an undervalued exchange rate. The consequence is that monetary policy remains partially determined by balance of payments surpluses. Since the
13 China had issued government bonds to fi nance the defi cit since the early 1980s. How-ever, this often took the form of forced placement of bonds with banks, and even with individual state enterprise employees and civil servants.
cBIEAug07.indb 188
cBIEAug07.indb 188 27/6/07 5:33:38 PM27/6/07 5:33:38 PM
early 2000s, these surpluses have risen steadily, and abundant domestic liquid-ity has fed an investment boom. In recent years the authorities have taken sev-eral administrative measures to control investment demand, and have provided banks with ‘guidance’ to contain lending.
Indonesia’s macro-management has relied on more familiar indirect tools. It used exchange rate, fi scal and monetary policies to reduce absorption in times of excess demand. But in doing so, the country employed some highly unusual methods, and created new institutions that lent credibility to its policies. Dur-ing the 1966–69 stabilisation period, several core institutions of economic man-agement were established that lasted throughout the New Order, including an open capital account, a competitive exchange rate and a balanced budget rule. The balanced budget rule and the open capital account de facto externalised the budget constraint, which served the country well in limiting excess demand. The exchange arrangement not only assured foreign investors that they would be able to repatriate their earnings, but also imposed a discipline on the government’s macroeconomic policies. After Pertamina’s 1975 foreign debt crisis and the drop in oil prices in 1981 and 1986, fi scal adjustments were used to control aggregate demand, usually on the spending side. In 1983, control of demand was achieved by means of major tax reforms that raised non-oil revenues. Monetary policy played its role from time to time, most famously with the 1987 ‘Sumarlin shock’ (named for the fi nance minister who implemented it), which engineered a sharp monetary tightening by moving SOE deposits to the central bank.
Indonesia is best known for its use of the exchange rate as a macro tool. The reg-ular, radical depreciations that it used to adjust absorption and restore competitive-ness are a remarkable feature of Indonesia’s economic management. Unlike other countries that resisted such measures until considerable loss of foreign reserves had occurred, Indonesia used this tool in a timely manner, even preventively. Woo, Glassburner and Nasution (1994) point out the important role the exchange rate played in Indonesia’s macroeconomic policy mix, as well as the benefi cial effects depreciation had on income distribution. Exchange rate policies also helped Indo-nesia avoid the ‘Dutch disease’ to which other resource- dependent economies were prone. Investments in infrastructure and agriculture fi nanced from oil receipts played a part in this as well, as did subsidised energy for industry, which became fi scally unsustainable once the oil balance deteriorated.
Agricultural policies
Agricultural policies were central to the agenda from the start of reform in China and Indonesia alike. In China, agriculture formed the fi rst stage of the reform process, whereas in Indonesia, the rehabilitation part of the stabilisation and rehabilitation policies focused on agricultural facilities such as irrigation systems and rural roads. Starting from different bases, China and Indonesia both managed to increase agricultural production sharply, and much of this was achieved through better agricultural policies and pricing, although input and output subsidies and trade protection also contributed.
China’s agricultural policies were traditionally aimed at taxing agriculture to fund rapid industrial development, and collectivisation in the 1950s had elim-inated individual land holding. China’s reforms took off with two fundamen-tal changes in agricultural policy—one planned, and one emerging from local
cBIEAug07.indb 189
cBIEAug07.indb 189 27/6/07 5:33:38 PM27/6/07 5:33:38 PM
initiatives (Du 1989). The Decisions of the 3rd Plenum of the 11th CCCPC at the end of 1978 increased procurement prices for several agricultural products, including rice, and reduced the mandatory state grain procurement quotas in order to grant collectives more autonomy in managing their affairs. At the same time, however, the Decisions explicitly condemned individual farming (Naughton 2006: 241). Yet experiments with the household responsibility system (HRS) were already taking place in several provinces, notably Anhui and Sichuan; these rewarded individual households on the basis of their output, rather than on their inputs as had been the case under the collective system. By 1980 the HRS had expanded from remote areas to all areas with food shortages. In 1981 the policy became the offi cial line and by the end of 1982 more than 90% of agricultural households were subject to some form of contracting. Land leases emerged during the same period, starting with three-year terms, then fi ve, and ultimately up to 30-year leases that steadily shifted land user rights from the collectives to the farmer. The results of the new policy were dramatic, with grain output increasing by one-third in the period 1979–84, and steadily rising thereafter. Even more remarkably, other crops like cotton and oilseeds, and meat production, expanded more rapidly still (Naughton 2006: 242) as households diversifi ed away from rice, while, as shown above, the share of the labour force in agriculture rapidly declined.
The rapid productivity increases in agriculture were due not only to the changed incentive system brought about by the HRS. Increases in yield per hec-tare of grain crops were, as in Indonesia, also due to higher fertiliser use and rapid mechanisation, which resulted from the sprawling rural industry that emerged after the reforms. By 1978, China had already introduced the hybrid rice of the green revolution, and had expanded its irrigation network, but the HRS and rural industrialisation allowed better use of it. From the mid-1980s, government was still concerned about agricultural development for reasons of food security, but also for reasons of income distribution. As off-farm and urban incomes started to outpace agricultural incomes, the government gradually increased procure-ment prices for grain. In the mid-1990s, food security policies boosted grain pro-curement prices further, but by the early 2000s WTO entry had reduced many of the tariffs that protected agricultural goods (although quota protection of grain remains). Further, as planting policies relaxed, grain production came under pres-sure from diversifi cation toward non-grain crops with higher value added. In reaction, the government began a program of grain production subsidies in 2003. More importantly for rural incomes, the agricultural tax and many rural fees for government services were abolished in 2004/05.
In its First Five-Year Development Plan (1969/70–1973/74), Indonesia gave fi rst priority to agricultural development in general. In practice, agricultural pol-icy was focused on self-suffi ciency in rice. Because of the large share rice had in Indonesians’ diet, its price and availability were crucial to maintaining both price stability and political stability. Hence, food policy during this period was effectively rice policy. New rice varieties, investment in irrigation and other rural infrastructure, agricultural extension, subsidised fi nance and price stabilisation through the food logistics agency, Bulog, became the main tools for achieving self-suffi ciency.
From virtually zero in the mid-1960s, the use of high-yielding rice varieties had reached 85% by the mid-1980s. Extensive government investment in irrigation
cBIEAug07.indb 190
cBIEAug07.indb 190 27/6/07 5:33:38 PM27/6/07 5:33:38 PM
fi nanced from vastly increased oil revenues, and higher education standards, facilitated area expansion and rice intensifi cation. These investments allowed for increases in the farm-gate prices without undue consumer price rises. Investment in physical infrastructure, in part fi nanced by the successful Inpres Desa grants to villages, was complemented by development of public sector institutions that provided the rice economy with fi nancial, marketing and extension services. These served as important links between expanding production possibilities and improved physical infrastructure by providing the fi nancial and educational pre-requisites for technological innovation (Tabor 1992: 173 –4). Bulog was charged with defending the rice fl oor price through government purchases, and with sta-bilising the consumer price by marketing stored or imported rice when prices rose too sharply. Carrying out these tasks required large and continuing subsidies from the government budget and through the credit system, but the verdict is that Bulog was successful in maintaining appropriate rice prices (Pearson and Monke 1991: 2 –3), although in later years the organisation became increasingly prone to corruption.
Trade and investment policies
Both countries started their reforms with very limited interaction with the inter-national economy, but became very open economies in the course of reform. Indeed for China, ‘opening up’ was central to reforms, and Geige Kaifang (Open-ing Up and Reform) became the shorthand for China’s reform experiment. China opened up in its characteristic gradual manner—over time and across geographi-cal space—while Indonesia did so in leaps and bounds when the opportunity arose. Each came up with its own successful innovations in opening up—China with its successful SEZs, and Indonesia with radical steps in customs reform and trade taxes. International commitments, Indonesia through early membership of the General Agreement of Tariffs and Trade (GATT) in the mid-1980s, and China through its protracted negotiations for WTO membership, were used to push through the necessary domestic reforms. And both used an active exchange rate policy to maintain their competitiveness while making trade reforms more palat-able for those set to lose from reduced protection.
Until 1978, China was practically a closed economy, with very limited trade and fi nancial interaction with the rest of the world, and with self-suffi ciency as a proclaimed policy goal. This situation had only started to change, at a glacial pace, after Nixon’s visit to China in the early 1970s. The economic reform ini-tiated in 1978 brought rapid change, and over the last two and a half decades China has become one of the most open countries in the world. China’s degree of openness is rare among economies with population or GDP of similar size. It has also been very successful in attracting FDI: China received about a quarter of all FDI to developing countries between 2001 and 2005 and a record $60.6 billion in 2004, some 9.9% of total global FDI. The reforms that achieved this included: (i) gradual liberalisation of the trade planning system; (ii) gradual reforms in the foreign exchange and payments system; and (iii) opening up to FDI.
Before reform, foreign trade was part of the Plan, and was conducted through 12 foreign trade companies (FTCs) which had a monopoly on trade and could procure and sell goods for export and import at planned prices. With the start of reform, these FTCs gradually lost their monopoly on foreign trade because their
cBIEAug07.indb 191
cBIEAug07.indb 191 27/6/07 5:33:39 PM27/6/07 5:33:39 PM
numbers were increased (by 1986 there were 1,200 FTCs) and because of the SEZs, which allowed foreign-invested companies to trade completely outside the Plan (World Bank 1994: 26). The foreign trade monopoly of the FTCs was abolished in the mid-1990s.
Tariff reduction played a minor role in trade liberalisation during the fi rst 15 years. Average tariffs had only dropped from 56% in the early 1980s to 43% in 1992. In the run-up to its WTO accession, though, China implemented a major reduction in tariffs and other trade barriers, with average tariffs falling from over 40% to 15% by the time of entry in 2001, and to 10% by end-2005. The reform of the tax system, with the introduction of a VAT and rebates of VAT paid on exported goods, further boosted trade, as did the unifi cation of the exchange rate in 1994 and the current account convertibility of the renminbi (RMB) in 1995, which went along with a de facto currency depreciation of about 10%.
The second pillar of China’s opening up was the gradual reform of the foreign exchange system. Before the reforms, foreign exchange was allocated according to the Plan, and all foreign exchange had to be handed over to the central bank. At the start of reform, the Bank of China was the only bank that was allowed to conduct business in foreign currency. To attract FDI, foreign banks were allowed to set up branches in SEZs, but they were not allowed to conduct business in RMB. In 1979 the authorities began to allow domestic fi rms and local govern-ments to retain part of their foreign exchange earnings. This share varied over time and depended on the source of the exchange earnings. Entities could use their foreign exchange retention quota to buy foreign exchange at the offi cial rate and to import products with prior approval from the Ministry of Foreign Trade. The foreign exchange retention quota was gradually increased. By end of 1993 when the retention system was abolished, total foreign exchange retention had already reached 80% of export proceeds, leaving only 20% of trade within the Plan. A dual exchange rate system introduced in 1979 provided additional incen-tives for export. At introduction, the dual exchange rate used for exporters was 2.8 RMB/$, compared with the offi cial rate of 1.5 RMB/$. The authorities gradually devalued the offi cial rate and partially unifi ed the two rates in 1985. After that, so-called swap centres were established to trade foreign exchange or retention quotas at an exchange rate more depreciated than the offi cial rate. In 1995, a fully unifi ed exchange rate was established.
The third pillar of the opening of China’s economy was SEZs. Enterprises in these zones enjoyed tax exemptions and reductions as well as better infra structure and often better government services. The evolution of FDI policies is the most striking example of gradual policy across geographic space. In 1980, the fi rst SEZs were established in four coastal cities. These zones were allowed to offer special advantages to attract foreign investors and became an instant success in generat-ing trade: within four years (1981–84), the trade volume of Shenzhen SEZ has increased 60-fold. The SEZ policy was extended to 14 coastal cities in 1984 and to the deltas of the Yangtze, Pearl and Minnan rivers in 1985. In 1988, Hainan Island and another 140 coastal cities and counties were included, and by 1999 all western provinces were open to FDI. Foreign-invested enterprises outside SEZs enjoyed considerable advantages over domestic enterprises as well, among them lower income tax rates, and often lower prices for land and utilities granted by local governments eager to attract FDI. As a consequence, much of China’s success in
cBIEAug07.indb 192
cBIEAug07.indb 192 27/6/07 5:33:39 PM27/6/07 5:33:39 PM
exports was due to foreign-invested fi rms, whose export share rose from 1% of the total in 1985 to more than 50% in 2005.
Indonesia’s opening up hardly followed a straight line: initial rapid liber-alisation was followed by back-tracking in the 1970s, renewed reforms in the 1980s, and selected protection of fi rst-family interests in the 1990s. Indonesia’s 1966–70 reforms, including simplifi cation of the foreign trade regime, a reduction in preferential treatment for SOEs and the enactment of the foreign and domestic investment laws, fostered broad-based industrial growth for the fi rst time since independence. In return, the government received extensive and vital tax rev-enues on which it would depend over the next three decades. After the mid-1970s, industrial growth began to slow as the limits to growth of the domestic market were reached. The onset of the oil boom in the mid-1970s and the Malari incident led to a phase of state-directed industrialisation (Hill 1996: 28). During this period the government reversed its liberal trade regime, introducing more tariffs and non-tariff trade barriers (NTBs). Effective protection rates increased (Hill 2000: 114) and foreign investment became more restricted.
After the oil boom ended, Indonesia returned to an outward-looking, export-promoting industrialisation strategy, at fi rst hesitantly, but in earnest after the steep oil price decline in early 1986. The government introduced a series of trade reforms in 1982 to reduce the ‘anti-export bias’, while reforming taxes to safe-guard revenues—introducing a VAT and a property tax in 1983. A major reform was the introduction of a ‘duty exemption and drawback scheme’ in 1986, which exempted export-oriented fi rms from all import duties and regulations on import-ing their inputs—much like the arrangements for processimport-ing trade in SEZs in China. Two institutional innovations helped Indonesia’s economic technocrats to regain control over trade policy: the Tariff Team (Tim Tarif) and the outsourcing of the customs service. Tim Tarif, set up in 1985, centralised controls over the tariff-setting process, and average tariff rates were reduced in a number of steps from 27% in 1985 to 20% by 1994 and, after some slowdown in the mid-1990s, to a mere 6.4% in 2004 (Basri and Soesastro 2005; WTO 2003). A strikingly effective measure was to transfer investigation and clearance of most import consignments from the Directorate General of Customs to the Swiss fi rm Société Générale de Surveil-lance (SGS): clearance costs dropped to one-fi fth of their former level (Dick 1985: 10), boosting trade and tariff revenues alike. Flanking these trade reforms were measures to re-liberalise the foreign investment regime, including a reduction in the number of approval steps, introduction of a ‘one-stop shop’ (the Investment Coordinating Board, BPKM, although it never functioned as such) and by the early 1990s the move to a negative list of sectors in which foreign investment was restricted. Renewed liberalisation commitments in 1996 fell victim to the crisis, though, and reform momentum was not sustained in the post-crisis period, with trade and investment policy diffused across different ministries.
Financial sector reforms
China and Indonesia started major fi nancial sector reforms fairly late in the reform period. While each had initially taken a number of reform steps, notably to re-establish the role of the central bank, both were more than 15 years along the reform path before fi nancial reforms accelerated. China’s reforms were tradi-tionally gradual, whereas Indonesia’s, notably the October 1988 reform package
cBIEAug07.indb 193
cBIEAug07.indb 193 27/6/07 5:33:39 PM27/6/07 5:33:39 PM