Summary Effects of water stress on fruit fresh and dry weights were investigated in peach trees, Prunus persica (L.) Batsch., with varying crop loads: light, moderate and heavy. In well-watered controls, tree water status was independent of crop load. In trees receiving reduced irrigation, the degree of water stress increased with increasing crop load. Water stress induced fruit fresh weight reductions at all crop loads. Fruit dry weight was not reduced by water stress in trees having light to moderate crop loads, indicating that the degree of water stress imposed did not affect the dry weight sink strength of fruit. Water-stressed trees with heavy crop loads had significantly reduced fruit dry weights, which were likely due to carbohy-drate source limitations resulting from large crop carbon de-mands and water stress limitations on photosynthesis.
Keywords: carbon partitioning, drought, fruit growth.
Introduction
The relationship between fruit growth and water stress is dynamic and depends on the developmental stage of the fruit, the severity of water stress, and the component of growth being considered. The growth of fleshy fruits such as apples, stone fruits, and grapes consists of distinct developmental phases. In peach (Prunus persica (L.) Batsch), rapid initial fruit growth is followed by an intermediate phase of slow growth. This is followed by a period of very rapid fresh and dry weight increase that ends with maturity and ripening (Chalmers and van den Ende 1975). During this final growth phase, which consists of approximately one-third of the growth period, 65% of a fruit’s dry weight and 80% of a fruit’s fresh weight are accumulated (Chalmers and Wilson 1978).
It has been observed that vegetative and reproductive growth in trees are differentially sensitive to water stress. Additionally, reproductive growth is differentially sensitive to water stress at different times of the season. It has been reported that mild water stress applied during the intermediate developmental period of slow fruit growth has no effect on crop yields but significantly reduces vegetative growth in peach (Mitchell and Chalmers 1982) and pear (Mitchell et al. 1984). However, the final period of very rapid fruit growth has been reported to be relatively sensitive to water stress in peach (Li et al. 1989,
Crisosto et al. 1994), apple (Lotter et al. 1985) and Asian pear (Caspari et al. 1994).
Horticultural studies of water stress effects on tree fruit growth have focused on fruit size, which is largely a measure of fresh weight, but have not described the effects of water stress on dry weight accumulation. Research on tomato sug-gests that water stress limits fleshy fruit water accumulation but does not affect carbon partitioning to the fruit (Ehret and Ho 1986, Mitchell et al. 1991). The effect of water stress on reproductive sink activity in tree crops has not been investi-gated.
Fruit dry weight growth can be described in terms of the realization of potential: i.e., the maximum growth possible given a non-limiting supply of resources (Wareing and Patrick 1975). Fruit growing at its potential rate is limited by its capacity for sink activity and, thus, is sink limited. When dry weight accumulation is limited by insufficient carbohydrates, growth is said to be source limited.
Grossman and DeJong (1995) have described the use of variable crop loads in peach to identify periods of source and sink limitation to fruit dry weight growth. The maximum potential dry weight accumulation of individual fruit is deter-mined on trees where most fruit have been removed early in development. Growth of the remaining fruit is not limited by competition for carbohydrates and is thus sink limited. Fruit dry weight growth on trees with heavier crop loads is then compared to the potential maximum to identify source- and sink-limited periods of growth. Dry weight accumulation equal to the potential maximum indicates sink-limited growth. Growth below potential is assumed to result from source limi-tations.
In peach, fruit on trees bearing a normal commercial crop load are usually source limited during the final stage of rapid growth (Pavel and DeJong 1993, Grossman and DeJong 1995). During this period, the sink demand of many rapidly growing fruit is greater than assimilate supply (Grossman and DeJong 1994).
Water stress could potentially inhibit fruit dry weight growth as a result of both sink and source limitations. Sink limitations to fruit growth could occur if fruit cell expansive growth and carbohydrate accumulation processes are sensitive to water status. Source limitations could occur when water stress
re-Water stress and crop load effects on fruit fresh and dry weights in
peach (
Prunus persica
)
M. E. BERMAN and T. M. D
EJONG
Department of Pomology, University of California, Davis, CA 95616, USA
Received February 29, 1996
duces photosynthesis and restricts the supply of assimilates. Moderate water stress will often reduce whole-plant carbon gain, usually by inducing stomatal closure (Chaves 1991).
The objective of this study was to investigate water stress effects on peach fruit fresh and dry weight accumulation dur-ing the final stage of very rapid growth. These effects were compared among trees with varying crop loads to determine: (1) how much of the reported water stress-induced decrease in fruit size is attributable to fresh weight reduction versus dry weight reduction; (2) whether water stress reduces the poten-tial dry weight accumulation of individual fruit on trees with very light crop loads (i.e., does water stress induce sink limi-tations to fruit growth); and (3) whether source limilimi-tations to fruit growth on trees with heavy crop loads are intensified by water stress.
Materials and methods
Plant material
Before bloom, 96 trees from eight rows of 5-year-old ‘Elegant Lady’ peach (P. persica) trees, on ‘Lovell’ rootstock, were selected for uniformity, in a block at the UC Davis Wolfskill Experimental Orchard, Winters, California. The orchard was planted in a high density formation (5.5 × 2 m spacing) and trained to a Kearney perpendicular-V (DeJong et al. 1995). Trees received standard commercial dormant pruning and 100 kg ha−1 N fertilization in the spring before the experiment.
Irrigation treatments
The experiment was set up as a split-plot with eight blocks with irrigation being the main-plot factor. Eight pairs of adja-cent half-rows were selected as blocks. One half-row received the control treatment (CT) and the adjacent half-row received the water stress (WS) treatment. A furrow was ripped between rows to cut roots in the upper 40 cm of soil (the zone of most root growth in this orchard) and to prevent surface water movement between treatments. The trees were irrigated twice weekly by microjet sprinklers.
Reference evaporation (ET0) data for Winters, CA were obtained from the California Irrigation Management System (CIMIS). Before May 26, both treatments received 100% re-placement ET0 irrigation. From May 26 until the end of the experiment on July 13, the CT trees received 120% replace-ment ET0 irrigation. Previous experiments (unpublished data) indicated that significant time would elapse after imposition of reduced irrigation and observable effects on plant water status. To impose water stress during the final four weeks of growth in the WS treatment, irrigation was completely withheld in the WS treatment for two weeks, from May 26 to June 9. From June 9 until the end of the experiment, WS trees received 25% replacement ET0 irrigation.
Thinning treatments
Within each irrigation plot, the CT and WS rows were divided into three sub-plots, consisting of pairs of adjacent trees. Sub-plots were randomly assigned one of three thinning treatments:
light crop load (LC), minimum 10 cm between fruit, moderate crop load (MC), minimum 5 cm between fruit (these trees had standard commercial fruit spacing and crop load), heavy crop load (HC), no fruit removed from tree. Trees were thinned during the first week of April, three weeks after full bloom.
Crop loads in the three thinning treatments were quite vari-able. The LC treatment averaged 163 fruit per tree (S.D. = 58.97), the MC treatment averaged 265 fruit per tree (S.D. = 72.31) and the HC treatment averaged 561 fruit per tree (S.D. = 153.22).
Water potential measurements
Water potential was measured with a Scholander pressure chamber (Soil Moisture Equipment Co., Santa Barbara, CA). To measure whole-tree water status, water potentials were measured at midday (from 1130 to 1230 h) on shaded leaves, close to the main trunk, which had been bagged for at least one hour before measurement. The leaf bags were plastic sheaths covered with aluminum foil. This method of water potential measurement eliminates the leaf-to-leaf variability encoun-tered using exposed leaves by measuring a leaf in which water potential has equilibrated with that of the main trunk (McCutchan and Shackel 1992). Measurements were taken on one leaf on each of four to six trees per thinning × irrigation treatment combination. Measurements were made at 5- to 9-day intervals during the last five weeks of the experiment.
Gas exchange measurements
Because of technical difficulties, only one complete day of photosynthetic measurements were collected (July 7), one week before harvest and one day after irrigation. Gas exchange was measured three times during the day on mature, well-ex-posed outer canopy leaves of four trees from each of the six thinning and irrigation treatment combinations. Measurements were made with an ADC portable gas exchange system (ADC Ltd., Hoddesdon, U.K.).
Fruit harvest
Fruit were harvested on July 14, when the majority of the fruit in the LC treatment had reached maturity but before significant drop occurred. Fruits in the other treatments were less devel-oped than those in the LC treatments, with the water-stressed HC trees having the least ripe fruits at time of harvest. All fruits were removed from each tree and the total number of fruits counted. The total crop fresh weight for each tree was meas-ured and then a 10-fruit subsample from each tree was col-lected. The sample was weighed, and dried at 65 °C in a forced air draft oven, and dry weight recorded. From the fresh weight/dry weight ratio of the subsample, the total crop dry weight for each tree was calculated. The average fresh and dry weight per fruit was calculated by dividing total crop fresh weight and total crop dry weight by total fruit number.
Data analysis
potentials were compared for each irrigation × thinning treat-ment using Tukey’s means separation test at a significance level of P < 0.05.
The yield data were analyzed as a split-plot design. Data from pairs of trees in each sub-plot were averaged to yield a single replication value for each sub-plot. Significant irrigation (main plot) and thinning (sub-plot) effects were observed for both fresh and dry crop weights. To analyze the data in greater detail, the experiment was stratified by thinning treatment and each thinning treatment analyzed separately.
Because of varying tree sizes and degrees of fruit set, there was considerable variability in tree-to-tree crop load within each thinning treatment. To reduce the variance associated with variable crop loads, fresh and dry fruit weight means for each thinning treatment were adjusted using the difference between mean thinning treatment crop load (163, 265, and 561 fruit per tree for the LC, MC and HC treatments, respectively) and actual crop load as a covariate. This type of analysis gave an adjusted mean and variance which would have been ob-served if all trees within each thinning treatment had equal crop loads (Steel and Torrie, 1980). Each thinning treatment was analyzed by ANOVA covariate analysis to determine the significance of irrigation effects and to compute adjusted means (Freund et al. 1986). Irrigation effects were considered significant at P < 0.05.
Results
Water stress
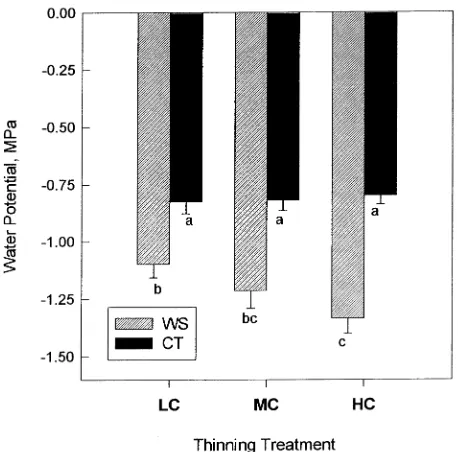
In early June, midday stem water potential differences between the two irrigation treatments were observed (Figure 1). The average stem water potential during the last five weeks of the season was differentially affected by crop load in the two irrigation treatments (Figure 2). Within the CT treatment, stem water potential was independent of load treatment. Within the WS treatment, water potential became more negative with increasing crop load and was significantly lower in HC trees than in LC trees.
Gas exchange
Carbon dioxide assimilation rates were highest early in the day and declined in the afternoon (Figure 3). Leaf assimilation rates in the WS treatment equaled those in the CT treatment early in the day. In the afternoon, the difference between the two irrigation treatments was greatest, with WS trees having significantly lower late afternoon leaf assimilation rates than CT trees in the MC and HC treatments. Reduced leaf assimi-lation rates were highly correlated with low water potentials and leaf conductances (data not shown). Over the 7.5 hour measurement period, the total estimated leaf assimilation inte-gral in the WS treatment was reduced by 21% in the MC trees and 27% in the HC trees.
Individual fruit and total crop weight
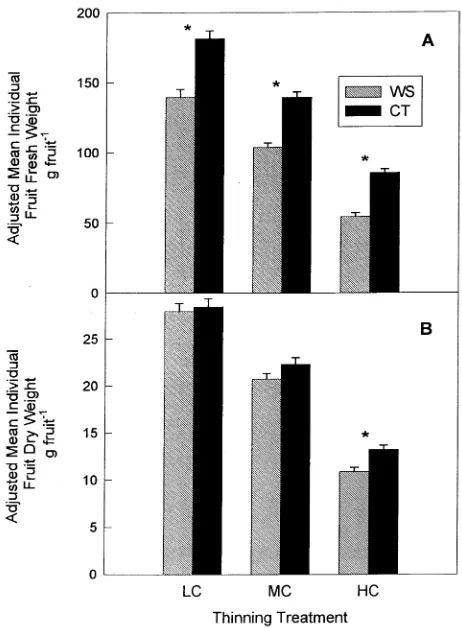
Adjusted individual mean fruit fresh weight was significantly lower in the WS treatment than in the CT treatment (Figure
4A): i.e., by 23, 26 and 37% in the LC, MC and HC thinning treatments, respectively. In both irrigation treatments, adjusted mean fruit fresh weight decreased with increasing crop load.
Figure 1. Seasonal pattern of midday stem water potential for each irrigation and thinning treatment combination. The irrigation treat-ments are control treatment (CT) and water stress (WS) treatment. The thinning treatments are light crop (LC) with a mean crop load of 163 fruit per tree, moderate crop (MC) with a mean crop load of 265 fruit per tree, and heavy crop (HC) with a mean of 561 fruit per tree. Each point represents the mean of four to six measurements. Error bars represent standard errors.
Irrigation treatment had no significant effect on adjusted individual mean fruit dry weight in the LC and MC treatments (Figure 4B). In the HC treatment, WS irrigation significantly reduced adjusted mean dry fruit weight by over 18%.
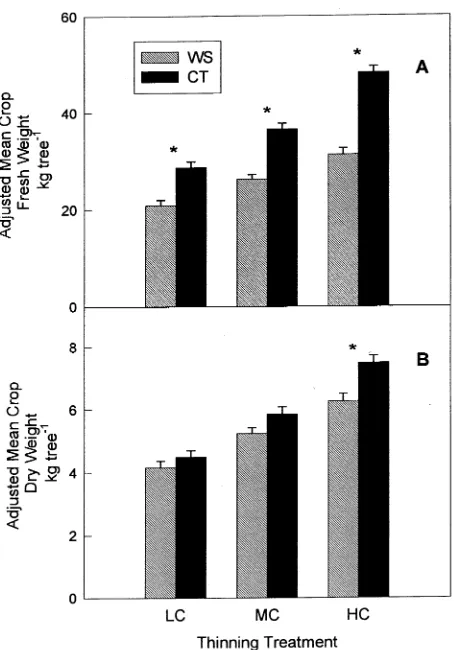
Adjusted mean total crop fresh weight was significantly greater in CT trees than WS trees for all thinning treatments (Figure 5A). Adjusted mean dry crop weight was not signifi-cantly different between irrigation treatments in the LC and MC thinning treatments, but was significantly reduced by 17% in the water-stressed HC trees (Figure 5B).
Discussion
Water stress
Within the WS irrigation treatment, the severity of water stress was dependent on crop load, whereas in the CT treatment, water status was independent of load (Figure 2). It has been observed in peach that cropping trees are often more water stressed than defruited trees (Chalmers and Wilson 1978). During the final growth phase, when assimilate demand by fruit is at a maximum, leaf transpiration rates are reported to be higher on cropping trees than on non-cropping trees
(Chal-mers et al. 1983). DeJong (1986) compared gas exchange parameters of the leaves of fruiting and non-fruiting peach trees and observed that fruit induced 30% greater stomatal conductance and 11--15% increased photosynthetic rates. In-creased water use due to crop-induced transpirational in-creases may account for the water potential differences observed in this study. In the CT trees, increased fruit loads apparently did not affect water status because sufficient soil water was present at all times.
The increased water stress associated with larger crop loads could also be the result of reduced root growth. Williamson and Coston (1989) observed that even light crop loads significantly reduced root growth in peach during the period of maximal fruit growth. Because soils in the WS irrigation treatment dried, root growth to exploit increased soil volume may have been inhibited by insufficient carbon supply in heavily crop-ping trees.
Fruit fresh weight
Water stress caused a significant decrease in fruit fresh weight (Figure 4A). This is in agreement with horticultural studies where peach fruit size, largely a measure of fresh weight, was reduced by water stress (Li et al. 1989, Crisosto et al. 1994).
Figure 4. Adjusted mean individual fruit fresh and dry weights. Error bars represent adjusted standard errors. Asterisks represent significant ANOVA effects for irrigation treatment at P < 0.05. (A) Individual fruit fresh weight, (B) individual fruit dry weight.
Reduced fruit fresh weight as a result of water stress is ex-pected. Water potential is highly correlated with plant relative water content (RWC) (Koide et al. 1991), and the WS trees, having lower water potentials than the CT trees, would be expected to have reduced whole-plant RWC. However, the specific mechanism of fruit fresh weight reduction is unclear.
Fleshy fruit water relations, especially near fruit maturity, are complex. In grape (Greenspan et al. 1994) and tomato (Ho et al. 1987), the maturing fruit may be partially isolated from the apoplast of the plant, and most water is supplied through the phloem. However, apoplastic water status strongly influ-ences water flow in the phloem. The water potential gradient between the fruit and the plant controls phloem-driven expan-sive growth of tomato fruit (Johnson et al. 1992). In Phaseolus, translocation flow from the leaves to the roots was observed to be proportional to the source−sink water potential gradient (Lang and Thorpe 1986). In this study, the reduced water potential of the WS treatment trees may have reduced the driving force for water flow into the fruit.
The fresh weight reductions were 23 and 26% in the LC and MC treatments, respectively, and over 37% in the HC treat-ments. This greater degree of fresh weight reduction may have resulted from the more severe water stress observed in the HC
trees (Figure 2) or from the significant water stress effects on the dry weight accumulation of these fruit. Fresh weight growth depends on the accumulation of large quantities of osmotically active solutes and massive cell expansive growth (Zucconi, 1986). These processes require carbohydrates, and apparently restricted carbohydrate supply of the water-stressed HC trees would further decrease fruit ability to accumulate water.
Crop and fruit dry weight
Within the LC load treatment, irrigation treatment had no effect on fruit dry weight (Figure 4B). The LC trees were heavily thinned and fruit growth in this treatment should have been sink-limited (Grossman and DeJong 1995). The water stress experienced by the LC trees was not great enough to affect the sink strength of fruit. In the water-stressed MC treatment, the water potentials were more negative, yet no significant reduction in dry weight was observed relative to well-watered MC controls. This indicates that fruit sink strength was not reduced in trees with water potentials averag-ing 0.45 MPa below those of fully watered controls. This is in agreement with work with tomato, in which water stress de-creases fruit fresh weight without decreasing fruit sink strength (Ehret and Ho 1986, Mitchell et al. 1991). Therefore, peach fruit resemble tomato fruit in that fresh and dry weight accu-mulation are not necessarily correlated (Grange and Andrews, 1995).
Fruit dry weight was significantly reduced by water stress in the HC treatment. It is unlikely that water stress induced sink limitations to fruit growth in this treatment, unless a threshold water potential that reduces fruit sink strength exists between −1.21 MPa (that of the MC trees where no sink limitations were observed) and −1.33 MPa (that of the HC trees). There-fore we assume that total sink demand in the HC treatment was not affected by irrigation.
Assuming equal carbon demand in HC trees from both irrigation treatments, the significantly reduced total crop dry weight in WS trees (Figure 5B) represents a source limitation to dry weight accumulation. The total crop dry weight in the CT-HC trees can be considered the maximum potential carbo-hydrate supply and the 17% difference between CT and WS dry crop weights represents the reduction in carbohydrate supply caused by water stress.
This is in agreement with the leaf CO2 assimilation data (Figure 3). Water stress in the WS-HC trees led to stomatal closure and significantly reduced assimilation rates, relative to CT controls. Steinberg et al. (1990) observed that water poten-tials 0.6 MPa below those of fully watered controls caused severe reductions in leaf conductance and biomass production in young peach trees. In the HC trees, water-stress-induced reductions in assimilation, combined with high demand for carbohydrates appeared to create a source limitation to fruit dry weight growth. Water-stress-induced reductions in leaf assimilation rates were also observed in the MC treatment; however, the crop load, and thus the total sink demand of the fruit in this treatment, was less than that of the HC trees.
Adequate carbon was apparently available to support a moder-ate crop load, even with reduced photosynthesis.
A limitation of this study is that fruit within the various treatments were at different developmental stages when har-vested. The LC fruit in both irrigation treatments were at full maturity when the fruit were harvested whereas fruit develop-ment in the other treatdevelop-ments appeared to be 3--6 days behind. Thus the study measured the effects of water stress and crop load on fresh and dry weight accumulation rate, rather than water stress effects on final fruit size. Fruit growth rate tends to be highest just before fruit maturity is reached (Grossman and DeJong 1995). If development stage had been a factor in this experiment, one would have expected greater treatment effects on fruits growing at the highest rates. The greatest treatment effects were actually on the HC trees, which had the most retarded development.
References
Caspari, H.W., M. Hossein and D.J. Chalmers. 1994. Water use, growth, and fruit yield of ‘Hosui’ Asian pears under deficit irriga-tion. J. Am. Soc. Hort. Sci. 119:383--388.
Chalmers, D.J. and B. van den Ende. 1975. A reappraisal of the growth and development of peach fruit. Aust. J. Plant Physiol. 2:623--634. Chalmers, D.J. and I.B. Wilson. 1978. Productivity of peach trees: Tree growth and water stress in relation to fruit growth and assimi-late demand. Ann. Bot. 42:285--294.
Chalmers, D.J., K.A. Olsson and T.R. Jones. 1983. Water relations of peach trees and orchards. In Water Deficits and Plant Growth, Vol. VII. Ed. D.J. Chalmers. Academic Press, NY, pp 197--232. Chaves, M.M. 1991. Effects of water deficits on carbon assimilation.
J. Exp. Bot. 42:1--16.
Crisosto, C.H., R.S. Johnson, J.G. Luza and G.M. Crisosto. 1994. Irrigation regimes affect fruit soluble solids concentration and rate of water loss of ‘O’Henry’ peaches. HortScience 29:1169--1171. DeJong, T.M. 1986. Fruit effects on photosynthesis in Prunus persica.
Physiol. Plant. 66:149--153.
DeJong, T.M, K.R. Day, J.F. Doyle and R.S. Johnson. 1995. The Kearney Agricultural Center perpendicular ‘‘V’’ (KAC-V) orchard system for peaches and nectarines. Hort. Tech. 4:362--367. Ehret, D.L. and L.C. Ho. 1986. Effects of osmotic potential in nutrient
solution on diurnal growth of tomato fruit. J. Exp. Bot. 37:1294--1302.
Freund, R.J., R.C. Littell and P.C. Spector. 1986. SAS System for linear models. SAS Institute, Cary, N.C., pp 85--141.
Grange, R.I. and J. Andrews. 1995. Respiration and growth of tomato fruit. Plant Cell Environ. 18:925--930.
Greenspan, M.D., K.A. Shackel and M.A. Matthews. 1994. Develop-mental changes in the diurnal water budget of the grape berry exposed to water deficits. Plant Cell Environ. 17:811--820.
Grossman, Y.L. and T.M. DeJong. 1994. PEACH: A simulation model of reproductive and vegetative growth in peach trees. Tree Physiol. 14:329--345.
Grossman, Y.L. and T.M. DeJong. 1995. Maximum fruit growth po-tential and seasonal patterns of resource dynamics during the growth of individual fruit. Ann. Bot. 75:553--560.
Ho, L.C., R.I. Grange and A.J. Picken. 1987. An analysis of the accumulation of water and dry matter in tomato fruit. Plant Cell Environ. 10:157--162
Johnson, R.W., M.A. Dixon and D.R. Lee. 1992. Water relations of the tomato during fruit growth. Plant Cell Environ. 15:947--953. Koide, R.T., R.H. Robichaux, S.R. Morse and C.M. Smith. 1991. Plant
water status, hydraulic resistance and capacitance. In Plant Physi-ological Ecology. Eds. R.W. Pearcy, J. Ehleringer, H.A. Moony and P.W. Rundel. Chapman and Hall, London, pp 161--183.
Lang, A. and M.R. Thorpe. 1986. Water potential, translocation and assimilate partitioning. J. Exp. Bot. 37:495--503.
Li, S.H., J.G. Huguet, P.G. Schoch and P. Orlando. 1989. Response of peach tree growth and cropping to soil water deficit at various phenological stages of fruit development. J. Hort. Sci. 64:541--552. Lotter, J.D.V., D.J. Beukes and H.W. Weber. 1985. Growth and quality of apples as affected by different irrigation treatments. J. Hort. Sci. 60:181--192.
McCutchan, H. and K.A. Shackel. 1992. Stem-water potential as a sensitive indicator of water stress in prune trees (Prunus domestica
L. cv. French). J. Am. Soc. Hort. Sci. 117:607--611.
Mitchell, J.P., C. Shennan and S.R. Grattan. 1991. Developmental changes in tomato fruit composition in response to water deficit and salinity. Physiol. Plant. 83:177--185.
Mitchell, P.D. and D.J. Chalmers. 1982. The effect of reduced water supply on peach tree growth and yields. J. Am. Soc. Hort. Sci. 107: 853--856.
Mitchell, P.D., P.H. Jerie, and D.J. Chalmers. 1984. The effects of regulated deficit irrigation on pear tree growth, flowering, fruit growth, and yield. J. Am. Soc. Hort. Sci. 109:604--606.
Pavel E.W. and T.M. DeJong. 1993. Source- and sink-limited growth periods of developing peach fruits indicated by relative growth rate analysis. J. Am. Soc. Hort. Sci. 188:820--824.
Steel, G.D. and J.H. Torrie, 1980. Principles and procedures of statis-tics. McGraw-Hill, USA, pp 401--437.
Steinberg, S.L., J.C. Miller and M.J. McFarland. 1990. Dry matter partitioning and vegetative growth of young peach trees under water stress. Aust. J. Plant Physiol. 17:23--36.
Wareing, P.F. and J.W. Patrick. 1975. Source-sink relations and the partitioning of assimilates in the plant. In Photosynthesis and Pro-ductivity in Different Environments. Ed. J.P. Cooper. Cambridge University Press, pp 481--499.
Williamson, J.G. and D.C. Coston. 1989. The relationship among root growth, shoot growth and fruit growth of peach. J. Am. Soc. Hort. Sci. 114:180--183.