Summary To determine the effects of CO2-enriched air and root restriction on photosynthetic capacity, we measured net photosynthetic rates of 1-year-old loblolly pine seedlings grown in 0.6-, 3.8- or 18.9-liter pots in ambient (360 µmol mol−1) or 2× ambient CO2 (720 µmol mol−1) concentration for 23 weeks. We also measured needle carbohydrate concentra-tion and water relaconcentra-tions to determine whether feedback inhibi-tion or water stress was responsible for any decreases in net photosynthesis. Across all treatments, carbon dioxide enrich-ment increased net photosynthesis by approximately 60 to 70%. Net photosynthetic rates of seedlings in the smallest pots decreased over time with the reduction occurring first in the ambient CO2 treatment and then in the 2× ambient CO2 treat-ment. Needle starch concentrations of seedlings grown in the smallest pots were two to three times greater in the 2× ambient CO2 treatment than in the ambient CO2 treatment, but de-creased net photosynthesis was not associated with inde-creased starch or sugar concentrations. The reduction in net photosyn-thesis of seedlings in small pots was correlated with decreased needle water potentials, indicating that seedlings in the small pots had restricted root systems and were unable to supply sufficient water to the shoots. We conclude that the decrease in net photosynthesis of seedlings in small pots was not the result of CO2 enrichment or an accumulation of carbohydrates caus-ing feedback inhibition, but was caused by water stress.
Keywords: feedback inhibition, needle starch, needle sugar, Pinaceae, Pinus taeda, water stress.
Introduction
Photosynthetic down-regulation in response to elevated CO2 concentration is a common finding in CO2 enrichment studies. Gunderson and Wullschleger (1994) noted in their review that in experiments with 20 tree species grown in twice-ambient CO2 concentration, 12 species exhibited at least a 10% de-crease in net photosynthetic rate compared to plants grown in ambient CO2 concentration when measured at a common CO2 concentration. In general, trees growing in small pots (i.e., < 0.5 l) are more likely to exhibit photosynthetic down-regula-tion than trees growing in large pots (Arp 1991, Gunderson and
Wullschleger 1994, Sage 1994). The reason for this is unclear but possible explanations include decreased nutrient or water availability (Coleman et al. 1993), physical restrictions of growth leading to a hormonal response (Sage 1994), or a build up of carbohydrates in foliage as a result of decreased below-ground sink strength causing feedback inhibition (Arp 1991).
The causes of decreased net photosynthesis in plants grown in small pots have important ramifications for predicting the effect of increasing atmospheric CO2 concentration on field-grown plants. For instance, if the decrease in net photosynthe-sis is caused by a physical restriction to growth, then it is mainly an experimental artifact and will not occur in the field except perhaps in cases of extreme soil compaction. However, if the decrease in net photosynthesis occurs as a result of nutrient or water limitations, then plants may not benefit from elevated atmospheric CO2 concentrations when growing in environments with low resource availability. Finally, if the decrease in net photosynthesis of plants grown in small pots is the result of accumulation of carbohydrates in leaves causing feedback inhibition, then carbon acquisition is in part con-trolled by carbon use (sink strength) and the effect of elevated CO2 concentration on photosynthesis will depend on a plant’s ability to consume photosynthate.
Loblolly pine (Pinus taeda L.) is the most important com-mercial tree species, and an important component of many natural stands, in the southeastern United States. Although net photosynthesis of loblolly pine did not decrease in response to elevated CO2 concentration in field grown trees (Ellsworth et al. 1995, Liu and Teskey 1995, Teskey 1995, Tissue et al. 1996) or potted seedlings supplied with adequate water and nutrients (Fetcher et al. 1988), the photosynthetic capacity of loblolly pine seedlings grown in elevated CO2 declined when nutrient availability was severely limited (Tissue et al. 1993, Thomas et al. 1994). Whether feedback inhibition or water relations also affect photosynthetic rates in this species when grown in elevated CO2 concentrations has not been deter-mined.
The goal of this study was to determine if net photosynthetic rates decrease when loblolly pine seedlings are grown in ele-vated CO2 concentrations and whether this decrease only oc-curs when seedlings are grown in small pots. We also tested
Effect of elevated carbon dioxide concentration and root restriction on
net photosynthesis, water relations and foliar carbohydrate status of
loblolly pine seedlings
R. E. WILL and R. O. TESKEY
School of Forest Resources, University of Georgia, Athens, GA 30602, USA
Received July 24, 1996
three hypotheses: (1) decreased net photosynthesis resulting from either the CO2 enrichment or the small pot volume treat-ment is related to needle carbohydrate status or water relations; (2) an accumulation of starch or sugars in needles causes net photosynthesis to decrease as a result of feedback inhibition; and (3) water stress resulting from either root restriction or CO2 enrichment decreases net photosynthesis.
Materials and methods
Plant material and treatments
On March 22, 1994, 1-year-old bare root loblolly pine seed-lings (Weyerhaeuser family NCC 08-0074) were planted in 3.8-liter pots filled with Fafard 3B potting mix (Conrad Fafard Inc., Agawam, MA). Seedlings were grown for 11 weeks in a greenhouse where they were watered and fertilized as needed. On June 27--28, all seedlings were removed from their pots and their root systems trimmed to fit inside a 0.6-liter pot. After pruning, the seedlings were randomly assigned to one of three pot volumes: small (0.6 l), medium (3.8 l) or large (18.9 l), and placed under mist to avoid water stress while the roots became established.
After 10 days (July 8), half the seedlings in each pot treat-ment were randomly assigned to either the 2× ambient (720 µmol mol−1) or ambient (360 µmol mol−1) CO
2 treatment in two growth chambers (Environmental Growth Chambers, Chagrin Falls, OH) for 23 weeks. Except for CO2 concentra-tion, chambers were maintained under similar conditions (25/20 °C day/night temperature, 70% relative humidity and a 10-h photoperiod). After 3 weeks, the photoperiod was ad-justed to 12 h. Light was supplied by incandescent and high-output fluorescent bulbs so that photosynthetic photon flux density (PPFD) was between 650 and 750 µmol m−2 s−1 near the tops of the seedlings. Seedlings were rotated within cham-bers twice per week and between chamcham-bers once per week to minimize potential confounding effects caused by within or between chamber differences.
To maintain similar total nutrient availabilities among the pot treatments and avoid confounding nutrient availability with rooting volume, all seedlings were fertilized with an excess of nutrients. The small pots were fertilized daily, the medium pots twice per week, and the large pots once per week with a solution containing 0.30 g l−1 N, 0.26 g l−1 P, 0.49 g l−1 K, 0.0006 g l−1 B, 0.0015 g l−1 Cu, 0.003 g l−1 Fe, 0.0015 g l−1 Mn, 0.0015 g l−1 Zn and 0.000015 g l−1 Mo supplied as Miller Nutrileaf (Miller Chemical, Hanover, PA) as well as an addi-tional 0.02 g l−1 chelated Fe (Miller Iron Chelate DP, Miller Chemical). Between fertilizations, seedlings were watered be-yond saturation to prevent salt accumulation. During the sec-ond half of the experiment, the plants in the small pots had severely compacted root systems that decreased their ability to absorb water and decreased the ability of water to percolate through the potting medium. Therefore, these pots were placed in 125-ml containers of water to provide a constant water supply to the lower portion of the root system.
Biomass determinations
Seedling root, stem and needle biomass were destructively measured before imposing the CO2 treatments (n = 3) and after 23 weeks (n = 5).
Gas exchange and water potential measurements
Leaf gas exchange was periodically measured (Weeks 1, 7, 13, 19, and 22) in the chambers at the growth CO2 concentrations with an LI-6200 portable photosynthesis system equipped with a 0.25-l cuvette (Li-Cor, Inc., Lincoln, NE). Fascicles from the first needle flush of 1994 were measured throughout the experiment. Gas exchange measurements were made at a PPFD of approximately 485 µmol m−2 s−1 with the mean PPFD differing by an average of 13 µmol m−2 s−1 between chambers. Needle water potentials were measured with a pres-sure chamber (PMS, Corvallis, OR) at Week 22. Water poten-tials were measured immediately after gas exchange and reflected the water status of the plants under the growth condi-tions.
At Weeks 14, 18 and 22, gas exchange of all seedlings was measured at both 720 and 360 µmol mol−1 CO
2 concentration (reciprocal measurements) to determine whether seedlings from the different treatment groups differed in their relative photosynthetic response to CO2 concentration. The seedlings from both CO2 treatments were randomized between the two chambers to minimize any chamber effect. Gas exchange was measured at 720 µmol mol−1 CO2 in one chamber and 360 µmol mol−1 CO
2 in the other after which the CO2 concentration was adjusted and seedlings were measured at the reciprocal concentration. At least 90 min was allowed for seedlings to adjust to new CO2 concentrations before measuring gas ex-change.
Nutrient analysis
Needles were collected for nutrient analysis at the end of the experiment (Week 23, December 19). Nitrogen concentration was determined with a Technicon AutoAnalyzer II (Bran and Luebbe, Inc., Buffalo Grove, IL) following the methods of Issac and Johnson (1976). Phosphorus was measured by atomic absorption spectrophotometry (Model 560, Perkin-El-mer, Inc., Norwalk, CT) as described by Chapman and Pratt (1961).
Carbohydrate analysis
Nonstructural carbohydrate concentrations were measured at Weeks 7 and 22. Five fascicles per seedling were collected within 30 min of measuring gas exchange. Needles were im-mediately placed on dry ice and later that day stored in a freezer at −50 °C until they were freeze dried. Samples were analyzed by gas chromatography as described by Rieger and Marra (1994) except that the sugars were oximated for better separation of fructose from organic acids (Chapman and Hor-vat 1989).
Statistical analysis
ambient = 720 µmol mol−1) and pot volume (small = 0.6 l, medium = 3.8 l and large = 18.9 l). Every treatment group consisted of six seedlings (n = 6). Data were log transformed when necessary. Data were analyzed by two-way ANOVA with pot volume and growth CO2 concentration as the main effects. For the reciprocal photosynthesis measurements, measure-ment CO2 concentration was added to the model resulting in a three-way ANOVA.
Results
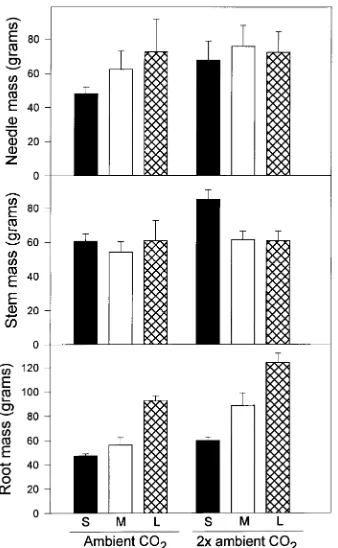
Initial needle, stem and root mass were 18.0, 10.7 and 3.8 g, respectively. By the final harvest, a significant pot volume effect (P < 0.0001) and CO2 effect (P < 0.0001) had developed for root mass (Figure 1). Seedlings grown in 2× ambient CO2 had larger root systems (90.8 versus 65.4 g) than seedlings grown in ambient CO2. Among the pot treatments, seedlings grown in large pots had the largest root systems (108.4 g), whereas seedlings grown in small pots had the smallest root systems (53.4 g). There were no statistically significant treat-ment effects on needle or stem mass (Figure 1); however, pot volume (P < 0.02) and CO2 concentration (P < 0.007) were significant for total mass. All seedlings had high nutrient status
with foliar concentrations of at least 2.0% nitrogen and 0.1% phosphorus.
Carbon dioxide enrichment increased net photosynthetic rates by about 60% (P < 0.0001) (Figure 2). From Week 13 onward, there was also an effect of pot volume on net photo-synthetic rate (P < 0.01) that was first observed as a reduction in net photosynthetic rates of seedlings grown in small pots in ambient CO2 concentration. Overall, net photosynthetic rates of seedlings grown in the small pots were reduced 12, 28 and 39% at Weeks 13, 19 and 22, respectively. At Week 13, there was an interaction (P < 0.04) between pot volume and CO2 treatment because the small pot treatment decreased net pho-tosynthetic rates of seedlings grown in ambient CO2 concen-tration by 25% compared with the mean of seedlings grown in medium and large pots in ambient CO2, whereas net photosyn-thetic rates of seedlings grown in 2× ambient CO2 was not decreased by the small pot treatment (Figure 2). This interac-tion did not occur at Week 19 or 22 because net photosynthetic rate of seedlings grown in 2× ambient CO2 was also decreased by the small pot treatment. Compared to the mean net photo-synthetic rate of seedlings grown in medium and large pots at
Figure 1. Effects of pot volume (S = 0.6 l, M = 3.8 l and L = 18.9 l) on mean final needle, stem and root mass of loblolly pine seedlings grown in ambient (360 µmol mol−1) or 2× ambient (720 µmol mol−1) CO
2 concentration. Error bars depict the standard error. The effect of CO2 concentration and pot volume were significant (P < 0.05) for root mass. Differences in stem and needle mass were not significant. Initial needle, stem and root mass were 18.0, 10.7 and 3.8 g, respectively.
Figure 2. Effects of pot volume (Small = 0.6 l, Medium = 3.8 l and Large = 18.9 l) on mean photosynthetic rate and needle conductance of loblolly pine seedlings grown in ambient (360 µmol mol−1) or 2× ambient (720 µmol mol−1) CO
Week 19, net photosynthetic rate of seedings grown in small pots was decreased 24 and 35% in the ambient and 2× ambient CO2 treatments, respectively (Figure 2). At Week 22, the cor-responding decreases were 34 and 42% (Figure 2).
Needle conductance of all seedlings was low one week after transplanting but increased dramatically between Weeks 1 and 7. At Weeks 13, 19 and 22, needle conductance was sig-nificantly lower for seedlings grown in 2× ambient CO2 than for seedlings grown in ambient CO2 (P < 0.0001) (Figure 2). From Week 13 onward, the small pot treatment caused signifi-cant decreases in needle conductance (P < 0.001) (Figure 2). There was an interaction between pot size and CO2 treatment at Week 13 because needle conductance of seedlings grown in small pots in ambient CO2 was reduced, whereas needle con-ductance of seedlings grown in small pots in 2× ambient CO2 was not (P < 0.02) (Figure 2). This interaction did not occur at Weeks 19 or 22 because needle conductances of the seedlings grown in small pots were reduced in both CO2 treatments.
Gas exchange results from the three sets of reciprocal CO2 measurements were similar and so only the last set (Week 22) is presented (Figure 3). Carbon dioxide enrichment during measurement increased net photosynthetic rate by
approxi-mately 70% for all seedlings regardless of growth CO2 concen-tration (Figure 3). Seedlings grown in small pots had signifi-cantly lower net photosynthetic rates than seedlings grown in medium or large pots, but the effect of pot volume on net photosynthetic rate was independent of growth and measure-ment CO2 concentrations (i.e., there were no pot volume × CO2 interactions). Thus, although seedlings grown in small pots in 2× ambient CO2 had the lowest absolute photosynthetic rates when measured at a CO2 concentration of 360 or 720 µmol mol−1, the relative photosynthetic stimulation due to CO2 en-richment was similar to that for seedlings in all of the other treatments (Figure 3).
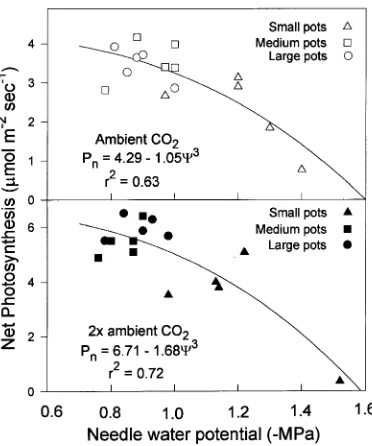
At Week 22, seedlings grown in small pots had more nega-tive water potentials and lower rates of net photosynthesis than seedlings grown in medium or large pots. When data for seedlings in all of the pot treatments were plotted, the shape of the water potential--net photosynthesis relationship was curvi-linear and similar for seedlings in both CO2 treatments (Fig-ure 4), indicating that low water potentials were closely correlated with the low gas exchange rates in seedlings grown in small pots at the end of the experiment.
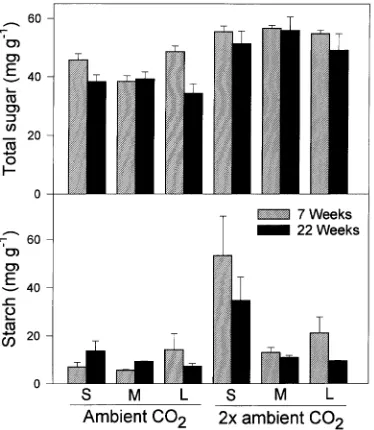
Needle starch concentrations were significantly higher in seedlings grown in 2× ambient CO2 concentration than in seedlings grown in ambient CO2 concentration. However, at both Weeks 7 and 22, there was a significant interaction be-tween pot volume and CO2 concentration (P < 0.05) for starch because seedlings grown in small pots in 2× ambient CO2 concentration had greater starch concentrations than seedlings in other treatments (Figure 5). Needle starch concentrations were lower at Week 22 than at Week 7 for seedlings in all
Figure 3. Effects of pot volume (Small = 0.6 l, Medium = 3.8 l and Large = 18.9 l) on mean photosynthetic rate of loblolly pine seedlings grown in ambient (360 µmol mol−1) or 2× ambient (720 µmol mol−1) CO2 concentration and measured at both ambient (360 µmol mol−1) and 2× ambient (720 µmol mol−1) CO
2 concentration after approxi-mately 5 months of treatment exposure. Error bars depict the standard error. The effects of measurement CO2 concentration and pot volume were significant (P < 0.05), but growth CO2 concentration and all interactions were not significant.
Figure 4. Effects of pot volume (Small = 0.6 l, Medium = 3.8 l and Large = 18.9 l) on the relationship between net photosynthesis and needle water potential for loblolly pine seedlings grown in ambient (360 µmol mol−1) or 2× ambient (720 µmol mol−1
treatments except seedlings grown in medium and small pots in ambient CO2 concentration (Figure 5). Although starch concentrations increased in seedlings grown in small pots in ambient CO2, at Week 22 these seedlings had starch concen-trations that were lower than or similar to those of seedlings in other treatments that did not exhibit a decrease in photosyn-thetic rate (e.g., the plants grown in medium and large pots in the 2× ambient CO2 treatment).
Plants grown in 2× ambient CO2 concentration had signifi-cantly greater (P < 0.0001) needle sucrose concentration (Fig-ure 6) and therefore greater total sugar concentrations (glucose + fructose + sucrose) (Figure 5) than plants grown in ambient CO2 concentration. Although there was a significant interac-tion between pot volume and CO2 concentration for sucrose and total sugar at Week 7, the effect of CO2 concentration was unambiguous because the lowest mean sucrose and total sugar concentrations of seedlings in any 2× ambient CO2 treatment group was greater than the highest mean concentrations of seedlings in any ambient CO2 treatment group. Sucrose con-centrations of seedlings grown in small pots increased slightly from Week 7 to Week 22, but they were always lower than those of seedlings grown in medium and large pots.
Although glucose concentration was higher in seedlings grown in small pots than in seedlings grown in medium or large pots at Week 7 (P < 0.03) and fructose concentration was higher in seedlings grown in ambient CO2 concentration than in seedlings grown in 2× ambient CO2 concentration, no con-sistent trends between pot volume or CO2 concentration were evident (Figure 6). Both fructose and glucose concentrations were lower at Week 22 than at Week 7 (Figure 6).
Discussion
Net photosynthetic rates were higher for seedlings measured in elevated CO2 than for seedlings measured in ambient CO2 regardless of growth CO2 concentration or pot volume. Seed-lings in all treatments exhibited the same relative response to CO2 concentration during the reciprocal measurements indi-cating that the effect of CO2 enrichment was similar for seed-lings in all treatments. Photosynthetic rates of seedseed-lings grown in small pots in the 2× ambient CO2 treatment decreased during the second half of the experiment; however, photosynthetic rates of seedlings grown in small pots in ambient CO2 de-creased earlier, indicating that the decreases in photosynthetic capacity were caused by root confinement rather than CO2 enrichment.
Root restriction did not change the relative response of photosynthesis to CO2 enrichment indicating that CO2 enrich-ment had a stimulatory effect regardless of pot size. Results from studies examining the interaction between CO2 concen-tration and pot volume in other species are variable. For exam-ple, Thomas and Strain (1991) found that cotton seedlings (Gossypium hirsutum L.) planted in small pots and exposed to CO2 enrichment exhibited a decrease in photosynthetic capac-ity and an accumulation of starch and concluded that decreased sink strength imposed by root restriction reduced the photo-synthetic response to CO2. However, more recent studies on Figure 5. Effects of pot volume (S = 0.6 l, M = 3.8 l and L = 18.9 l) on
foliar total sugar and starch concentrations of loblolly pine seedlings grown in ambient (360 µmol mol−1) or 2× ambient (720 µmol mol−1 ) CO2 concentration. Error bars depict the standard error.
Figure 6. Effects of pot volume (S = 0.6 l, M = 3.8 l and L = 18.9 l) on mean foliar fructose, glucose and sucrose concentrations of loblolly pine seedlings grown in ambient (360 µmol mol−1) or 2× ambient (720 µmol mol−1) CO
cotton show that photosynthetic rate decreased in response to CO2 enrichment regardless of whether plants were grown in large or small pots (Barrett and Gifford 1995a, 1995b). Sa-muelson and Seiler (1992) observed a decrease in net photo-synthesis of Fraser fir (Abies fraseri (Pursh.) Poir.) plants grown in small pots in CO2 enrichment when measured at 346 µmol mol−1 or 796 µmol mol−1 CO
2 concentration and a decrease in net photosynthesis of plants grown in large pots in CO2 enrichment when measured at 796 µmol mol−1 CO2 but not 346 µmol mol−1. Thus, the effects of CO
2 enrichment and rhizosphere restriction on photosynthesis appear to be strongly species specific.
Carbohydrate concentrations either decreased during the experiment or were lower in plants grown in small pots than in plants grown in medium or large pots. Thus, our carbohydrate data provided no indication that carbohydrate accumulation in foliage of seedlings grown in small pots caused the observed reduction in net photosynthesis. Therefore, we conclude that carbohydrate-induced feedback inhibition did not cause the decrease in net photosynthesis in plants grown in small pots. It is possible that feedback inhibition did not occur in these loblolly pine seedlings as a result of the recurrent flushing pattern of the species. New shoot growth and continued stem diameter growth may have provided adequate photosynthate sinks so that needle carbohydrate concentrations never reached inhibitory levels. An alternative explanation is that photosyn-thesis of loblolly pine seedlings is insensitive to high carbohy-drate concentration regardless of the concentration of CO2 exposure.
Although our loblolly pine plants grown in small pots exhib-ited a decrease in photosynthetic capacity without a corre-sponding increase in carbohydrate concentration, other studies have shown that decreased net photosynthesis is associated with carbohydrate accumulation in plants grown in small pots. For example, cucumber plants (Cucumis sativus L. cv Ca-lypso) grown in small pots exhibited decreased photosynthetic rates and increased starch concentrations when starch was measured over a 24-h period (Robbins and Pharr 1988). Simi-larly, peach trees (Prunus persica L.) grown in small pots showed a decrease in photosynthetic rate along with an accu-mulation of starch and sorbitol (Rieger and Marra 1994). In a study of the effects of root restriction in fruiting and nonfruit-ing peach trees, Mandre et al. (1995) found a negative relation-ship between net photosynthesis and leaf carbohydrate concentration; however, this relationship was inconsistent among treatment groups and led the authors to conclude that something other than feedback inhibition was contributing to the decrease in net photosynthesis in the nonfruiting trees.
We observed a strong negative correlation between water potential and net photosynthesis as well as a decrease in needle conductance in seedlings grown in small pots. These findings, coupled with the observation that water potentials of seedlings grown in small pots were lower than those of seedlings grown in the medium and large pots and low enough to decrease net photosynthesis (Seiler and Johnson 1985, Teskey et al. 1986, Seiler and Johnson 1988), led us to conclude that the decrease in net photosynthetic rates of plants grown in small pots was
probably caused by water stress because the small and re-stricted root systems were unable to absorb enough water even though a continuous supply was available. Similarly, Tschaplinski and Blake (1985) found that root restriction caused a decrease in net photosynthesis, an increase in sto-matal resistance and a decrease in leaf water potential in Alnus glutinosa (Gaertn.) and concluded that water stress was the mechanism that caused the decrease in net photosynthesis. Because the Alnus glutinosa plants were grown in solution culture, water stress was not caused by lack of available water, but resulted from an inability of the restricted roots to take up an adequate amount of water.
Seedling water status may also explain why net photosyn-thesis of seedlings grown in small pots decreased earlier in the ambient CO2 treatment than in the 2× ambient CO2 treatment. At Week 13, when net photosynthetic rates of seedlings grown in small pots in ambient CO2 were lower than those of seed-lings grown in small pots in 2× ambient CO2, needle conduc-tance was significantly lower in seedlings in the 2× ambient CO2 treatment. Thus, seedlings grown in small pots in 2× ambient CO2 were losing less water on a per needle area basis than seedlings grown in small pots in ambient CO2. Because needle areas of seedlings grown in ambient or 2× ambient CO2 were similar, this implies that seedlings grown in small pots in 2× ambient CO2 used less water and would therefore experi-ence water stress later in the experiment than seedlings grown in small pots in ambient CO2.
Our results support the conclusion that loblolly pine plants will benefit from a high CO2 environment because they do not decrease their photosynthetic capacity when exposed to long-term CO2 enrichment (Ellsworth et al. 1995, Liu and Teskey 1995, Teskey 1995, Tissue et al. 1996). An exception may be plants growing under conditions of nutrient stress, because Tissue et al. (1993) and Thomas et al. (1994) were able to induce down-regulation in loblolly pine by supplying low nutrient concentrations to potted seedlings. The plants that exhibited decreased net photosynthetic rates were deficient in foliar nitrogen with concentrations of approximately 0.5 to 0.7%, which is well below the typical foliar nitrogen concen-trations reported on nutrient-poor sites (1.07%, Van Lear et al. 1984; and 0.90%, Valentine and Allen 1990). The inability to force feedback inhibition by severe root restriction indicates that loblolly pine is unlikely to show a decrease in photosyn-thetic capacity in response to carbohydrate accumulation in-duced by elevated CO2 environments.
Acknowledgments
We thank Dr. Mark Rieger from the Department of Horticulture at University of Georgia for the use of his laboratory for the carbohydrate analysis, Paula Litvin for assistance during the carbohydrate analysis, Patsy Mason and Susan Wilson of the USDA Phytochemical research unit in Athens, GA for analyzing the carbohydrate samples and Wil-liam Jennings (Jay) Brown for his aid and expertise in growing loblolly pine.
References
Barrett, D.J. and R.M. Gifford. 1995a. Photosynthetic acclimation to elevated CO2 in relation to biomass allocation in cotton. J. Bio-geogr. 22:331--339.
Barrett, D.J. and R.M. Gifford. 1995b. Acclimation of photosynthesis and growth by cotton to elevated CO2: Interactions with severe phosphate deficiency and restricted rooting volume. Aust. J. Plant Physiol. 22:955--963.
Chapman, G.W., Jr. and R.J. Horvat. 1989. Determination of nonvola-tile acids and sugars from fruits and sweet potato extracts by capillary GLC and GLC/MS. J. Agric. Food Chem. 37:947--950. Chapman, H.D. and P.F. Pratt. 1961. Methods of analysis for soils,
plants and waters. University of California Press, Riverside, CA, 309 p.
Coleman, J.R., K.D.M. McConnaughay and F.A. Bazzaz. 1993. Ele-vated CO2 and plant nitrogen use: Is reduced tissue nitrogen con-centration size dependent? Oecologia 93:195--200.
Ellsworth, D.S., R. Oren, C. Huang, N. Phillips and G.R. Hendrey. 1995. Leaf and canopy responses to elevated CO2 in a pine forest under free-air enrichment. Oecologia 104:139--146.
Fetcher, N., C.H. Jaeger, B.R. Strain and N. Sionit. 1988. Long-term elevation of atmospheric CO2 concentration and the carbon ex-change rates of saplings of Pinus taeda L. and Liquidambar styraci-flua L. Tree Physiol. 4:255--262.
Gunderson, C.A. and S.D. Wullschleger. 1994. Photosynthetic accli-mation in trees to rising atmospheric CO2: a broader perspective. Photosynth. Res. 39:369--388.
Issac, R.R. and W.A. Johnson. 1976. Determination of total nitrogen in plant tissue. J. Assoc. Off. Anal. Chem. 59:98--100.
Liu, S. and R.O. Teskey. 1995. Responses of foliar gas exchange to long-term elevated CO2 concentrations in mature loblolly pine trees. Tree Physiol. 15:351--359.
Mandre, O., M. Rieger, S.C. Myers, R. Seversen and J.L. Regnard. 1995. Interaction of root confinement and fruiting in peach. J. Am. Soc. Hortic. Sci. 120:228--234.
Rieger, M. and F. Marra. 1994. Responses of young peach trees to root confinement. J. Am. Soc. Hortic. Sci. 119:223--228.
Robbins, N.S. and D.M. Pharr. 1988. Effect of restricted root growth on carbohydrate metabolism and whole plant growth of Cucumis sativus L. Plant Physiol. 87:409--413.
Sage, R.F. 1994. Acclimation of photosynthesis to increasing atmos-pheric CO2; the gas exchange perspective. Photosynth. Res. 39:351--368.
Samuelson, L.J. and J.R. Seiler. 1992. Fraser fir seedling gas exchange in response to elevated CO2. Environ. Exp. Bot. 32:351--356. Seiler, J.R. and J.D. Johnson. 1985. Photosynthesis and transpiration
of loblolly pine seedings as influenced by moisture-stress condi-tioning. For. Sci. 31:742--749.
Seiler, J.R. and J.D. Johnson. 1988. Physiological and morphological responses of three halfsib families of loblolly pine to water stress conditioning. For. Sci. 34:487--495.
Teskey, R.O. 1995. A field study of the effects of elevated CO2 on carbon assimilation, stomatal conductance and leaf and branch growth of Pinus taeda trees. Plant Cell Environ. 18:565--573. Teskey, R.O., J.A. Fites, L.J. Samuelson and B.C. Bongarten. 1986.
Stomatal and nonstomatal limitations to net photosynthesis in Pinus taeda L. under different environmental conditions. Tree Physiol.
2:131--141.
Thomas, R.B., J.D. Lewis and B.R. Strain. 1994. Effects of leaf nutrient status on photosynthetic capacity in loblolly pine (Pinus taeda L.) seedlings grown in elevated atmospheric CO2. Tree Physiol. 14:947--960.
Thomas, R.B. and B.R. Strain. 1991. Root restriction as a factor in photosynthetic acclimation of cotton seedlings grown in elevated carbon dioxide. Plant Physiol. 96:627--634.
Tissue, D.T., R.B. Thomas and B.R. Strain. 1993. Long-term effects of elevated CO2 and nutrients on photosynthesis and Rubisco in loblolly pine seedlings. Plant Cell Environ. 16:859--865.
Tissue, D.T., R.B. Thomas and B.R. Strain. 1996. Growth and photo-synthesis of loblolly pine (Pinus taeda) after exposure to elevated CO2 for 19 months in the field. Tree Physiol. 16:49--59.
Tolley, L.C. and B.R. Strain. 1985. Effects of CO2 enrichment and water stress on gas exchange of Liquidambar stryraciflua and Pinus taeda seedlings grown under different irradiance levels. Oecologia 65:166--172.
Tschaplinski, T.J. and T.J. Blake. 1985. Effects of root restriction on growth correlations, water relations and senescence of alder seed-lings. Physiol. Plant. 64:167--176.
Valentine, D.W. and H.L. Allen. 1990. Foliar responses to fertilization identify nutrient limitation in loblolly pine. Can. J. For. Res.
20:144--151.