www.elsevier.com / locate / livprodsci
Review article
Impact of recent research on energy feeding systems for dairy
cattle
1
*
R.E. Agnew , T. Yan
a
The Agricultural Research Institute of Northern Ireland, Hillsborough, Co. Down, Northern Ireland BT26, UK
Received 27 July 1999; received in revised form 14 December 1999; accepted 11 January 2000
Abstract
A considerable volume of research in the energy metabolism of dairy cows has been undertaken over the last 2 decades. The purpose of the present review is to reflect on the impact of these studies on the UK metabolisable energy (ME) system, and other net energy (NE) systems, and validate these systems using published calorimetric data. The NE requirement for maintenance (NE ) in the UK ME system is based on the fasting metabolism of cattle, while in other NE systems the NEm m
was obtained from regression techniques. The NEm values currently used in Europe and North America, which were developed from the data published 30 years ago, have been demonstrated, in recent studies, to be lower than for present dairy cattle. Maintenance metabolic rate can increase with increasing dietary fibre concentration, possibly being due to increasing gut mass and metabolic activity in organs. Grazing cattle require more time and greater physical efforts for eating the same amount of feed as housed animals and thus require extra energy for grazing activity. The NEmof cattle may be a function of body protein mass, rather than total liveweight of the animal. The efficiency of utilisation of ME for lactation (k ) can bel
derived from regression techniques or calculated by relating milk energy output and energy balance to ME available for production. Dietary fibre concentration has little effect on k , although it can influence the composition of volatile fatty acidsl
produced in the rumen and consequently shift milk composition and energy partition between milk and body tissue. There is no evidence to show an effect of cow genetic merit on k , but high genetic merit cows have the ability to partition morel
energy into milk than medium or low genetic merit cows. The k has been shown to be higher than the efficiency ofl utilisation of ME for tissue retention (k ) for dry cows, but ME was utilised with similar efficiency for milk production andg
concomitant tissue retention. The energy value per unit of liveweight gain or loss should not be fixed as it depends on gut fill and composition of fat, protein and water in the gained or mobilised liveweight. The energy value per mobilised liveweight can also differ with stage of lactation. The above effects are important for dairy cattle feeding and should therefore be incorporated in the future revision of an energy feeding system. The current energy feeding systems used in Australia, the Netherlands, UK and USA have also been validated using calorimetric data of lactating dairy cows published since 1976.
2000 Elsevier Science B.V. All rights reserved.
Keywords: Dairy cow; Energy system; Maintenance; Efficiency; Validation
*Corresponding author.
E-mail address: [email protected] (T. Yan).
1
Also a member of staff of the Department of Agriculture for Northern Ireland and The Queen’s University of Ireland.
1. Introduction liveweight change and energy value per unit of liveweight change.
The UK metabolisable energy (ME) feeding sys-tem, developed by Blaxter (1962), was first proposed for use in the UK in 1965 by the Agricultural
2. Energy requirement for maintenance
Research Council (ARC, 1965). This system was designed to overcome the deficiencies of the starch
2.1. Methods of estimating energy requirement for equivalent (SE) system (a net energy (NE) system)
maintenance
which was then used in the UK. The SE system assumed a simple ratio of NE values of feeds for
The NE requirement for maintenance (NE ) in
maintenance, fattening and lactation and also took no m
energy feeding systems presently used in Europe and account of the effect of feeding level on NE
con-North America was derived from calorimetric data. centration of a feed. Using the proposals put forward
In the UK ME system the NE was based on fasting
by ARC (1965), a simplified ME system was m
metabolism data (fasting heat production (FHP) plus recommended to be adopted in UK by the Ministry
fasting urinary energy output) from beef steers and of Agriculture, Fisheries and Food (MAFF, 1975).
dry non-pregnant dairy cows after a prolonged period The original ME system (ARC, 1965) was later
of restricted feeding (usually at maintenance level). substantially revised by ARC (1980) and further
Using this approach ARC (1980) reported a curvi-modified by Agricultural and Food Research Council
linear relationship between fasting metabolism (FM) (AFRC, 1990) and a new working version was
0.67
and liveweight (LW) (FM50.53?(LW/ 1.08) ) published in 1993 (AFRC, 1993). At the same time a
from a review of eight sets of data. This relationship, number of NE systems have been developed in
plus an activity allowance (0.0091?LW), is taken as Europe (Van Es, 1978; Institut National de
Re-NE for use at present in UK (AFRC, 1990). This cherche Agronomique (INRA, 1978) and Northern m
approach would suggest a fasting metabolism of America (National Research Council (NRC, 1978).
around 0.30 (or NE of 0.35 if an activity allowance There is no difference in principle between the m
0.75
is included) MJ / kg for an adult dairy cow. The ME and NE systems, with both systems recognising
ME requirement for maintenance (ME ) is
calcu-that the energy requirement of cattle is the sum of m
lated as NE divided by the efficiency of utilisation their energy requirements for maintenance, product- m
of ME for maintenance (k ,50.35?ME / GE10.503)
ion (milk and liveweight gain) and foetal growth. m
(AFRC, 1990). Alternatively, the NE can be
esti-The only difference between them is where the m
mated using regression techniques relating ME in-energetic efficiencies are embodied within the
calcu-take to milk energy output, adjusted to zero energy lation. In the ME system the energetic efficiencies
balance, with dairy cows offered diets at production are used for ration formulation and the prediction of
levels. Using this approach, Moe et al. (1972) and animal performance, while in the NE system the
Van Es (1975) reported NE values of 0.305 and
efficiencies are included as part of the energy m
0.75
evaluation of feeds. 0.293 MJ / kg , respectively from large sets of
Over the last 2 decades a considerable volume of calorimetric data. The former value is used to form research in the energy metabolism of dairy cows has the American NE system, with an activity allowance been undertaken. These studies have highlighted a of proportionately 0.10 being added (NRC, 1988). number of concerns over current energy feeding The latter value is adopted in the European NE systems. The purpose of the present review is to systems used in the Netherlands, France, Germany reflect on the impact of these studies on the UK ME and Switzerland. No activity allowance is adopted in system, and other NE systems, and validate these the Netherlands (Van Es, 1978), while an activity systems using published calorimetric data. The areas allowance of proportionately 0.10 is added for loose which will be addressed in the present review housed cows in France (INRA, 1989).
include the energy requirement for maintenance, The NEm in the UK ME system is a curvilinear
0.75
increasing liveweight (age) of cattle. This is because al., 1999). This type of infusion can also result in a the metabolic rate can be higher for growing than lower heat production than FHP (Chowdhury, 1992). adult cattle (ARC, 1965) and light adult animals However, the maintenance metabolic rate obtained
0.75
generally have a greater proportion of internal organs by fasting metabolism (0.30 MJ / kg ) (ARC, over total liveweight than heavy adult ones (NRC, 1980) is similar to that derived from regression
0.75
1988). The internal organs produce much higher heat techniques (0.305 or 0.293 MJ / kg ) (Moe et al., than muscle per unit weight. In contrast, the NEmfor 1972; Van Es, 1975). It thus seems unlikely that the
0.75
cattle is constant per kg in the NE systems used detriment of fasting to animal health influences in Europe and North America. In these systems the greatly the heat production.
NEmvalues were derived from data on mature dairy
cows. It is therefore likely that these latter systems 2.2. Recent research on energy requirement for may theoretically underestimate the energy require- maintenance
ments of young cattle.
The use of fasting metabolism data to determine The NEm values currently used in Europe and NE may have limitations. It has been suggested thatm North America were developed from data published fasting after a long period of restricted nutrition can 30 years ago. However, a recent study reported by result in deamination of amino acids from tissue Birnie (1999) revealed a FHP value of 0.39 MJ /
0.75
protein for the supply of essential glucose (Chow- kg for dry, non-pregnant dairy cows fed at dhury and Ørskov, 1994). This can induce a range of maintenance level prior to measurement of FHP. metabolic disorders in the animal, such as hypo- Assuming a fasting urinary energy output of 0.05 of glycaemia, hyperlipidaemia, hyperketonaemia and FHP (Van Es, 1972), the derived fasting metabolism hypoinsulinaemia. The deamination caused by fast- is proportionately 0.36 higher than that adopted in ing can however be reduced, as evidence of a lower current energy systems (Van Es, 1978; NRC, 1988; N output in urine, after infusing a small amount of INRA, 1989; AFRC, 1990). Similar higher FHP volatile fatty acids (VFAs) or glucose with or values were also reported by Yan et al. (1997b) and without casein (Ku Vera et al., 1987, 1989; Ørskov et Birnie (1999) when dairy cows were offered,
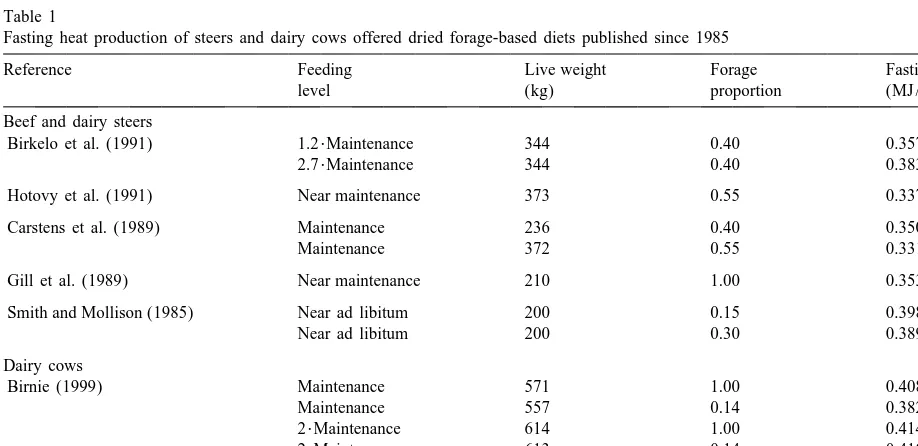
respec-Table 1
Fasting heat production of steers and dairy cows offered dried forage-based diets published since 1985
Reference Feeding Live weight Forage Fasting HP
0.75
level (kg) proportion (MJ / kg )
Beef and dairy steers
Birkelo et al. (1991) 1.2?Maintenance 344 0.40 0.357
2.7?Maintenance 344 0.40 0.383
Hotovy et al. (1991) Near maintenance 373 0.55 0.337
Carstens et al. (1989) Maintenance 236 0.40 0.350
Maintenance 372 0.55 0.331
Gill et al. (1989) Near maintenance 210 1.00 0.353
Smith and Mollison (1985) Near ad libitum 200 0.15 0.398
Near ad libitum 200 0.30 0.389
Dairy cows
Birnie (1999) Maintenance 571 1.00 0.408
Maintenance 557 0.14 0.382
2?Maintenance 614 1.00 0.414
2?Maintenance 613 0.14 0.410
Yan et al. (1997b) Near ad libitum 501 1.00 0.454
Table 2
Summary of the ME requirement for maintenance (ME ) and the efficiency of ME utilisation for lactation (k ) by lactating dairy cattle,m l
calculated by a range of authors using regression techniques and pooled calorimetric data
Reference Cow Forage Method MEm kl
0.75
no. (MJ / kg )
Moe et al. (1970) 350 Lucerne / grass hay Multiple 0.51 0.64
Van Es et al. (1970) 198 Hay / silage Linear 0.49 0.62
Van Es (1975) 1148 A range of forages Linear 0.49 0.60
Unsworth et al. (1994) 108 Grass / silage Linear 0.64 0.67
Hayasaka et al., 1995 53 Hay / silage Linear 0.59 0.64
Yan et al. (1997a) 221 Grass silage Linear / multiple 0.67 0.65
Present study .1500 A range of forages Linear / multiple 0.62 0.66
Mean 0.57 0.64
S.D. 0.075 0.024
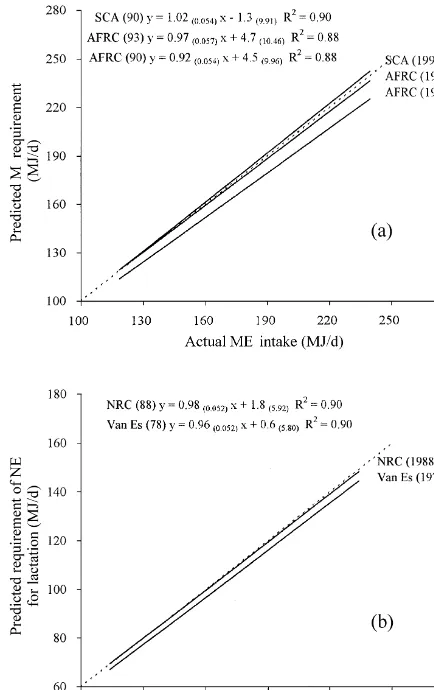
tively diets at near ad libitum and at twice mainte- MEI50.664( 0.0471 )MW11.452( 0.0755 )El
nance levels prior to fasting (Table 1). FHP data 2
11.079( 0.1200 )E Rg 50.92 (2) published using studies with beef and dairy steers
since 1985, as presented in Table 1, are in accord
where E , E , MEI and MW are, respectively milk with the above dairy cow results. The mean derived l g
energy output, energy balance, ME intake and meta-fasting metabolism, when assuming a meta-fasting urinary
0.75
bolic liveweight (kg ); E 5E 1E for positive
energy output of 0.05 of FHP (Van Es, 1972), is l( 0 ) l g
E or 5E 20.84?E for negative E . The units for
proportionately 0.19 higher than that proposed by g l g g
0.75
Eqs. (1) and (2) are, respectively MJ / kg and ARC (1980).
MJ / day. The values in brackets are standard errors. The MEm values derived from regression
tech-The mean ME derived from these two equations is niques have also been reported to be higher in recent m
0.75
studies. The MEm values obtained in 6 studies are 0.62 MJ / kg , a value which is proportionately presented in Table 2. The mean MEm value derived 0.27 higher than that derived from Van Es (1975), or in recent studies (Unsworth et al., 1994; Hayasaka et calculated from AFRC (1990).
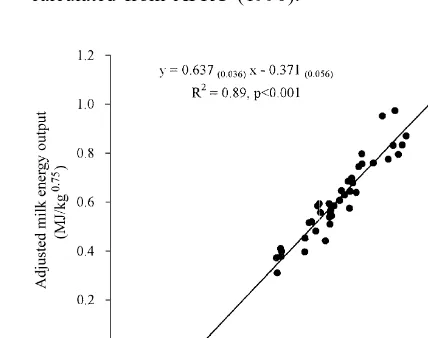
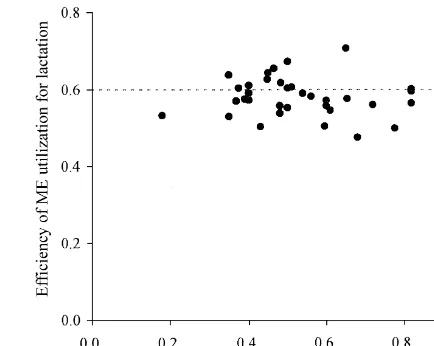
al., 1995; Yan et al., 1997a) is proportionately 0.28 higher than that reported over 20 years ago (Moe et al., 1970; Van Es et al., 1970; Van Es, 1975). As Van Es (1975) used a total of 1148 data from across the world, the NEm derived from his study is thus adopted in a number of European NE systems. The present authors have reviewed calorimetric studies with lactating dairy cows published since 1976. A total of 42 studies (more than 1500 individual animal data) were selected, in which the liveweights of the animals and the energy intake and outputs were available (for references see appendix). The ex-perimental mean data from these 42 studies were used to examine the relationship between ME intake and energy outputs. The linear (Fig. 1) and multiple regression equations obtained are:
2 Fig. 1. Relationship between ME intake and milk energy output
El( 0 )50.637( 0.0358 )MEI20.371( 0.0557 )R adjusted to zero energy balance using calorimetric data of dairy
cows published since 1976 (experimental means, n542).
The higher MEm may reflect differences in both feed intake, total heat production (MJ / day) was the diet and the cow now used, particularly the found to be similar between fat and lean rats at a considerable improvement in cow genetic merit similar body lean mass although total liveweight of during the last two decades (Coffey, 1992). The fat rats was heavier (Ramsey et al., 1998). The latter has led to an increase in milk yield of estimated MEm reported by Pullar and Webster approximately 62 kg / lactation per year (Agnew et (1977) in Zucker rats and by Toutain et al. (1977) in al., 1998). Indeed, high producing dairy cows were sheep also showed no significantly difference in
0.75
found 30 years ago by Flatt et al. (1969b) to require MEm (MJ / kg ) when related to protein mass, but proportionately 0.20 more ME for maintenance than was higher with lean than fat animals when related to cows producing moderate yield, as reported at the total liveweight.
same time by Moe et al. (1970) and Van Es et al. A series of fasting studies, in dry and non-preg-(1970). The higher MEm obtained in the recent nant Holstein–Friesian cows, carried out recently at studies may be attributable to a higher proportion of this Institute would support the above results. Cattle liveweight as body protein mass. This is evidenced were fattened from condition scores (CS) (Mul-in that high genetic merit cows had a lower backfat vanny, 1977) below 2.0 to over 4.5, or restricted thickness at a similar liveweight to medium and low feeding to reverse CS change. While FHP (MJ /
0.75
genetic merit animals (Ferris et al., 1999a), and a kg ) was significantly higher for cattle with low higher estimated lipid-free empty body weight as a than high CS, the former animals required a similar proportion of empty liveweight (Veerkamp et al., amount of estimated ME for maintenance (MJ / day) 1994). The MEm has been reported to be a function although they had a much heavier weight (Birnie,
0.75
of body protein mass (discussed later). On the other 1999). A regression of FHP (MJ / kg ) against CS
2
hand, high genetic merit cows obviously require (from 1.0 to 5.0) (R 50.83, n528) indicated that
0.75
greater nutrient intakes and this could stimulate the FHP was 0.483 MJ / kg at CS of 1.0 and an activity of internal organs with greater digestive increase of CS by 1.0 would reduce FHP by 0.029
0.75
load, cardiac output and blood flow required to MJ / kg .
digest, absorb and deliver nutrients to the mammary The above findings support the view of Oldham gland and a greater oxygen consumption (Reynolds, and Emmans (1990) that the major part of the energy 1996). These activities in return can enlarge the cost associated with tissue ‘maintenance’ results internal organ size. Liver and other internal organs from the continual process of synthesis, degradation can produce much more heat (MJ / kg) than that of and replacement of those parts of body tissues which muscle (Baldwin et al., 1985; Johnson et al., 1990). ‘turnover’. This is particularly the case with body protein for which the process of ‘turnover’ is sub-2.3. Factors affecting the energy requirement for stantial, although variable (Reeds, 1989). It has been
maintenance suggested that fat tissue does not ‘turnover’ at all in
animals fed regularly, although there does appear to 2.3.1. Body condition ( fat vs. lean) be an extent of fatty acid turnover which is obligat-In all currently used energy systems the energy ory and which might be presumed to represent a requirement for maintenance is related to the degree of turnover of body fat (Oldham and Em-liveweight of animals. However, there has been mans, 1990). The energy cost of maintaining body increasing evidence to suggest that maintenance protein would, however, be expected (on stoichio-metabolic rate depends on body lean mass, rather metric grounds) to exceed that of fat even if their than whole liveweight. For example, Noblet et al. rates of turnover were similar. Against this back-(1998) reported a significantly lower FHP per unit of ground it is biologically unreasonable to expect liveweight in fat than lean pigs of different breeds. maintenance to be directly related to scaled While this finding could partially be due to breed liveweight when the composition of the body may differences, a similar result has been obtained be- vary.
techniques can be used to indirectly predict body fat expensive process (four phosphate bonds required and protein masses. For example, the ultrasonic per molecule urea synthesis) (Martin and Blaxter, scanning technique can be used to measure the back 1965).
fat thickness of an animal (Ferris et al., 1999a). The Dietary fibre concentration can also influence k ,m
prediction of body protein mass can also be derived because kmis predicted from energy metabolisability from slaughter techniques. Fat-free mass of dairy in the UK ME system. Increasing fibre concen-cows was reported to be similar during the dry trations in diets can reduce energy metabolisability period, early and late lactation stages (Andrew et al., by reducing energy digestibility (Flatt et al., 1969b; 1994). Protein mass of cattle is curvilinearly related Beever et al., 1988) and increasing methane energy to their liveweight and liveweight is the best single output as a proportion of total DE intake (Yan et al., predictor of body protein mass (Wright and Russel, 1999). The effects of dietary fibre fraction on 1984). Gibb and Ivings (1993) reported a linear maintenance metabolic rate and kmcan thus result in relationship between body protein mass (P) and a higher MEm for a high compared to a low fibre liveweight (LW) for Holstein–Friesian cows (P5 diet. This has been demonstrated in a number of 0.0997 LW122.37), but cow body condition is not studies with lactating dairy cows (Flatt et al., 1969b; considered in this equation. Tyrrell and Moe, 1972; Yan et al., 1997a) and with beef cattle (Beever et al., 1988; Reynolds et al., 2.3.2. Dietary concentration of fibre fraction 1991a).
All currently used energy systems for cattle
as-sume that dietary fibre concentration has no effect on 2.3.3. Grazing activity
1990). The increase in NEm cost for grazing would For individual calorimetric studies, k has oftenl
be greater (0.30–0.40) under extensive grazing con- been determined by assuming a MEmvalue which is ditions, since the animals would spend more time deducted from ME intake to provide the ME avail-eating and walking (Langlands et al., 1963). In able for production (ME ), and then relating this top
addition, lactating dairy cows grazing on pasture are adjusted milk energy output (El( 0 ), kl5El( 0 )/ ME ).p
usually required to walk a distance twice a day for The kl estimated from this approach is thus in-milking. The energy costs for walking are suggested fluenced by the accuracy of ME . Using this meth-m
to be 2.0 or 28 kJ / kg liveweight per km for od, and MEm of AFRC (1990), k values have oftenl
horizontal and vertical movement, respectively for been estimated to be low (0.50–0.58) with data of cattle (ARC, 1980). Brody (1945) suggested a dairy cows given diets based on either grass silage proportionately 0.08 increase in maintenance energy (Unsworth et al., 1994; Gordon et al., 1995; Yan et requirement for each km of walking. al., 1996; Ferris et al., 1999b), or maize silage or NRC (1988) recommend a proportionately 0.10 whole crop wheat (Beever et al., 1998; Sutton et al., increase in maintenance allowance for cows grazing 1998a,b, 1999). However, the above k values couldl
on good pasture and up to 0.20 on sparse pasture. be increased (0.59–0.65, mean of 0.62) by using a
0.75
SCA (1990) suggest that increases in maintenance MEm of 0.62 MJ / kg , as obtained from Eqs. (1) requirement for grazing cows are in a range of and (2). The latter mean k (0.62) is similar to thatl
0.10–0.20 in intensive grazing conditions, to approx- (0.64) predicted from AFRC (1990) (kl50.35?ME / imately 0.50 for animals grazing extensive, hilly GE10.42) using ME / GE obtained in these studies. pastures where they walk considerable distances to A further method has been adopted by some preferred grazing areas and to water. However, these workers (mainly in Germany), in which k is derivedl
allowances are not included in the current UK ME as a proportion of NE of total ME intake, where NE system (AFRC, 1993) and there is a requirement to is the sum of milk energy, retained energy multiplied address this deficiency in the future. by a constant and assumed NE . However, them
efficiency calculated using this method is a mixture of efficiencies of ME utilisation for lactation (k ) andl
3. Efficiency of ME utilisation maintenance (k ).m
3.1. Methods of estimating the efficiency of ME 3.2. Effects of dietary nutrients on the efficiency of
utilisation for lactation ME utilisation for lactation
The efficiency of ME utilisation for lactation (k )l The composition of a diet can shift the microbial can be determined using a range of regression population in the rumen and consequently influence techniques on large sets of calorimetric data. In the the production of VFAs. In general a high fibre diet literature two regression equations have often been produces VFAs with a high proportion of acetic acid, used; i.e., the linear regression relating milk energy while a concentrate diet normally generates more output (adjusted to zero energy balance) to ME propionic acid. It has been well documented that intake, and the multiple regression relating ME VFAs produced in the rumen can influence milk intake to metabolic liveweight, milk energy output composition, i.e. molar proportions of acetic and and energy balance. Using these two methods the butyric acids are positively related to milk fat present review would suggest an average k of 0.66,l concentration. The rumen VFAs can also alter energy as presented in Eqs. (1) and (2), derived from partition between milk and body tissue. A number of calorimetric data of dairy cows drawn from 42 feeding studies (e.g., Flatt et al., 1969a; Sutton et al., studies from across the world. This value is within 1993) and infusion trials (e.g., Ørskov et al., 1969; the range of k values (0.60–0.67), as presented inl Huhtanen et al., 1993) have demonstrated that in-Table 2, which were derived from regression tech- creasing propionic acid proportion can result in more niques reported in a number of studies with dairy energy partitioned into body tissue and less into
occur when the absorption of propionic acid exceeds the capacity of the liver to handle it (Ørskov and MacLeod, 1990). Some propionic acid can thus enter the peripheral circulation and stimulate the pancreas to secret insulin, so leading to utilisation of energy for tissue synthesis and depression of the cow’s milk yield and milk fat production (Ørskov and MacLeod, 1990).
The effects of VFAs produced in the rumen on energy utilisation have been studied extensively in sheep and steers. The results are not conclusive, with some workers reporting a lower efficiency of utilisa-tion of energy derived from acetic acid for body tissue synthesis, while others noting equal efficien-cies between acetic and propionic acids (Tyrrell et al., 1979; Ørskov and Ryle, 1990). The research on
Fig. 2. Relationship between forage proportion and k calculatedl
the influence of VFAs production on k with lactat-l with the ME of AFRC (1990) using calorimetric data of dairy
m
ing dairy cows is limited, but there is no evidence cows published since 1976. indicating a relationship between k and the molarl
proportion of acetic or propionic acid produced in the rumen. For example, the infusion of different
proportions of acetic and propionic acids into the Increasing fibre concentration in diets can increase rumen of lactating dairy cows has shown no effect the MEm of cattle as discussed previously. It there-on kl (Ørskov et al., 1969) or heat production fore suggests that the lower animal performance with (Ørskov and MacLeod, 1982). The infusion of acetic high forage diets may be a reflection of a higher acid either showed little effect on heat production of ME , leaving less energy available for production,m
dry dairy cows offered forage-only diets, although rather than that the high forage diet results in a lower the efficiency of utilisation of additional energy from k . This would be suggested by the findings of Yan etl
infusion of acetic acid varied with composition of al. (1997a) who showed that increasing dietary basal diets (Tyrrell et al., 1979). proportion of grass silage increased MEm but had no
The k obtained using the linear regression tech-l significant effect on k in lactating dairy cows.l
nique on large sets of calorimetric data also indicates
little differences with forage proportions in diets. In 3.3. Effect of cow genetic merit on the efficiency a single experiment Flatt et al. (1969b) observed of ME utilisation for lactation
similar k values when alfalfa proportions in dietsl
were increased from proportionately 0.2 to 0.6. Yan Dairy herds in the British Isles have been undergo-et al. (1997a) pooled data from 221 cows across ing a period of rapid increase in cow genetic merit experiments and reported that k values were notl since the mid 1980s, with Coffey (1992) reporting influenced significantly by the proportion of grass current rates of genetic gain of proportionately 0.013 silage in the diet. The data (experiment mean) used per year in milk fat plus protein yield for the indexed to develop Eqs. (1) and (2) have been used by the population in UK and Ireland. This increase is present authors to examine the relationship between approximately 4.5 kg / year of fat plus protein yield, a forage proportion in diets and k calculated usingl value which is about 62 kg / year of milk yield when
0.75
either MEm of AFRC (1990) or 0.62 MJ / kg assuming milk of standard composition (Agnew et derived from Eqs. (1) and (2). The result indicates al., 1998). It has been reported extensively that gross no relationship between forage proportion and kl energetic efficiency (milk energy output as a propor-values when using either the former MEm(Fig. 2) or tion of ME intake) is higher with high than low
lactation (e.g., Grainger et al., 1985b; Gordon et al., with which ME is utilised for lactation between 1995; Ferris et al., 1999b). The magnitude of this Holstein and Jersey cows.
increase in the efficiency was higher in multiple The discrepancy in effect of cow genetic merit on lactation than first lactation cows (Veerkamp et al., gross energetic efficiency and k may partially bel
1994). However, when tissue energy retention and derived from the difference in MEp between high MEmare taken into account, the partial efficiency for and low genetic merit cows. The main factor may lactation (k ) appears to be similar between high andl however be because high genetic merit cows have low genetic merit cows. The difference in milk the ability to shift the partition of ME absorbed, i.e. energy output between high and low genetic merit more into milk and less into body tissue. A number cows could almost entirely be explained by differ- of long term feeding studies have demonstrated this ences between genotypes in energy intake and tissue effect (Grainger et al., 1985a; Gordon et al., 1995). energy retention (Grainger et al., 1985b). When using An example of this is illustrated in Fig. 3, as reported the equations of AFRC (1990) to estimate ME ,m by Veerkamp et al. (1994) and Veerkamp and Em-neither Gordon et al. (1995) nor Ferris et al. (1999b) mans (1995), which showed that high genetic cows detected any significant difference in kl between had a higher gross energetic efficiency and a lower high, medium and low genetic merit cows. Veerkamp energy retention than low genetic cows during the and Emmans (1995) in a literature review also first 26 weeks of lactation. Lamb et al. (1977) indicated little difference in the partial efficiency assessed the first lactation of 289 daughters of 17
Holstein sires when the animals were fed according tively by Armstrong and Blaxter (1965), Aguilera et to milk yield and also concluded that the daughters al. (1990) and Rapetti et al. (1998). When using of high genetic merit bulls used less nutrient intake regression techniques on calorimetric data of lactat-for body gain and more lactat-for milk production. The ing dairy cows, Flatt et al. (1969b) and Van Es et al. difference in partition of ME between high and low (1970) found that ME was utilised no less efficiently genetic merit cows is associated with insulin con- for concomitant tissue retention than for milk secre-centration in blood. During early lactation insulin tion. The above findings indicate that during lacta-concentration was significantly higher in the plasma tion the efficiency of ME utilisation for concomitant of low genetic merit cows, that were in energy tissue retention would appear to be similar to that for surplus and gaining body weight, than in high lactation, although Moe et al. (1970) reported that genetic merit cows that were in energy deficit and ME was more efficiently utilised for concomitant losing liveweight (Hart, 1983). The difference in tissue retention than for lactation in dairy cows. insulin concentration disappeared when the animals
stopped lactating (Hart, 1983).
3.4.3. Efficiency of utilisation of mobilised tissue
energy for lactation
3.4. Energetic efficiency for liveweight gain or
The efficiency of utilisation of mobilised tissue
from mobilised tissue energy for lactation
energy for lactation was recommended by ARC (1980) to be 0.84. This value was obtained by Moe 3.4.1. ME use for production during lactation vs.
and Flatt (1969) from regression analysis of
during dry period
calorimetric data (n5126) of lactating dairy cows in It has been suggested that the utilisation of ME for
negative energy balance. There has however been milk production (adjusted to zero energy balance)
little new information available in the literature on (k ) in lactating cows is more efficient than that forl
this aspect since then. During the period from 1992 tissue retention (k ) in dry cows (ARC, 1980). In ag
to 1998, a large number of lactating dairy cows were recent study at this Institute a forced drying off
subject to gaseous exchange measurements in procedure was adopted to study how the efficiency of
calorimetric chambers at this Institute, of which 127 ME changed with physiological state of the animal
cows were in negative energy balance. These 127 (Yan et al., 1997b). A reduction in milk energy of 1
data were used to develop similar multiple regression MJ / day with lactating cows was found to be
associ-equations to those adopted by Moe and Flatt (1969). ated with an increase in tissue energy retention of
The equations are presented as below 0.82 MJ / day with dry cows. When relating to MEp
(ME intake2ME ), the efficiency (k ) for lactatingm l
cows can be proportionately 0.09 higher than that MEI51.474( 0.0552 )El11.067( 0.0891 )Eg
(k ) for dry cows. A similar reduction (0.11) withg 2
10.745 R 50.85 (3)
dry dairy cows was also reported by Moe et al. ( 0.0309 )
(1970) using multiple regression techniques on calorimetric data of dairy cattle (n5543).
El50.578( 0.0216 )MEI20.749( 0.0467 )Eg
3.4.2. ME use for lactation vs. for concomitant 2
20.359( 0.0330 ) R 50.90 (4)
tissue retention
Yan et al. (1997b) observed an increase in tissue
energy retention of 0.96 MJ / day associated with a where MEI, E and E are, respectively ME intake,l g 0.75
4. Energy value per unit of liveweight change (Bath et al., 1964; Reid and Robb, 1971; Tamminga et al., 1997). Protein mobilisation is stopped at about Energy value per unit of liveweight change for 4 weeks after calving, while fat mobilisation is not lactating dairy cows is fixed in NRC system and each stopped at 8 weeks (Tamminga et al., 1997). This of European systems, but varies with a range be- may be due to a considerable hypertrophy of both tween 19 and 30 MJ / kg of liveweight change. A gut and liver during early lactation in response to number of recent studies have reported different increased feed intake (Reynolds and Beever, 1995). energy values within the above range (Chilliard et The composition of mobilised tissue (fat and protein) al., 1991; Gibb et al., 1992; Tamminga et al., 1997). can thus differ during the first 4 weeks of lactation, The reason for this discrepancy may be attributed to i.e. the ratio of fat-to-protein would increase. If the the effects of body condition and lactation stage. water content in the mobilised tissue is assumed to Body condition factors have been recognised to remain unchanged, the energy value per unit of influence the energy value of liveweight change. liveweight loss would be higher as lactation pro-These factors include gain or loss of body fat or gresses. On the other hand, energy balance is not protein, replacement of body fat with water and always related to liveweight change of dairy cows. changes in gut fill. The lack of precision in these Beever et al. (1998) reported that high genetic merit factors can result in errors in ration formulation and cows were still in negative energy balance at 20 the prediction of animal performance, especially in weeks of lactation, but liveweight of the animals was early and late lactation when liveweight change of maintained after 5 weeks. This can be partially dairy cattle can be large. It may not be realistic in explained by the findings of Tamminga et al. (1997) practice to distinguish the effects of gut fill on gain as changes in the water content in mobilised or loss of liveweight and how much water is liveweight. The total water loss was proportional to contained in the weight of change. However, a the mobilised liveweight during the first 4 weeks of number of studies have related the energy value of lactation. Afterwards the animals retained water in liveweight change to body condition. In a serial their bodies and liveweight loss was very small, but slaughter study with Holstein–Friesian cows, Gibb energy loss was still high (Tamminga et al., 1997). and Ivings (1993) reported that the body fat and Energy value per unit of mobilised liveweight thus energy contents of animals were positively related to increased substantially from 1 to 8 weeks of lactation their liveweight and condition score and body protein (Tamminga et al., 1997).
content was positively related to their liveweight. The fixed energy value for liveweight change in Fat-free mass of Holstein cows remains similar NRC system and European systems is therefore during the dry period, early and late lactation stages, incorrect and can result in errors in practice, espe-while water content of fat-free mass is greater during cially for high genetic merit cows which have a high the dry period and early lactation than late lactation liveweight loss during early lactation. There is a stages (Andrew et al., 1994). These relationships are need to develop more appropriate measures of reflected in the Cornell net carbohydrate and protein energy status in dairy cows. If liveweight change system (Fox et al., 1992). In this system the energy continues to be used as an index of tissue energy concentration per condition score is linearly and change, it must be related to both body condition and positively related to body condition score and stage of lactation.
liveweight of dairy cattle. In Australia a linear regression equation for dairy cattle has been
de-veloped to relate the energy value of liveweight 5. Validation of the UK ME system and other
change to body condition score (SCA, 1990). energy systems
Another factor affecting energy value per
1). The energy systems examined include the UK 1
2
]
ME system (AFRC, 1990 and 1993), the Australian MSPE5
O
(A2P) (5)n
ME system (SCA, 1990), the American NE system
] ] 2 2 2 2 2
(NRC, 1988) and the Dutch NE system (Van Es, MSPE5(A2P) 1S (12b) 1S (12R ) (6)
P A
1978). AFRC (1993) is a working version of AFRC
(1990) which adds a proportionately 0.05 to total where n is the number of pairs of values of A and P
] ]
ME requirement predicted from AFRC (1990). The compared (n542); A and P are, respectively, the
2 2
Dutch NE system was chosen to represent a range of means of A and P; SP and SA are, respectively, the the NE systems based on the principles proposed by variances of A and P; b and R are, respectively, the Van Es (1975), e.g. used in France (INRA, 1989), slope and correlation coefficient of the linear regres-the Neregres-therlands (Van Es, 1978), Switzerland (Bickel sion of A on P. The three components are thus due to
] ]
and Landis, 1978) and Germany (Deutschen Land- mean bias (A2P), line bias (the deviation of the
wirtschafts Gesellschaft, 1982). The American NE slope) and random variation of the slope. In order to system (NRC, 1988) does not provide any method to compare the accuracy of prediction between ME and calculate intake of NE for lactation (NEL) from its NE systems, the MSPE is expressed as the mean
]]
Œ ¯
ME intake, so the observed NEL intake in the prediction error (MPE5 MSPE /A ).
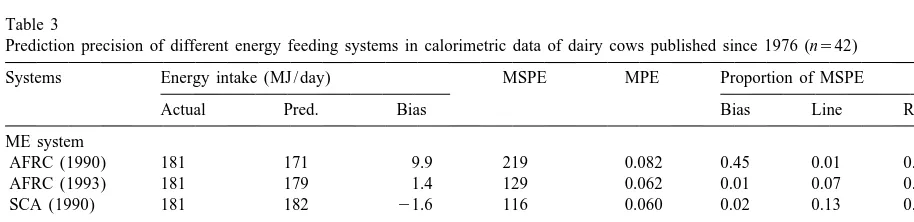
present validation for the NRC system is based on The results of the present validation are presented the equation of Moe (1981) (NEL50.697 ME2 in Table 3 and Fig. 4a and b. The MPE was much 0.877, MJ / kg DM). The predicted NEL requirement higher with AFRC (1990) than the other three in Van Es (1978) and NRC (1988) is a sum of systems (Van Es, 1978; NRC, 1988; SCA, 1990), predicted NEm and observed E and E . The pre-l g indicating that AFRC (1990) is the least accurate at dicted ME requirement is a sum of predicted NEm predicting total energy requirements of lactating and observed E and E divided by relevant energeticl g dairy cows. The predicted error of AFRC (1990) was efficiencies. In both the ME and NE systems E wasg largely derived from an under-prediction of total] ] treated as, if E was positive then it was added; if Eg g energy requirement (mean bias, A2P), which
re-was negative then it re-was subtracted after multiplica- sulted in a large proportion of mean bias over total tion by either 0.80 (Van Es, 1978), 0.82 (NRC, MSPE. However, when a proportionately 0.05 was 1988), or 0.84 (AFRC, 1990; SCA, 1990). added to total ME requirement predicted in AFRC The model, used to compare those energy systems (1990), as suggested by AFRC (1993) (currently for actual energy (ME or NE) intake (A) and adopted in UK), total energy requirements were predicted energy requirement (P), is the mean-square predicted with a similar accuracy to NRC (1988) and prediction error (MSPE) as described by Rook et al. SCA (1990). Van Es (1978) had a marginally higher (1990). The MSPE is defined as Eq. (5) and can be MPE than NRC (1988), SCA (1990) and AFRC regarded as the sum of three components (Eq. (6)) (1993). The higher prediction error for Van Es
Table 3
Prediction precision of different energy feeding systems in calorimetric data of dairy cows published since 1976 (n542)
Systems Energy intake (MJ / day) MSPE MPE Proportion of MSPE
Actual Pred. Bias Bias Line Random
ME system
AFRC (1990) 181 171 9.9 219 0.082 0.45 0.01 0.54
AFRC (1993) 181 179 1.4 129 0.062 0.01 0.07 0.92
SCA (1990) 181 182 21.6 116 0.060 0.02 0.13 0.85
NE system
Van Es (1978) 110 106 3.6 56 0.068 0.23 0.03 0.74
likely to be the ME . This can be demonstrated inm
the validation of SCA (1990) which uses the same kl
as AFRC (1990) but a higher MEm by adjusting it with total ME intake. There is no basis to compare the validation between ME and NE systems, since in the 2 NE systems km is assumed to be same as k tol
calculate NEL. However, this assumption is not biologically correct, because research evidence has indicated that km was higher than k . The differencel
between kmand k is calculated to be 0.12 or 0.08 inl
Van Es (1975) or ARC (1980) when ME / GE ratios are from 0.55 to 0.70. The assumption that km is equal to k in both Van Es (1978) and NRC (1988)l
could thus cover the under-prediction of NE used inm
these two systems, because the metabolic rates, as discussed previously, are similar between Van Es (1978), NRC (1988) and AFRC (1990). This bias would be larger for late-lactating and dry cows because the ratios of ME / MEI is higher at thesem
two stages. Nevertheless, the more accurate predic-tion of NRC (1988) than Van Es (1978) mainly reflects that the former adds an activity allowance of 0.10.
6. Conclusions
The present review has highlighted a number of concerns in the energy metabolism of dairy cows. Recent studies have shown a higher MEm for the Fig. 4. Relationship between actual energy intake and predicted cattle of today (probably reflecting an improvement energy requirement (AFRC, 1990, 1993; SCA, 1990) using
in cow genetic merit), the influence of dietary fibre experiment mean data (n542) published since 1976 (broken line
concentration and grazing activity on ME and a
y5x). m
relationship between MEm and body protein mass (heat production is a function of protein mass). The ] ]
(1978) was attributed to a higher mean bias (A2P) k is relatively stable over a number of dietary (fibrel
and consequently a higher proportion of mean bias concentration) and animal (cow genetic merit)
fac-over total MSPE. tors. The energy value per unit of liveweight change
The addition of a proportionately 0.05, as adopted varies with body condition and stage of lactation. by AFRC (1993), to total ME requirement predicted These effects are important for dairy cattle feeding by AFRC (1990) is however questionable. The mean and should therefore be incorporated in the future
k predicted from AFRC (1990) was 0.63, which isl revision of an energy feeding system. close to the mean k values presented in Table 2 andl
obtained in Eqs. (1) and (2) using the same set of
data as the present validation. The ME requirements Acknowledgements
for lactation and liveweight change predicted from
Appendix 1 Gordon F.J. et al., 1995. Animal Sci. 61: 199–210. Gordon F.J., Porter, M.G., Mayne, C.S., Unsworth The calorimetric data (experiment mean) in the E.F., Kilpatrick D.J., 1995. The effect of forage following studies were used in the present review to digestibility and type of concentrate on nutrient develop Eqs. (1) and (2), to calculate k in Fig. 2 andl utilisation for lactating dairy cattle. J Dairy Res. to validate the current energy feeding systems. The 62:15–27.
references, for which the first author’s name and Gordon, F.J. The effect of degree of wilting of journal are only presented, have been presented in grass prior to ensiling on the performance and energy the reference section. and nitrogen utilisation by dairy cattle. Personal
Agnew, R.E., Gordon, F.J., Kilpatrick, D.J., Yan, communication.
T., Porter, M.G., 1999. The effect of incremental Hayasaka K. et al., 1995. Animal Sci. Technol. changes in metabolisable energy intake on the parti- 66:374–382. (Two sets of data for early and mid-late tioning of metabolisable energy in dairy cows. In: lactation were used).
Proceedings of the British Society of Animal Science Holter J.B., Hayes, H.H., Urban, W.E., Duthie, 1999, p. 31 (abstract). A.H., 1992. Energy balance and lactation response in Beever, D.E., et al. in: McCracken, K., Unsworth, Holstein cows supplemented with cottonseed with or E.F., Wylie, A.R.G., Energy Metabolism of Farm without calcium soap. J Dairy Sci. 75:1480–1494. Animals, 1998, 359-363, CAB International, Wallin- Holter J.B., Slotnick, M.J., Hayes, H.H., Bozak,
gford. C.K., Urban, W.E., McGilliard, M.L., 1990. Effect of
Beever, D.E., Sutton, J.D., Cammell, S.B., Haines, prepartum dietary energy on condition score, post-M.J., Spooner, M.C., Harland, J.I., 1991. Energy partum energy, nitrogen partitions, and lactation balance for dairy cows given grass silage with either production responses. J Dairy Sci. 73:3502–3511. barley or molassed sugar beef feed in the concen- Janicki F.J., Holter, J.B., Hayes, H.H. 1985. trates. Animal Sci. 52:573–574 (abstract). Varying protein content and nitrogen solubility for Birkelo, C.P., Brouk, M.J., Schingoethe, D.J. 1994. pluriparous, lactating Holstein cows: Digestive per-The effect of wet corn distillers grain on energetic formance during early lactation. J Dairy Sci. efficiency of lactating cows. In: J.F. Aguilera 68:1995–2008.
¨
(Editor), Energy Metabolism of Farm Animals, Jilg T., Susenbeth, A., Ehrensvard, U., Henke, European Association for Animal Production Publi- K.H. 1987. Effect of treatment of soya beans on
´
cation No. 76, pp. 183–186, Mojacar, Spain. energy and protein metabolism of lactating dairy Carrick, I.M., Patterson, D.C., Gordon, F.J., cows. In: P.W. Moe, H.F. Tyrrell, P.J. Reynolds Mayne, C.S. 1996. The effect of quality and level of (Editors), Energy metabolism of farm animals. Euro-protein on the performance of dairy cattle of differ- pean Association for Animal Production, Publication ing genetic merits, Animal Sci. 62: 642. Abstract No. 32, p. 354–357, Airlie, Virginia, USA.
Cushnahan A., Mayne, C.S., Unsworth, E.F., Keady T.W.J., Mayne, C.S., 1998. The effects of 1995. Effects of ensilage of grass on performance concentrate energy source on silage feeding behav-and nutrient utilisation by dairy cattle. 2. Nutrient iour and energy utilisation by lactating dairy cows metabolism and rumen fermentation. Animal Sci. offered grass silages with different intake
charac-60:347–359. teristics. Animal Science67:225–236.
¨
Ferris C.P. et al., 1999b. J Ag Sci., Cambridge Kirchgebner M., Muller, H.L., Schwab, W. 1982.
132, 483–490. Experimental studies on the feeding frequency of
¨
Gadeken D., Rohr, K., Lebzien, P. 1991. Effects of dairy cows. In: A. Ekern and F. Sundstøl (Editors), nitrogen fertilising and of harvest season on net Energy Metabolism of Farm Animals, European
¨
energy values of hay in dairy cows. In: A. Schurch, Association for Animal Production Publication No C. Wenk (Editors), Energy metabolism of farm 29, pp. 30–33, Agricultural University of Norway, animals. European Association for Animal Product- Norway.
¨
ion, Publication No. 13, pp. 321–324, Vitznau, Kirchgebner M., Schwab, W., Muller, H.L. 1989.
metabo-lism in lactating cows in long-term administration. Sutton J.D. et al., 1998b. Animal Sci. 67:203–212. In: Y. van der Honing and W.H. Close (Editors), Sutton J.D. et al., 1999. In: Proceedings of the Energy Metabolism of Farm Animals, European British Society of Animal Sci. 1999, 32 (abstract). Association for Animal Production Publication No Terada F., Muraoka, M. 1994. Effect of heat stress 43, pp. 143–146, Pudoc, Wageningen. on the efficiency of utilisation of metabolisable Kirkland R.M., Gordon, F.J., 1999. Metabolisable energy for lactation. In: J.F. Aguilera (Editor), energy requirements of lactating dairy cows offered a Energy Metabolism of Farm Animals, European straw / concentrate ration. In: Proceedings of the Association for Animal Production Publication No
´
British Society of Animal Sci. 1999, p.33 (abstract). 76, pp. 323–326, Mojacar, Spain.
Mayne, C.S., Effects of dietary protein source and Tyrrell H.F., Brown, A.C.G., Reynolds, P.J., Haa-level on energy metabolism of lactating dairy cows. land, G.L. 1982. Effect of growth hormone on Personal communication. utilisation of energy by lactating Holstein cows. In: Moe P.W., Tyrrell, H.F., 1977. Effects of feed A. Ekern, F. Sundstøl (Editors), Energy Metabolism intake and physical form on energy value of corn in of Farm Animals, European Association for Animal timothy hay diets for lactating cows. J. Dairy Sci. Production Publication No 29, pp. 46–49,
Agricul-60:752–758. tural University of Norway, Norway.
Moe P.W., Tyrrell, H.F., 1979. Effect of endo- Tyrrell H.F., Moe, P.W., 1980. Effect of protein sperm type on incremental energy value of corn level and buffering capacity on energy value of feeds grain for dairy cows. J. Dairy Sci. 62,447–454. for lactating dairy cows. In: L. Mount (Editor),
¨
Munger, A. 1991. Milk production efficiency in Energy Metabolism of Farm Animals, European dairy cows of different breeds. In: C. Wenk, M. Association for Animal Production Publication No Boessinger (Editors), Energy Metabolism of Farm 26, pp. 311–313, Butterworths, London.
Animals, European Association for Animal Product- Tyrrell H.F., Varga, G.A. 1987. Energy value for ion Publication No 58, pp. 292–295, Kartause Itting- lactation of rations containing ground whole ear en, Switzerland. (Three sets of data for Holstein / maize or maize meal both conserved dry or ensiled at Friesian, Jersey and Simmental were used). high moisture. In: P.W. Moe, H.F. Tyrrell, P.J. Patle B.R., Mudgal, V.D. 1977. Utilisation of Reynolds (Editors), Energy metabolism of farm dietary energy for maintenance, milk production and animals. European Association for Animal Product-lipogenesis by lactating crossbred cows during their ion, Publication No. 32, p. 306–309, Airlie, Virginia, midstage of lactation. Br. J Nutr. 37:23–33. USA.
Sutter F., Bickel, H., Wenk, C. 1991. Energy and Unsworth, E.F. 1991. The efficiency of utilisation protein metabolism at the onset of lactation in dairy of metabolisable energy for lactation from grass cows. In: C. Wenk, M. Boessinger (Editors), Energy silage-based diets. In: C. Wenk, M. Boessinger Metabolism of Farm Animals, European Association (Editors), Energy metabolism of farm animals. Euro-for Animal Production Publication No 58, pp. 337– pean Association for Animal Production, Publication 340, Kartause Ittingen, Switzerland. No. 58, pp. 329–332, Kartause Ittingen, Switzerland. Sutton J.D., Cammell, S.B., Beever, D.E., Haines, Van Es, A.J.H., Van Der Honing, Y. 1976. Energy M.J., Spooner, M.C., Harland, J.I. 1991. The effect and nitrogen balances of lactating cows fed fresh or of energy and protein sources on energy and protein frozen grass. In: M. Vermorel (Editor), Energy Me-balances in Friesian cows in early lactation. In: C. tabolism of Farm Animals, European Association for Wenk, M. Boessinger (Editors), Energy Metabolism Animal Production Publication No 19, pp. 237–240, of Farm Animals, European Association for Animal Vichy, France.
¨
Production Publication No 58, pp. 288–291, Kar- Windisch, W., Kirchgebner, M., Muller, H.L. tause Ittingen, Switzerland. 1991. Effect of different energy supply on energy Sutton J.D. et al., 1998a. In: McCracken, K., metabolism in lactating dairy cows after a period of Unsworth, E.F., Wylie, A.R.G. (Editors), Energy energy restriction. In: C. Wenk, M. Boessinger Metabolism of Farm Animals, pp. 387–390. CAB, (Editors), Energy Metabolism of Farm Animals,
Publi-Wylie, A.R.G. (Eds.), Energy Metabolism of Farm Animals. cation No 58, pp. 304–307, Kartause Ittingen,
Swit-CAB, Wallingford, pp. 359–363. zerland.
Bickel, H., Landis, J., 1978. Feed evaluation for ruminants. 3. Yan, T. et al., 1997b. Livest. Prod. Sci. 52:177– Proposed application of the new system of energy evaluation in
186. Switzerland. Livestock Prod. Sci. 5, 367–372.
Birkelo, C.P., Johnson, D.E., Phetteplace, H.P., 1991. Maintenance Yan, T. et al., 1996. Animal Sci. 62:405–417.
requirements of beef cattle as affected by season on different planes of nutrition. J. Animal Sci. 69, 1214–1222.
Birnie, J.W., 1999. Factors affecting the fasting heat production of non-lactating dietary cattle. Ph.D. Thesis, The Queen’s
Uni-References
versity of Belfast, Belfast, UK.
Blaxter, K.L., 1962. The Energy Metabolism of Ruminants. Adam, I., Young, B.A., Nicol, A.M., Degen, A.A., 1984. Energy Charles C. Thomas, Springfield, IL.
cost of eating in cattle given diets of different form. Animal Brody, S., 1945. Bioenergetics and Growth. Reinhold, New York. Prod. 38, 53–56. Carstens, G.E., Johnson, D.E., Johnson, K.A., Hotovy, S.K., Agnew, R.E., Yan, T., Gordon, F.J., 1998. Nutrition of the high Szymanski, T.J., 1989. Genetic variation in energy expendi-genetic merit dairy cow-energy metabolism studies. In: tures of monozygous twin beef cattle at 9 and 20 months of Garnsworth, P.C., Wiseman, J. (Eds.), Recent Advances in age. In: van der Honing, Y., Close, W.H. (Eds.), Energy Animal Nutrition. Nottingham University Press, Nottingham, Metabolism of Farm Animals. European Association For pp. 181–208. Animal Production, Publication No. 43. Pudoc, Wageningen, Agricultural and Food Research Council, 1993. Energy and pp. 312–315.
´ ´
Protein Requirements of Ruminants. CAB International, Wal- Chilliard, Y., Cisse, M., Lefaivre, R., Remond, B., 1991. Body
lingford. composition of dairy cows according to lactation stage,
Agricultural and Food Research Council. 1990. Technical Com- somatotropin treatment, and concentrate supplementation. J. mittee on Responses to Nutrients, Report Number 5, Nutritive Dairy Sci. 74, 3103–3116.
Requirements of Ruminant Animals: Energy. Nutrition Ab- Chowdhury, S.A. 1992. Protein utilisation during energy under-stracts and Reviews (Series B) 60: 729-804. nutrition in sheep. Ph.D. Thesis, University of Aberdeen, Agricultural Research Council, 1980. The Nutrient Requirements Aberdeen, UK.
of Ruminant Livestock, Technical Review. CAB, Farnham Chowdhury, S.A., Ørskov, E.R., 1994. Implications of fasting on
Royal. the energy metabolism and feed evaluation in ruminants. J.
Agricultural Research Council, 1965. In: The Nutrient Require- Animal Feed Sci. 3, 161–169.
ments of Farm Livestock, Vol. No. 2, Ruminants. HMSO, Coffey, M., 1992. Genetic trends — has progress been made in
London. the last six years? Holstein Friesian J74, 62–63.
Aguilera, J.F., Prieto, C., Fonolla, J., 1990. Protein and energy Deutschen Landwirtschafts Gesellschaft, 1982. Futterwerttabellen
¨ ¨
metabolism of lactating Granadina goats. Br. J. Nutrition 63, fur Wiederkauer, 5. Erweiterte und neu gestaltete Auflage,
165–175. DLG-Verlag, Frankfurt am Main.
Andrew, S.M., Waldo, D.R., Erdman, R.A., 1994. Direct analysis Ferris, C.P., Gordon, F.J., Patterson, D.C., Mayne, C.S., Kilpat-of body composition Kilpat-of dairy cows at three physiological rick, D.J., 1999a. The influence of dairy cow genetic merit on stages. J. Dairy Sci. 77, 3022–3033. the direct and residul response to level of concentrate supple-Armstrong, D.G., Blaxter, K.L., 1965. Effects of acetic and mentation. J. Ag. Sci., Cambridge 132, 467–481.
propionic acids on energy retention and milk secretion in goats. Ferris, C.P., Gordon, F.J., Patterson, D.C., Porter, M.G., Yan, T., In: Blaxter, K.L. (Ed.), Symposium On Energy Metabolism. 1999b. The effect of genetic merit and concentrate proportion Academic Press, London, pp. 59–70. in the diet on nutrient utilisation by lactating dairy cows. J. Ag. Baldwin, B.R., Forsberg, N.E., Hu, C.Y., 1985. Potential for Sci., Cambridge 132, 483–490.
altering partition in the lactating cow. J. Dairy Sci. 68, 3394– Flatt, W.P., Moe, P.W., Moore, L.A., Hooven, N.W., Lehmann, R.P.,
3402. Ørskov, E.R., 1969a. Energy utilisation by high producing
Bath, D.L., Meyer, J.H., Lofgreen, G.P., Ronning, M., 1964. dairy cows. 1. Experimental design, ration composition, di-Caloric equivalent of live weight loss of dairy cattle. J. Dairy gestibility data and animal performance during energy balance Sci. 48, 374–388. trials. In: Blaxter, K.L., Kielanowski, J., Thorbek, G. (Eds.). Beever, D.E., Cammell, S.B., Thomas, C., Spooner, M.C., Haines, Energy Metabolism of Farm Animals, Vol. No 12. European M.J., Gale, D.L., 1988. The effect of date of cut and barley Association for Animal Production Publication, Warsaw, pp. substitution on gain and on the efficiency of utilisation of grass 221–234.
Fox, D.G., Sniffen, C.J., O’Connor, J.D., Russell, J.B., Van Soest, Ku Vera, J.C., MacLeod, N.A., Ørskov, E.R., 1989. Energy P.J., 1992. A net carbohydrate and protein system for evaluat- exchanges of cattle nourished by intragastric infusion of ing cattle diets: 3. Cattle requirements and diet adequacy. J. nutrients. In: van der Honing, Y., Close, W.H. (Eds.), Energy Animal Sci. 70, 3578–3596. Metabolism of Farm Animals. European Association For Gibb, M.J., Ivings, W.E., Dhanoa, M.S., Sutton, J.D., 1992. Animal Production, Publication No. 43. Pudoc, Wageningen,
Changes in body components of autumn-calving Holstein– pp. 217–274.
Friesian cows over the first 29 weeks of lactation. Animal Prod. Ku Vera, J.C., Ørskov, E.R., Hovell, F.D. Deb., MacLeod, N.A. 55, 339–360. 1987. Effect of small amounts of glucose and different volatile Gibb, M.J., Ivings, W.E., 1993. A note on the estimation of the fatty acid mixture on fasting N excretion in lambs. In: Poppe, body fat, protein and energy content of lactating Holstein– S. (Ed.), The 5th International Symposium on Protein Metabo-Friesian cows by measurement of condition score and live lism and Nutrition. European Association for Animal Pro-weight. Animal Prod. 56, 281–283. duction, Publication No. 35, p. 94, Rostock, Germany. Gill, M., Cammell, S.B., Haines, M.J., France, J., Dhanoa, M.S., Lamb, R.C., Walters, J.L., Anderson, M.J., Plowman, R.D.,
1989. Energy balance in cattle offered a forage diet at sub- Mickelsen, C.H., Miller, R.H., 1977. Effect of sire and maintenance levels. In: van der Honing, Y., Close, W.H. (Eds.), interaction of sire with ration on efficiency of feed utilisation Energy Metabolism of Farm Animals. European Association by Holsteins. J. Dairy Sci. 60, 1755–1767.
For Animal Production, Publication No. 43. Pudoc, Wagening- Langlands, J.P., Gorbett, J.T., McDonald, I., Reid, G.W., 1963. en, pp. 300–303. Estimates of energy required for maintenance by adult sheep. 2. Gordon, F.J., Patterson, D.C., Yan, T., Porter, M.G., Mayne, C.S., Grazing sheep. Animal Prod. 5, 11–16.
Unsworth, E.F., 1995. The influence of genetic index for milk Martin, A.K., Blaxter, K.L., 1965. The energy cost of urea production on the response to complete diet feeding and the synthesis in sheep. In: Blaxter, K.L. (Ed.), Energy Metabolism utilisation of energy and nitrogen. Animal Sci. 61, 199–210. of Farm Animals. European Association For Animal Pro-Grainger, C., Davey, A.W.F., Holmes, C.W., 1985a. Performance duction Publication No 11. Academic Press, London, pp. 83–
of Friesian cows with high and low breeding indexes. 1. Stall 91.
feeding and grazing experiments and performance during the McLeod, K.R., Baldwin, IV R.L., 1998. Influence of energy whole lactation. Animal Prod. 40, 379–388. density and metabolisable energy intake on visceral organ Grainger, C., Holmes, C.W., Moor, Y.F., 1985b. Performance of growth in sheep. In: McCracken, K., Unsworth, E.F., Wylie, Friesian cows with high and low breeding indexes. 1. Energy A.R.G. (Eds.), Energy Metabolism of Farm Animals. CAB, and nitrogen balance experiments with lactating and pregnant, Wallingford, pp. 31–34.
non-lactating cows. Animal Prod. 40, 389–400. Ministry of Agriculture, Fishery and Food, 1975. Energy Allow-Hart, I.C., 1983. Endocrine control of nutrient partition in lactating ances and Feeding Systems For Ruminants. Maff Technical
ruminants. Proc. Nutrition Soc. 42, 181–194. Bulletin No. 33. HMSO, London.
Hayasaka, K., Takusari, N., Yamagishi, N., 1995a. Energy metab- Moe, P.W., 1981. Energy metabolism of dairy cattle. J. Dairy Sci. olism in lactating Holstein cows (in Japanese, with English 64, 1120–1139.
abstract). Animal Sci. Technol. 66, 374–382. Moe, P.W., Flatt, W.P., 1969. Use of body tissue reserves for milk Holmes, C.W., McLean, N.A., Lockyer, K.J., 1978. Changes in the production by the dairy cow. J. Dairy Sci. 52, 928, Abstract.
rate of heat production of calves during grazing and eating. NZ Moe, P.W., Flatt, W.P., Tyrrell, H.F., 1972. The net energy values J. Ag. Sci. 21, 107–112. of feeds for lactation. J. Dairy Sci. 55, 945–958.
Hotovy, S.K., Johnson, K.A., Johnson, D.E., Carstens, G.E., Moe, P.W., Tyrrell, H.F., Flatt, W.P., 1970. Partial efficiency of Bourdon, R.M., Seidel, G.E., 1991. Variation among twin beef energy use for maintenance, lactation, body gain and gestation
¨
cattle in maintenance energy requirements. J. Animal Sci. 69, in the dairy cows. In: Schurch, A., Wenk, C. (Eds.), Energy
940–946. Metabolism of Farm Animals. European Association for
Ani-Huhtanen, P., Miettinen, H., Ylinen, M., 1993. Effect of increasing mal Production, Publication No. 13, Vitznau, pp. 65–68. ruminal butyrate on milk yield and blood constituents in dairy Mulvanny, P.M. 1977. Dairy cow condition scoring. National cows fed a grass silage-based diet. J. Dairy Sci. 76, 1114– Institute for Research in Dairying, paper 4468. Shinfield,
1124. Reading, UK.
Huntington, G.B., 1989. Hepatic urea synthesis and site and rate National Research Council (NRC), 1988. Nutrient Requirements of urea removal from blood of beef steers fed alfalfa hay or a of Dairy Cattle, 6th revised Edition. National Academy Press, high concentrate diet. Can. J. Animal Sci. 69, 215–223. Washington, DC.
Institut National De la Recherche Agronomique (INRA), 1978. In: National Research Council (NRC), 1978. Nutrient Requirements Alimentation des Ruminants. INRA, Versailles, p. 597. of Dairy Cattle, 5th revised Edition. National Academy Press, Institut National De la Recherche Agronomique (INRA). 1989. Washington, DC.
Ruminant nutrition — Recommended allowances and feed Noblet, J., Bernier, J.F., Dubois, S., LeCozler, Y., VanMilgen, J., tables. John Libbey Eurotext, Paris–London–Rome. 1998. Effect of breed and body weight on components of heat Johnson, D.E., Johnson, K.A., Baldwin, R.L., 1990. Changes in production in growing pigs. In: McCracken, K., Unsworth, liver and gastroinstestinal tract energy demands in response to E.F., Wylie, A.R.G. (Eds.), Energy Metabolism of Farm physiological work load in ruminants. J. Nutrition 120, 649– Animals. CAB, Wallingford, pp. 225–228.
criterion for feed evaluation. In: Wiseman, J., Cole, D.J.A. diet forage-to-concentrate ratio and intake on energy metabo-(Eds.), Feedstuff Evaluation. Butterworths, London, pp. 73–90. lism in growing beef heifers: net nutrient metabolism by Ørskov, E.R., Flatt, H.P., Moe, P.W., Munson, A.M., Henken, visceral tissues. J. Nutrition 121, 1004–1015.
R.W., Katz, I., 1969. The influence of ruminal infusion of Rook, A.J., Dhanoa, M.S., Gill, M., 1990. Prediction of the volatile fatty acids on milk yield and composition and energy voluntary intake of grass silages by beef cattle. 3. Precision of utilisation by lactating cows. Br. J. Nutrition 23, 443–453. alternative prediction models. Animal Prod. 50, 455–466. Ørskov, E.R., MacLeod, N.A., 1982. Effect of volatile fatty acid Smith, J.S., Mollison, G.S., 1985. Fasting metabolism,
mainte-composition and protein on energy utilisation and milk com- nance requirements and growth performance of Hereford3
position in cows sustained by intragastric nutrition. In: Ekern, Friesian steers. Animal Prod. 40, 532, Abstract.
A., Sundstøl, F. (Eds.). Energy Metabolism of Farm Animals, Standing Committee on Agriculture (SCA). 1990. Feeding stan-Vol. Publication. 29. European Association for Animal Pro- dards for Australian livestock — Ruminants. CSIRO, Australia. duction, Agricultural University of Norway, pp. 22–25. Sutton, J.D., Cammell, S.B., Beever, D.E., Humphries, D.J., Ørskov, E.R., MacLeod, N.A., 1990. Dietary-induced ther- Phipps, R., 1998a. Treatment of urea-treated whole crop wheat mogenesis and feed evaluation in ruminants. Proc. Nutrition to improve its energy value for lactating dairy cows. In: Soc. 49, 227–237. McCracken, K., Unsworth, E.F., Wylie, A.R.G. (Eds.), Energy Ørskov, E.R., Meehan, D.E., MacLeod, N.A., Kyle, D.J., 1999. Metabolism of Farm Animals. CAB, Wallingford, pp. 387–390. Effect of glucose supply on fasting nitrogen excretion and Sutton, J.D., Cammell, S.B., Beever, D.E., Humphries, D.J., effect of level and type of volatile fatty acid infusion on Phipps, R.H., 1998b. Energy and nitrogen balance of lactating response to protein infusion in cattle. Br. J. Nutrition 81, dairy cows given mixtures of urea-treated whole-crop wheat
389–393. and grass silage. Animal Sci. 67, 203–212.
Ørskov, E.R., Ryle, M., 1990. Energy Nutrition in Ruminants. Sutton, J.D., Cammell, S.B., Beever, D.E., Phipps, R.H., Humph-Elsevier, London. ries, D.J., 1999a. Effect of maize silage maturity on digestibili-Pullar, J.D., Webster, A.J.F., 1974. Heat loss and energy retention ty and energy balance of lactating cows. In: Proceedings of the
during growth in congenitally obese and lean rats. Br. J. British Society of Animal Sci, p. 32, (abstract).
Nutrition 31, 377–392. Sutton, J.D., Morant, S.V., Bines, J.A., Napper, D.J., Givens, D.I., Pullar, J.D., Webster, A.J.F., 1977. The energy cost of fat and 1993. Effect of altering the starch:fibre ratio in the concentrate protein deposition in the rat. Br. J. Nutrition 37, 355–363. on hay intake and milk production by Friesian cows. J Ag. Sci., Ramsey, J.J., Johnson, D.E., Johnson, K.A., 1998. Energy ex- Cambridge 120, 379–390.
penditure and mitochondrial proton leak in lean and obese Tamminga, S., Luteijn, P.A., Meijer, R.G.M., 1997. Changes in strains of rats. In: McCracken, K., Unsworth, E.F., Wylie, composition and energy content of liveweight loss in dairy A.R.G. (Eds.), Energy Metabolism of Farm Animals. CAB, cows with time after parturition. Livestock Prod. Sci. 52,
Wallingford, pp. 27–30. 31–38.
Rapetti, L., Crovetto, G.M., Tamburini, A., Galassi, G., Sandrucci, Toutain, P.L., Toutain, C., Webster, A.J.F., McDonald, J.D., 1977. A., Succi, G., 1998. Some aspects of the energy metabolism in Sleep and activity, age and fatness, and the energy expenditure lactating goats. In: McCracken, K., Unsworth, E.F., Wylie, of confined sheep. Br. J. Nutrition 38, 445–454.
A.R.G. (Eds.), Energy Metabolism of Farm Animals. CAB, Tyrrell, H.F., Moe, P.W., 1972. Net energy value for lactation of a Wallingford, pp. 93–96. high and low concentrate ration containing corn silage. J. Dairy Reeds, P.J., 1989. Regulation of protein turnover. In: Campion, Sci. 55, 1106–1112.
D.R., Hausman, G.J., Martin, R.J. (Eds.), Animal Growth Tyrrell, H.F., Reynolds, P.J., Moe, P.W., 1979. Effect of diet on Regulation. Plenum Press, New York, pp. 183–210. partial efficiency of acetate use for body tissue synthesis by Reid, J.T., Robb, J., 1971. Relationship of body composition to mature cattle. J. Animal Sci. 48, 598–606.
energy intake and energetic efficiency. J. Dairy Sci. 54, 553– Unsworth, E.F., Mayne, C.S., Cushnahan, A., Gordon, F.J., 1994. 563. The energy utilisation of grass silage diets by lactating dairy Reynolds, C.K., 1996. Nutritional requirements of the high genetic cows. In: Aguilera, J.F. (Ed.). Energy Metabolism of Farm merit dairy cow: constraints of feeding grasses and legumes. Animals, Vol. Publication No. 76. European Association for In: Grass and Forage for Cattle of High Genetic Merit. British Animal Production, Mojacar, pp. 179–181.
Grassland Society, Great Malvern. Van Es, A.J.H., 1972. Maintenance. Handbuch der Tierernahrung Reynolds, C.K., Beever, D.E., 1995. Energy requirements and Berlin, Germany
responses: a UK perspective. In: Lawrence, T.L.J., Gordon, Van Es, A.J.H., 1975. Feed evaluation for dairy cows. Livest. F.J., Carson, A. (Eds.), Breeding and Feeding the High Genetic Prod. Sci. 2, 95–107.
Merit Dairy Cow. BSAS Occasional Publication, pp. 31–41, Van Es, A.J.H., 1978. Feed evaluation for ruminants. 1. The
No 19. systems in use from May 1977 onwards in the Netherlands.
Reynolds, C.K., Tyrrell, H.F., Reynolds, P.L., 1991a. Effects of Livest. Prod. Sci. 5, 331–345.
diet forage-to-concentrate ratio and intake on energy metabo- Van Es, A.J.H., Nijkamp, H.J., Vogt, J.E., 1970. Feed evaluation ¨
lism in growing beef heifers: whole body energy and nitrogen for dairy cows. In: Schurch, A., Wenk, C. (Eds.). Energy balance and visceral heat production. J. Nutrition 121, 994– Metabolism of Farm Animals, Vol. Publication No. 13.
Euro-1003. pean Association for Animal Production, pp. 61–64.
vari-ation in energetic efficiency of dairy cows. Livest. Prod. Sci. Yan, T., Gordon, F.J., Agnew, R.E., Porter, M.G., Patterson, D.C., 44, 87–97. 1997a. The metabolisable energy requirement for maintenance Veerkamp, R.F., Simm, G., Oldham, J.D., 1994. Effects of and the efficiency of utilisation of metabolisable energy for interaction between genotype and feeding system on milk lactation by dairy cows offered grass silage-based diets. Livest. production, feed intake, efficiency and body tissue mobilisation Prod. Sci. 51, 141–150.
in dairy cows. Livest. Prod. Sci. 39, 229–241. Yan, T., Gordon, F.J., Ferris, C.P., Agnew, R.E., Porter, M.G., Wright, I.A., Russel, A.J.F., 1984. Estimation in vivo of the Patterson, D.C., 1997b. The fasting heat production and effect chemical composition of the bodies of mature cows. Animal of lactation on energy utilisation by dairy cows offered forage-Prod. 38, 33–44. based diets. Livest. Prod. Sci. 52, 177–186.
Yan, T., Agnew, R.E., Gordon, F.J., Porter, M.G., 2000. The Yan, T., Patterson, D.C., Gordon, F.J., Porter, M.G., 1996. The prediction of methane energy output in dairy and beef cattle effects of wilting of grass prior to ensiling on the response to offered grass silage-based diets. Livest. Prod. Sci. 64, 253– bacterial inoculation. 1. Silage fermentation and nutrient
![Fig. 3. Effects of cow genetic merit of high (—) and low (- - -) on condition score, tissue energy retention and milk energy output as aproportion of Me intake [mean of high and low concentrate levels (from Veerkamp et al., 1994; Veerkamp and Emmans, 1995)].](https://thumb-ap.123doks.com/thumbv2/123dok/1050034.932814/9.612.123.426.319.628/effects-condition-retention-aproportion-concentrate-veerkamp-veerkamp-emmans.webp)