Rice Root Distribution of Four Rice Varieties to
Different Depth of Submergence
Arinal H. I. Nurrahma1), Ahmad Junaedi1*), Heni Purnamawati1) and Jun-Ichi Sakagami2)
1)Faculty of Agriculture, Bogor Agricultural University
Kampus IPB Dramaga Bogor West Java Indonesia
2) Faculty of Agriculture, Tropical Crop Science, Kagoshima University, Kagoshima, Japan *) Corresponding author e-mail: [email protected]
Received: May 26, 2016 /Accepted: September 15, 2016
ABSTRACT
Rice (Oryza sativa L.) is largely cultivated in lowland area that vulnerable to lood occurrence. Root supposed to play an important role on rice tolerance to submergence stress. An experiment which conducted from January to May 2014 in Cikarawang Field Laboratory, Darmaga, Bogor, West Java aimed to study the role of root distribution on rice submergence tolerant. The experiment used Split Plot design replicated three times, with the depth of submergence as main plot and rice variety as subplot. The main plot consisted of water depth of 5 (optimum), 50, 60 and 80 cm from soil surface. The subplot consisted of four rice varieties, namely Ciherang, Inpari 30 (Ciherang Sub1), Indragiri and Margasari. Each plant was planted in a root box (30 cm x 40 cm x 5 cm) which put into container (67 cm x 47 cm x 42 cm) and placed into the pond with water depth as treatment. Submergence started when the plant was 39 Days After Seeding (DAS) for ten days. Observation conducted after the submergence stopped (49 DAS). Result showed that submergence retarded plant growth, root distribution and increase root damage for all rice varieties with the biggest effect on susceptible varieties. Keywords: lash looding; Oryza sativa L.; root box
INTRODUCTION
Rice (Oryza sativa L.) is largely cultivated in the South and South-East Asia which vulnerable to lood occurrence. About 30 % of the total world rice area was covered with rainfed lowland rice which was looded for at least part of the season and rice was often the only choice as a single crop which grown all year (Haefele, Atlin, Kam, & Johnson, 2004). Lowland rice areas are susceptible to temporary submergence which became the major
constraints to the productivity. Recent decades, global climate change has affected the phenomenon of lood cases due to the combinations of increasing rain intensity and durations, precipitations and soil characters. The frequency of rainfall cases has increased in many parts of Asia (Bates, Kundzewicz, Wu, & Palutikof, 2008) such as increasing 3000 mm of rainfall each year in the period September - November in Vietnam (van Drunen, Lasage, & Dorland, 2006) and increasing heavy rainfall events in Krishna Basin, India (Malano et al., 2015).
The enhancement frequency of lood cases in rice cultivation areas need to be considered from related stakeholders to prevent the food scarcity mainly in the countries where rice is the only source of staple food can be growth. There are two approaches for achieving the high yielding plant in the stress environment; rectifying the cultivation methods and improving physiological characters to creates new tolerant variety. Plant physiological features diverge in various type of lood which required details and depth study to jump on the general conclusion. It has been known that rice develops two contrast strategies to deal with lash lood and stagnant lood (Hattori, Nagai, & Ashikari, 2011; Nagai, Hattori, & Ashikari, 2010; Bailey-Serres, Lee, & Brinton, 2012). The plant will inhibit their growth when water covers the plant and regrowth after the water receded in the case of lash looding. This mechanism called as conserve strategy where Sub1A gene played a role (Septiningsih et al., 2014). While stagnant looding requires shoot elongation ability to get the water surface and oxygen access as soon as possible. This contrary mechanism did not support temporary lash looding because their shoot would wilt and die after the lood (Hattori, Nagai, & Ashikari, 2011; Nagai, Hattori, & Ashikari, 2010).
Cite this as: Nurrahma, A. H. I., Junaedi, A., Purnamawati, H., & Sakagami, J. (2017). Rice root distribution of four
rice varieties to different depth of submergence. AGRIVITA Journal of Agricultural Science, 39(2), 119–127. http://doi. org/10.17503/agrivita.v39i2.949
Flood is soon followed by the hypoxia or anoxia where the rice swap towards anaerobic metabolism speciically in roots. Since roots are the plant system which associated with water and nutrient uptake, microbial interaction and other signals related to plant and its environment, then the reduction of plant growth was irstly noticed on abiotic stress. The alteration to hypoxia leads the reactive oxygen species (ROS) simultaneously produce H2O2. The unavailability of oxygen generate the anaerobically induced polypeptides (ANPs) including the rise to ACC, the ethylene biosynthesis precursor. This signal transported from the root to the aerial part of the plant in the shoot. ACC in the presence of oxygen and ACC-oxidase conigure the ethylene. Conversion ACC to ethylene was assumed as the determining factor of tolerance and facilitating plant regulatory function (Irfan, Hayat, S., Hayat, Q., Afroz, & Ahmad, 2010).
The formation of ethylene induced the auxin mediating the aerenchyma formation below the root tip (Irfan, Hayat, S., Hayat, Q., Afroz, & Ahmad, 2010). Aerenchyma is the space between the cell which develop maximum and commonly found in the stem and root of hydrophytic plants. This tissue was very important to the gas exchanges (Mulyani, 2006). The aerenchyma can be formed through lysigenous or schizogenous. The lysigenous process resulted from the cell death (cell death programmed) while schizogenous occured through cell separation during tissue development (Drew, He, & Morgan, 2000; Evans, 2003). It was expected that 15-50 % of the shoot carbohydrates production were carried away to maintain the root growth and development (Lynch, Marschner, & Rengel, 2012). As return, water and nutrients were served by the root to the shoot (Shabala, White, Djordjevic, Ruan, & Mathesius, 2015). Plants must precisely partitionate energy for root growth and nutrient uptake due to plant growth limited resources that used for root growth and function (Lynch, Marschner, & Rengel, 2012).
Rice is widely grown by the farmer in Indonesia using the speciic variety to obtain the best yield in different location and condition. Ciherang is a newly released variety which dominantly cultivated in Indonesian lowland rice area since 2004 (Nurhati, Ramdhaniati, & Zuraida, 2008) while Inpari 30 (Ciherang Sub1) is the next generation from Ciherang vs IR64-Sub1 with the additional tolerant character to lash looding (Septiningsih
et al., 2014). The other common varieties of rice are Indragiri and Margasari which are called as Indonesian swampy rice varieties (Suprihatno et al., 2010). These four rice varieties were used in this experiment to compare the response of rice variety with the Sub1 gene in it or not and also to compare to other local swampy varieties. Adaptation mechanisms may vary in different plant growth stage and varieties. Because of the root is irstly affected by the anaerobic condition, it needed deeply information about its tolerance and susceptible role to submergence stress. This experiment was aimed to study the role of rice root distribution to submergence stress.
MATERIALS AND METHODS
Experiment was conducted in January to May 2014 at Cikarawang Field Laboratory, Darmaga, Bogor, West Java, Indonesia. Microscopic observation of root cross section was done in Chromatography Laboratory, Departement of Agronomy and Horticulture, Bogor Agricultural University. Split plot - Randomized Complete Block Design was used in this experiment with depth of submergence as the irst factor and rice varieties as the second factor. The irst factor as main plot consist of four levels depth of submergence, i.e. 5 cm, 50 cm, 60 cm and 80 cm which measured from the soil surface to the water surface. The second factor as subplot consist of four rice varieties from Indonesian Center for Rice Research (ICRR), including Ciherang, Indragiri, Inpari 30 (Ciherang Sub1) and Margasari. The treatment had 16 combinations with three replications and totaling had 48 experiment units.
The observation measured based on growth components as below:
1. Plant height and number of tillers were measured at 32 and 39 DAS (after the submergence stopped). 2. Number of leaf and leaf area measured after the
submergence stopped using Portable Leaf Area Meter (LI-3000C, USA).
3. Root cross section was observed by cutting 2 cm of root from the tip. Then the root was stored in the plastic with the water inside to keep the root fresh-ness until the observation using a microscope. 4. Root distribution observed based on its zone in
root box. The observation started after the submer-gence stopped. Glass from one side of root box was opened and the root distribution imaged with gridline to difference the root zone 0-10 cm, 10-20 cm, 20-30 cm and 30-40 cm. Root dry weight mea-sured based on depth and radius distribution from the base of clump, they were zona of:
The roots which fused with the soil of each zone separated into pieces. Each piece cleaned in a tub of water to separate the roots, and then the roots were air dried and put into an envelope dried in an oven for 72 hours at 60 ºC.
5. Shoot and root biomass measured using the digital scale.
Data were analysed using analysis of variance (ANOVA). If signiicant, means would be separated by Least Signiicant Difference (LSD) test at P < 0.05. Contrast orthogonal was used to analyse the difference of total root dry weight of each zone.
RESULTS AND DISCUSSION
Plant Growth on Submergence Stress
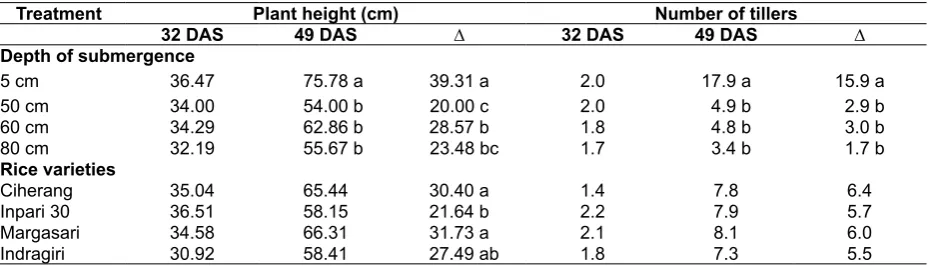
The depth level of submergence reduced plant growth during the experiment conducted. The deeper level of submergence reduced 27.3 % of additional plant height and 81.7 % of the additional number of tiller (Table 1). Submergence also reduced 77 % of the number of leaves from the optimum condition (5 cm) and reduced 90.3 % of leaf area per plant and 64.0 % of leaf area per leaf, however there were no signiicant differences between the depth of 50 cm, 60 cm and 80 cm (Table 2). Reducing plant growth occured due to the changing environment into complete submergence. When the water fully submerged the shoot, delayed of CO2 entry and light penetration to the leaves tended to limit the photosynthetic process (Colmer & Voesenek, 2009).
Inpari 30 had lower growth rate during subergence compare to Ciherang and Margasari, whilst Indragiri had no signiicant difference of growth rate with other varieties (Table 1). Tolerant rice developed the conserve strategy which inhibits its growth during fully lash looding to save the energy and used it to re-grow after the water receded (Hattori, Nagai, & Ashikari, 2011; Nagai, Hattori, & Ashikari, 2010).
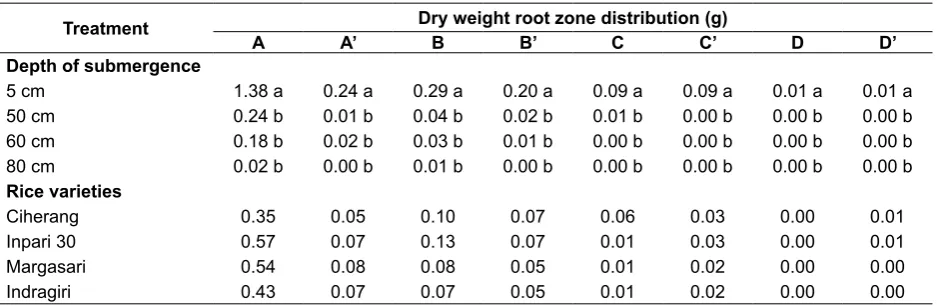
A : depth of 0-10 cm, with radius 0-5 cm A’ : depth of 0-10 cm, with radius 5-15 cm B : depth of 10-20 cm, with radius 0-5 cm B’ : depth of 10-20 cm, with radius 5-15 cm C : depth of 20-30 cm, with radius 0-5 cm C’ : depth of 20-30 cm, with radius 5-15 cm D : depth of 30-40 cm, with radius 0-5 cm D’ : depth of 30-40 cm, with radius 5-15 cm
Treatment Plant height (cm) Number of tillers
32 DAS 49 DAS ∆ 32 DAS 49 DAS ∆
Depth of submergence
5 cm 36.47 75.78 a 39.31 a 2.0 17.9 a 15.9 a
50 cm 34.00 54.00 b 20.00 c 2.0 4.9 b 2.9 b
60 cm 34.29 62.86 b 28.57 b 1.8 4.8 b 3.0 b
80 cm 32.19 55.67 b 23.48 bc 1.7 3.4 b 1.7 b
Rice varieties
Ciherang 35.04 65.44 30.40 a 1.4 7.8 6.4
Inpari 30 36.51 58.15 21.64 b 2.2 7.9 5.7
Margasari 34.58 66.31 31.73 a 2.1 8.1 6.0
Indragiri 30.92 58.41 27.49 ab 1.8 7.3 5.5
Table 1. Plant height and number of tillers observed from rice varieties to various depth of submergence
Shoot and Root Dry Weight
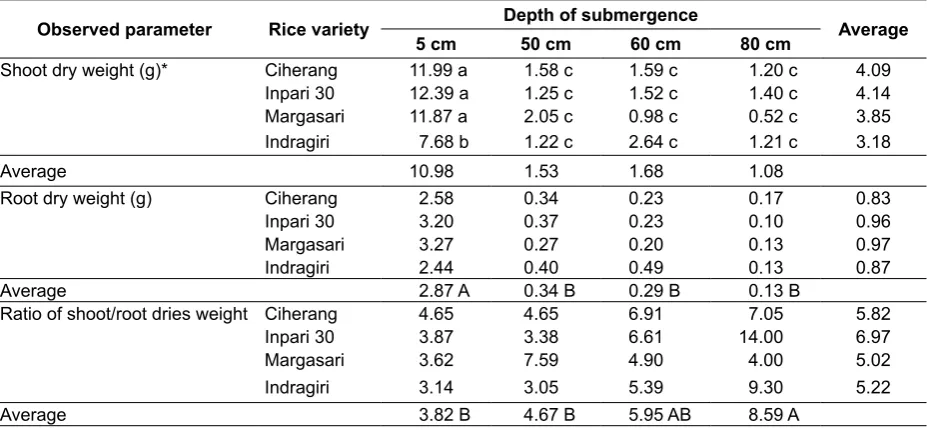
The submergence reduced the shoot and root dry weight but increased the shoot-root dry weight ratio. Root dry weight in the optimum condition (5 cm) is higher than other submergence conditions. While a ratio of shoot/root dry weight showed a contrast result where the 80 cm depth of sumergence had higher ratio of shoot/root dry weight than 5 cm and 50 cm (Table 3). Plants hold their functional of equilibrium between shoot as carbohydrates source and roots as water and nutrients source. Condition
which restrict photosynthesis could be the limitation factor of all the process in shoot and affect in reducing relative allocation at root to maintain the equilibrium function (Lynch, Marschner, & Rengel, 2012).
Ciherang, Inpari 30 and Margasari on optimum condition (5 cm) had the highest shoot dry weight compared to Indragiri in the same condition and compared to all submergence condition (Table 3). It showed that the depth of submergence reducing shoot dry weight in all rice varieties.
Treatment
Observed parameter
Number of leaves Leaf area per plant Leaf area per leaf (cm2 per plant) (cm2 per leaf)
Depth of submergence
5 cm 73.0 a 1256.39 a 17.85 a
50 cm 17.0 b 121.26 b 6.42 b
60 cm 14.7 b 100.15 b 6.23 b
80 cm 9.4 b 61.34 b 6.18 b
Rice varieties
Ciherang 29.2 409.90 9.79
Inpari 30 28.4 391.52 9.23
Margasari 33.8 410.30 8.40
Indragiri 22.8 327.50 9.26
Table 2. Number of leaves, leaf area per plant and leaf area per leaf observed at 49 DAS from rice varieties to various depth of submergence
Remarks: The number which followed by the same alphabet in the same column showed no signiicant difference with LSD (Least Signiicant Difference) test at P < 0.05; DAS = Days after sowing
Observed parameter Rice variety Depth of submergence Average
5 cm 50 cm 60 cm 80 cm
Shoot dry weight (g)* Ciherang 11.99 a 1.58 c 1.59 c 1.20 c 4.09
Inpari 30 12.39 a 1.25 c 1.52 c 1.40 c 4.14
Margasari 11.87 a 2.05 c 0.98 c 0.52 c 3.85
Indragiri 7.68 b 1.22 c 2.64 c 1.21 c 3.18
Average 10.98 1.53 1.68 1.08
Root dry weight (g) Ciherang 2.58 0.34 0.23 0.17 0.83
Inpari 30 3.20 0.37 0.23 0.10 0.96
Margasari 3.27 0.27 0.20 0.13 0.97
Indragiri 2.44 0.40 0.49 0.13 0.87
Average 2.87 A 0.34 B 0.29 B 0.13 B
Ratio of shoot/root dries weight Ciherang 4.65 4.65 6.91 7.05 5.82
Inpari 30 3.87 3.38 6.61 14.00 6.97
Margasari 3.62 7.59 4.90 4.00 5.02
Indragiri 3.14 3.05 5.39 9.30 5.22
Average 3.82 B 4.67 B 5.95 AB 8.59 A
Table 3. Shoot dry weight, root dry weight and its ratio on rice varieties and different depths of submergence
Treatment Dry weight root zone distribution (g)
A A’ B B’ C C’ D D’
Depth of submergence
5 cm 1.38 a 0.24 a 0.29 a 0.20 a 0.09 a 0.09 a 0.01 a 0.01 a
50 cm 0.24 b 0.01 b 0.04 b 0.02 b 0.01 b 0.00 b 0.00 b 0.00 b
60 cm 0.18 b 0.02 b 0.03 b 0.01 b 0.00 b 0.00 b 0.00 b 0.00 b
80 cm 0.02 b 0.00 b 0.01 b 0.00 b 0.00 b 0.00 b 0.00 b 0.00 b
Rice varieties
Ciherang 0.35 0.05 0.10 0.07 0.06 0.03 0.00 0.01
Inpari 30 0.57 0.07 0.13 0.07 0.01 0.03 0.00 0.01
Margasari 0.54 0.08 0.08 0.05 0.01 0.02 0.00 0.00
Indragiri 0.43 0.07 0.07 0.05 0.01 0.02 0.00 0.00
Table 4. Dry weight root distribution of rice varieties to various depth of submergence
Remarks: The number which followed by the same alphabet in the same column showed no signiicant difference with Least Signiicant Difference test at P < 0.05
An adequate supply of carbohydrate from the latter photosynthesis or starch reserved from shoot as the origin of energy was relied on the root growth and development (Lynch, Marschner, & Rengel, 2012; Shabala, White, Djordjevic, Ruan, & Mathesius, 2015). In return, roots arranged the shoot growth by serving inorganic nutrients and even signaling distribution (Shabala, White, Djordjevic, Ruan, & Mathesius, 2015). In that case, the environmental conditions which affect photosynthesis may impact on the root growth by affecting carbohydrate supply to the root (Lynch, Marschner, & Rengel, 2012).
Root Dry Weight Distribution
The optimum condition had the biggest root dry weight distribution compared to other submergence treatment. It can be deined that the submergence reduced more than 82 % root dry weight distribution in all zone observed while it showed no signiicant difference between the depth of submergence 50 cm, 60 cm and 80 cm (Table 4). Rice varieties statistically did not show any difference in root distribution. The root distribution pattern from all of the varieties was quite similar. The root mostly distributed vertically until the zone of C and then starting to be distributed horizontally (zone C’ and D’).
The root distribution was narrower due to the depth of submegence treatment. The plant which submerged at the depth of 50 cm, the root distributed only to 30 cm vertically (zona C) and
20 cm horizontally (zona B’). While the depth of 60 cm limited the root distribution to 20 cm vertically (zona B) and horizontally (zona B’) and the depth of 80 cm had root distribution vertically only to 20 cm (zona B). It is implied that as depth as the submergence, plant would irstly reduce root growth vertically prior to develop root growth horizontally until the submergence depth inhibit the plant from getting the oxygen supply with the compromise of developing root growth vertically in shallow. In the short duration of submergence, adventitious roots in the sediment had a little importance compare to the water (Colmer & Voesenek, 2009).
The Comparison of Total Root Dry Weight in Dif-ferent Zone
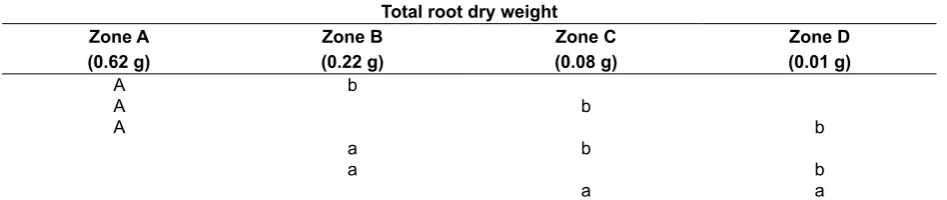
The total root dry weight of zone A and B were signiicantly different from others, but total root dry weight both of zone C and D had no signiicant different due to the amount of root dry weight on treatment. These data also showed that the amount of root growth at zone A was the biggest of all zones, followed by zone B that bigger than zone C and D (Table 5).
Total root dry weight
Zone A Zone B Zone C Zone D
(0.62 g) (0.22 g) (0.08 g) (0.01 g)
A b
A b
A b
a b
a b
a a
Table 5. The comparison of total root dry weight of each different zone
Remarks: The same alphabet in the same row showed no signiicant difference with contrast orthogonal test at P<0.05
Rice varieties Depth of submergence
5 cm 50 cm 60 cm 80 cm
Ciherang
Inpari 30
Margasari
Indragiri
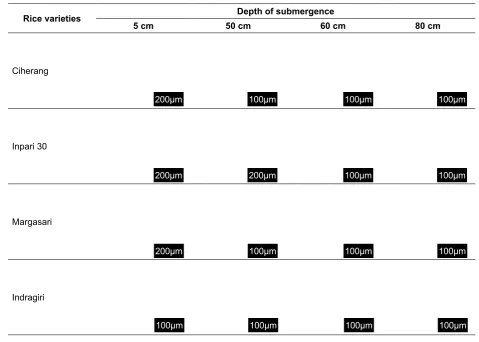
Imaging of Root Distribution and Root Cross Section of Different Depth of Submergence
The root dispersion showed from the root box after removing the mulch and glass. All rice varieties in optimum condition showed the clear root distribution and the submergence also reduced the visual appearence of root distribution (Fig. 1). The root tissue of four rice varieties in optimum condition did not show the damage and started to enhance the damage as the depth of submergence. The root breakdown occurred in the cortex which the optimum condition (5 cm) showed the compact structure on the root cross section. As the depth of the submergence, the cortex breakdown triggered the channel formation which called as aerenchyma. The root structure of Ciherang and Margasari under the depth of submergence 80 cm showed the
severe cortex degradation in contrast with Indragiri and Inpari 30 which still have cortex covering their endodermis (Fig. 2).
Hypoxia resulted in a various response on plant growth metabolic process which help the continuity of root function during this stress condition. Commonly the gases are diffused slower in submerged condition than aerial condition. The scarcity of oxygen happened during plant tissue respiration, then ethylene trigger various response on aerenchyma formation, adventitious root formation and length of shoot elongation. Roots responded to the scarcity of oxygen supply or the high accumulation of ethylene in plant tissue through increasing aerenchyma formation (Lynch, Marschner, & Rengel, 2012).
Rice varieties Depth of submergence
5 cm 50 cm 60 cm 80 cm
Ciherang
Inpari 30
Margasari
Indragiri
Fig. 2. The differences root crosses-section of rice varieties to different depth of submergence
200µm
200µm
200µm
100µm
100µm
200µm
100µm
100µm
100µm
100µm
100µm
100µm
100µm
100µm
100µm
The aerenchyma formation was the adaptation response to the internal oxygen deicit by facilitating oxygen movement directly from the shoot to the root (George, Horst, & Neumann, 2012). The anaerobic plant commonly has root system which allows the aerenchyma formation, the intercellular channel which facilitated the oxygen and other gases exchange. The living cells separated air space in the cortex which formed by the death cells. Consequently, it formed the tissue structure similar the unstructured wheel which shown on the treatment depth 50 cm of submergence (Fig. 2). The lysigenous process has beneit on the deicit oxygen condition to make the speciic channel for facilitating oxygen diffusion, on the other hand the death process reduce the oxygen consumption by the cell and the adaptation respond to the deicit oxygen (Evans, 2003).
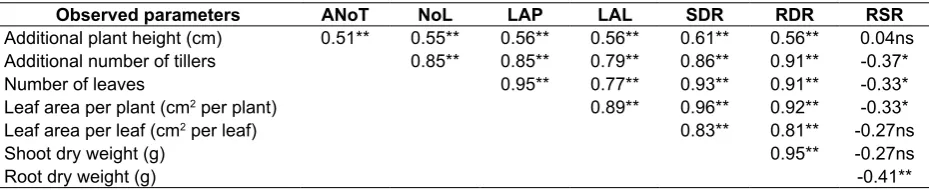
Correlation between the Observed Parameters An additional number of tillers, the number of leaves, leaf area per plant and per leaf, and shoot dry weight had signiicant strong correlation each others except the ratio of shoot root. It implied that the increasing of one component will affect in the increasing another component. Shoot dry weight and root dry weight had close correlation with all parameters observed except the additional plant height. Shoot dry weight also had close correlation with root dry weight which implied that shoot and root growth were growing in balance. Most of the parameters observed shows a negative weak correlation to shoot – root ratio (Table 6).
CONCLUSION AND SUGGESTION
The study concluded that the submergence retarded plant growth, root distribution and increase root damage for all rice varieties. Submergence
depth under 50 cm was enough to make root damage of all rice varieties, so the further research should be conducted between 0-50 cm to get the critical depth or threshold in which the depth of submergence start giving damage to rice root.
REFERENCES
Bailey-Serres, J., Lee, S. C., & Brinton, E. (2012). Waterprooing crops: Effective looding survival strategies. Plant Physiology, 160(4), 1698-1709. http:/ / doi. org/ 10. 1104/ pp. 112. 208 173
Bates, B. C., Kundzewicz, Z. W., Wu, S., & Palutikof, J. P. (Eds.). (2008). Climate Change and Water. IPCC Technical Paper VI. Geneva, CH: Intergovernmental Panel on Climate Change. http://doi.org/10.1016/j.jmb.2010. 08.039
Colmer, T. D., & Voesenek, L. A. C. J. (2009). Flooding tolerance: Suites of plant traits in variable environments. Functional Plant Biology, 36(8), 665–681. http://doi.org/ 10. 1071/FP09144
Drew, M. C., He, C. J., & Morgan, P. W. (2000). Programmed cell death and aerenchyma formation in roots. Trends in Plant Science, 5(3), 123–127. http://doi.org/10.1016/S13 60 \-1385(00)01570-3
Evans, D. E. (2003). Aerenchyma formation. New Phytologist, 161(1), 35–49. http://doi.org/ 10.1046/j.1469-8137.2003.00907.x
George, E., Horst, W. J., & Neumann, E. (2012). Adaptation of plants to adverse chemical soil conditions. In Marschner’s Mineral Nutrition of Higher Plants: 3rd Edition (pp. 409–472). London, UK: Academic Press. http://doi.org/10.1016/B978-0-12-384905-2.00017-0
Table 6. Correlation of the observed parameters
Remarks: (ns) = not signiicantly different; (*) = signiicantly different at P < 0.05; (**) = signiicantly different at P < 0.01; ANoT = Additional number of tiller; NoL = Number of Leaf; LAP = Leaf area per plant; LAL = Leaf area per leaf; SDR = Shoot dry weight; RDR = Root dry weight; RSR = Ratio of Shoot – Root
Observed parameters ANoT NoL LAP LAL SDR RDR RSR
Additional plant height (cm) 0.51** 0.55** 0.56** 0.56** 0.61** 0.56** 0.04ns
Additional number of tillers 0.85** 0.85** 0.79** 0.86** 0.91** -0.37*
Number of leaves 0.95** 0.77** 0.93** 0.91** -0.33*
Leaf area per plant (cm2 per plant) 0.89** 0.96** 0.92** -0.33*
Leaf area per leaf (cm2 per leaf) 0.83** 0.81** -0.27ns
Shoot dry weight (g) 0.95** -0.27ns
Haefele, S., Atlin, G., Kam, S., & Johnson, D. (2004). Improving farmers’ livelihood in rainfed rice-based lowlands of Asia. Deutscher Tropentag, 1–9. Retrieved from http:// www.tropentag.de/2004/abstracts/full/128. pdf?q=rainfed
Hattori, Y., Nagai, K., & Ashikari, M. (2011). Rice growth adapting to deepwater. Current Opinion in Plant Biology, 14(1), 100–105. http://doi.org/10.1016/j.pbi.2010.09.008 Irfan, M., Hayat, S., Hayat, Q., Afroz, S., & Ahmad,
A. (2010). Physiological and biochemical changes in plants under waterlogging. Protoplasma, 241(1), 3–17. http://doi.org/ 10.1007/s00709-009-0098-8
Kono, Y., Yamauchi, A., Nonoyama, T., Tatsumi, J., & Kawamura, N. (1987). A revised experimental system of root-soil interaction for laboratory work. Environment Control in Biology, 25(4), 141–151. http://doi.org/10. 2525/ecb1963.25.141
Lynch, J., Marschner, P., & Rengel, Z. (2012). Effect of internal and external factors on root growth and development. In Marschner’s Mineral Nutrition of Higher Plants (3rd Edition) (pp. 331–346). London, UK: Academic Press. http://doi.org/10.1016/B9 78-0-12-384905-2.00013-3
Malano, H., Davidson, B., George, B., Ryu, D., Kumar, K., Anshuman, .... Honnungar, V. (2015). Final report: Impacts of climate change and watershed development on whole-of-basin agricultural water security in the Krishna and Murray-Darling basins. Canberra, AU: Australian Centre for International Agricultural Research. Retrieved from http://aciar.gov.au/iles/fr 2015-13._lwr-2007-113.pdf
Mulyani, S. (2006). Anatomi tumbuhan [Plant Anatomy]. Yogyakarta, ID: Kanisius.
Nagai, K., Hattori, Y., & Ashikari, M. (2010). Stunt
or elongate? Two opposite strategies by which rice adapts to loods. Journal of Plant Research, 123(3), 303–309. http://doi.org/ 10.1007/s10265-010-0332-7
Nurhati, I., Ramdhaniati, S., & Zuraida, N. (2008). Peranan dan dominasi varietas unggul baru dalam peningkatan produksi padi di Jawa Barat [Role and domination of new high yielding variety on increasing rice production at West Java]. Buletin Plasma Nutfah, 14(1), 8-13. Retrieved from http:// indoplasma.or.id/publikasi/buletin_pn/pdf/ buletin_pn_14_1_2008_8-13_indah.pdf Septiningsih, E. M., Hidayatun, N., Sanchez, D. L.,
Nugraha, Y., Carandang, J., Pamplona, A. M., … Mackill, D. J. (2014). Accelerating the development of new submergence tolerant rice varieties: The case of Ciherang-Sub1 and PSB Rc18-Sub1. Euphytica, 202(2), 259–268. http://doi.org/10.1007/s10681-01 4-1287-x
Shabala, S., White, R. G., Djordjevic, M. A., Ruan, Y. L., & Mathesius, U. (2015). Root-to-shoot signalling: Integration of diverse molecules, pathways and functions. Functional Plant Biology, 43(2), 87–104. http://doi.org/10.10 71/FP15252
Suprihatno, B., Daradjat, A. A., Satoto, Baehaki, S. E., Suprihanto, Setyono, A., .... Sembiring, H. (2010). Deskripsi varietas padi [Description of rice variety]. Subang, ID: Indonesian Center for Rice Research. van Drunen, M. A., Lasage, R., & Dorland, C. (Eds.).