Multitemporal MODIS Data to Mapping Rice Field Distribution in
Bali Province of Indonesia Based on the Temporal Dynamic
Characteristics of the Rice Plant
Ida Ayu Gde Kurnia Jayanti
Directorate General of Highways, Ministry of Public Works
D.I Panjaitan Street, Banjarmasin 70111, South Kalimantan, Indonesia
E-mail: [email protected]
Takahiro Osawa
Center for Remote Sensing and Ocean Science (CReSOS), Udayana University
PB Sudirman Street, Denpasar 80232, Bali, Indonesia
E-mail: [email protected]
I. Wayan Sandi Adnyana
Faculty of Agriculture, Udayana University
Kampus Bukit Jimbaran 80361, Bali, Indonesia
E-mail: [email protected]
Tasuku Tanaka
Graduate School of Science and Engineering, Yamaguchi University
Ube Shi Tokiwadai 2-16-1, Ube 7550092, Yamaguchi, Japan &
Center for Remote Sensing and Ocean Science (CReSOS), Udayana University
PB Sudirman Street, Denpasar 80232, Bali, Indonesia
E-mail: [email protected]
I. Wayan Nuarsa
Faculty of Agriculture, Udayana University
Kampus Bukit Jimbaran 80361, Bali, Indonesia
E-mail: [email protected]
Abd Rahman As-syakur (Corresponding author)
Center for Remote Sensing and Ocean Science (CReSOS), Udayana University &
Environmental Research Center (PPLH), Udayana University
PB Sudirman Street, Denpasar 80232, Bali, Indonesia
Tel: 62-361-256-162 E-mail: [email protected]
Received: November 23, 2011 Accepted: December 22, 2011 Published: February 1, 2012
Abstract
Moderate-Resolution Imaging Spectroradiometer (MODIS) satellite data has been widely employed for many applications. It has fine temporal, spectral and spatial resolution. This feature can be used for monitoring earth condition continuously, such as the rice field distribution. Rice fields can be known by detecting the rice plant in that area. Enhanced Vegetation Index 2 (EVI2) is one of the indexes, which describe vegetation conditions and was employed to mapping the rice field. Rice field area was identified using growth curve recognition of EVI2 MODIS data based on rice plant temporal dynamic characteristics. The rice field distributions in Bali that were estimated from MODIS data in 2009 show reasonable spatial agreement with rice field distribution from land use map of 2008. The total area of rice field from MODIS data is 101,218.75 hectare (accuracy 88.21% of reference data). The southern part of Bali has wider rice coverage compared to northern part of Bali because of the topographic condition in southern Bali is suitable for rice cultivation. The regency and district level comparison of rice field area in Bali Province showed a good spatial agreement of accuracy. This indicates that MODIS EVI2 250 m data can be used to mapping homogeneous areas in the small region of district scale. The accuracy identify rice field are affected by several factors, such as spatial resolution and cloud cover of satellite data, elevation of rice field area, and type of rice field.
Keywords: Rice field, MODIS, EVI2, Bali
1. Introduction
Rice (Oryza sativa L.) is the staple food for more than three billion people, over half the world’s population. It provides 27% of dietary energy and 20% of dietary protein in the developing world (Redoña, 2004). Rice is the main carbohydrate source, because of it becomes the main foodstuff for most of the people. Therefore, rice monitoring is important economically and environmentally. Rice monitoring is economically useful in predicting the yield of rice crops (Wang et al., 2005). Environmentally, knowledge of rice growing areas can be used to estimate the flux of methane and managing water resources from the irrigated rice fields (Xiao et al., 2006). In Indonesia, rice is one of the most important agricultural plants because rice is the main food consumed by Indonesians (Nuarsa et al., 2011). In addition, millions of people engaged in rice production, rice processing and other post-harvest activities related to rice (Sidik, 2004). Rice plays an important role in the domestic economy and in the food security of households, with poor households allocating about 30% of total expenditure to rice (Sayaka et al., 2007). Rice production is centered in Java (54% of output) and followed by Sumatra (24%). Meanwhile, Bali and Nusa Tenggara contribute 6% of output (FAO, 1998). On the other hand, intensification in rice farming practices in the previous time have significant impacts on the emissions of various greenhouse gases and availability of water in this country (Nugroho et al., 1996; Bulsink et al., 2010; Subadiyasa et al., 1997). During the globalization, the information of appropriate agriculture resources needs quickly to support food endurance. The information about plant area, harvest area and rice production in Indonesia usually can be known a few months after the agro census wich is done in tabular format, not in spatial format and the conventional method has less accuracy in collecting data over large area (Dirgahayu and Parwati, 2005).
In Bali Province, about 36% people work in agriculture sectors included paddy field farmer. Agriculture sector is the number two contributories to Gross Regional Domestic Product after the tourism sector (BPS, 2009). On the other hand, paddy fields significantly affects on the emissions of methane gas in this province (Subadiyasa et al., 1997). One of the agricultural problems in Bali is related to the growth of population increases rapidly. As the results, many agricultural areas are converted into settlement and decreasing continuously (As-syakur, 2011). Therefore, new method is needed to find out the latest information about the coverage and distribution of agricultural area, especially rice field area.
Remotely sensed optical signatures can be used to monitor earth conditions quickly and routinely. This process primarily uses the spectral information and texture of remote sensing data to discriminate among different object on the earth (Van Niel and McVicar, 2001). Remote sensing has played a significant role in studying agriculture. Interpretation of remote sensing images is easily in crop classification, crop health and yield assessment (Nellis
et al., 2009). One of the applications of remote sensing is to identify paddy rice fields. Optical satellite remote sensing can provide a viable means to meet the requirement of improved regional-scale datasets of paddy rice fields (Xiao et al., 2006). Most of remote sensing research of rice plant is about rice productivity estimation (e.g. Nuarsa et al., 2011; Nuarsa et al., 2012; Shao et al., 2001; Gumma et al., 2011). So that, it is needed to do other research related with rice plant; one of them is mapping the rice field distribution.
revisit cycle, moderate spatial resolution and also have all requirements in generating vegetation index (Vermote
et al., 2011). Therefore, this sensor is suitable to updated information on the temporal characteristics of paddy rice fields. Evri et al., (2007) shows the reflectances of each rice variety are different. This point can be explained by physical appearance, such as wide and size of leaves. However, the patterns of rice growth curve are the same in all varieties.
Previously, other researchers have been mapped rice field using MODIS data on nationally and regionally based on temporal development of the vegetation index (e.g. Sakamoto et al., 2009; Xiao et al., 2006; Xiao et al., 2005; Xiao et al., 2002). However, they use MODIS data that has 1 km and 500 m spatial resolution. The results show an association between satellite data with field data. Furthermore, lack on the spatial resolution of MODIS tend to be more pronounced at the district level because problems detecting small fields.
Vegetation index is a parameter that can be used to monitor biophysical quantities related to the terrestrial ecosystem and to analyze the vegetation conditions in a region. Vegetation index has various algorithms (Horning, 2004). One of them is Enhanced Vegetation Index (EVI; Huete et al., 1997) that is employed to mapping the rice field (Xiao et al., 2005; Xiao et al., 2006; Sakamoto et al., 2009). This kind of vegetation index has many improvements compared to others vegetation index that due the blue band in the equation (Motohka et al., 2011; Chengyuan et al., 2008; Xiao et al., 2003). However, the use of the blue band also limits the applicability of EVI. This is because data sets from some satellites do not contain blue band information. To allow EVI to be used on the red and near infrared datasets, Jiang et al. (2008) developed EVI2 – a two band enhanced vegetation index that has values very similar to EVI. To identify the temporal characteristics in the green vegetation in rice fields requires spectral bands or vegetation indices that are sensitive to vegetation changes. EVI2 that was employed in this research to mapping the rice field.
In this study, we employed multitemporal MODIS data to mapping rice field distributions in Bali, an Indonesia Province. Our objective is to identify the rice field distributions using multi temporal MODIS data based on rice plant temporal dynamic characteristics. We evaluated the MODIS EVI2-derived rice map in three ways: (1) spatial distribution of rice field, (2) regency level comparison, and (3) district level comparison. The algorithm developed for MODIS images could be applied to other rice field area to generate an update database of agriculture.
2. Research Methods
The research location is in Bali Province, located between the 8°3'40" - 8°50'48" S and 114°25'53" - 115°42'40" E, covering an area of 5,590.31 km2 (Figure 1). Administratively, Bali Province has 9 regency/cities and 55 districts. Bali is divided into two different parts; North Bali with a narrow lowland and less sloping, and South Bali with broad lowland and sloping (As-syakur, 2011). In general, rainfall in Bali has a monsoon pattern of two seasons, the dry season and rainy season (Aldrian and Susanto, 2003). There is much rice planted in Bali, 18% of the total Bali Province area is the rice plant plantation.
The material used in this research is as follows: (1) MODIS data, (2) land use map last updated in 2008 included irrigated and unirrigated rice field area (As-syakur 2011) that used for reference data, and (3) Digital Elevation Model (DEM) from topography contour map interpolation with 250 m spatial resolution (Bakosurtanal, 2000). MODIS Terra 8-day composites images (MOD09Q1) were used for Bali Province area, from January 2009 until December 2009. MOD09Q1 provides MODIS band 1-2 surface reflectance at 250-m resolution. It is a level-3 composite of MOD09GQ product. Each MOD09Q1 pixel contain the best possible Level-2 Global (L2G) observation during an 8-day period as selected on the basis of high observation coverage, low view angle, the absence of clouds or cloud shadow, and aerosol loading (Vermote et al., 2011).
Before identify a pixel as a flooding pixel, it needs to generate various masks for clouds, water bodies, and other constant vegetation index pixel. This process has a purpose to eliminate the pixel that is certainly not belonging to rice field and in an effort to minimize their potential impact.
Vegetation index used in this research is EVI2 proposed by Jiang et al. (2008). They used a large number of field test sites to develop an index equation and produces values very similar to EVI. The EVI employs the use of red, near infrared and blue band. Red band has used because the absorption of red wavelength by vegetation is the highest compared to other wavelength, while infrared band has the highest reflection (Jensen, 2000). Therefore, in red and near-infrared bands the contrast between vegetation and soil is at its maximum (Sahu, 2008). The use of the blue band aims to reduce noise and uncertainties associated with highly variable atmospheric aerosols (Jiang et al., 2008). However, in MODIS data with spatial resolution 250 m, only are available the red band (RED) and near infrared band (NIR). The formula used to calculate vegetation index is EVI2 (Jiang et al., 2008):
(1)
The red band in MODIS sensor is at about 620-670 nm and near infrared band is at about 841-876 nm. EVI2 is often used for sensors without blue band, such as MODIS, to produce an EVI-like vegetation index. Since the role of blue band in EVI does not provide additional information on vegetation properties, a two-band EVI should be compatible. This formula has improvement sensitivity over high biomass, relative to Soil Adjusted Vegetation Index (SAVI), and minimizes soil influences (Jiang et al., 2008).
3. Results and Discussions
Rice field area was identified by finding pixels that have EVI2 pattern about 120 days. A temporal profile analysis of MODIS-EVI2 was used to identify paddy rice fields at regional spatial scales based on rice plant temporal dynamic characteristics. The unique features of spectral reflectance values in that specific period make paddy rice fields separable from other land covers. Before identified the rice field area, the threshold value of flooded pixels and EVI2 pattern of rice field in Bali province must be known. Land use map last updated in 2008 (As-syakur, 2011) were used to this purpose. Figure 2 shows the average of EVI2 value of several land use in a year and rice field has different patterns compared with other land use types. Flooding and transplanting time can be identified by the low EVI2 value, and then followed by the increasing of EVI until growing period. After reaching the peak, EVI2 value of rice plant fell off until the harvest time. The fluctuation of vegetation index value shows the flooding and transplanting period if it has the EVI2 value below 0.4. After flooding and transplanting period, the EVI2 value increases until rice plant reaches the 60 days age, then in ripening stages the EVI2 value decrease until harvest time at the age about 120 days.
The rice field area was identified after finding the flooded pixels. The result of rice field distribution in Bali is shown in Figure 3. The district polygon also indicates in the figure. Most of the rice fields in Bali are located in the southern part of the island. Rice can grow well in this area both in dry and rainy season. For unirrigated rice field, most of the rice was planted in rainy season.
Table 1 presents the rice field coverage in Bali Province and the spatial agreement between MODIS with reference data. The coverage area of rice field observed using the MODIS data is 101,218.75 hectare. However, the coverage area of reference data is 101,587.50 hectare, so it means, that rice field from MODIS data are 0.36% lower than the reference data. The spatial agreement between MODIS data with reference data is 89,606.25 hectare (spatial agreement 88.21%). A number of factors could result in the MODIS rice pixels that do not correspond spatially with reference data pixels. The spatial agreement refers to the pixels which are identified as rice field both in calculation results and reference data. While the ratio of spatial agreement is the percentage of the spatial agreement of calculation result compared to reference data.
The pixel by pixel comparison is conducted and presented in Figure 4. District polygon also indicates in the figure. Green color is agreed the calculation, and red color is disagreed the calculation. The agreed calculation refers to the pixels that were identified as rice field both in calculation result and reference data. While disagreed calculation refers to the pixels that were identified as rice field in calculation results from MODIS. However, the disagreed do not appeared as rice field in reference data, the pixels that were showed as rice field in reference data but do not were identified as rice field in calculation result from MODIS.
There were some notable differences between the calculation results and reference data. The largest area with disagreement is in eastern part of Bali (Kubu district), with a ratio of spatial agreement 19.93%. In this district, the calculation results show underestimated rice field area.
The comparison pixel by pixel shows a confusion matrix and the error and accuracy calculation (Table 2). The pixels that showed as rice field in reference data but were not identified as rice field in calculation result, or called omission error, are 1,917 pixels (11.79%). Meanwhile, the pixels that do not showed as rice field in
reference data but were identified as rice field in calculation result, called commission error, is 1,858 pixels (11.47%).
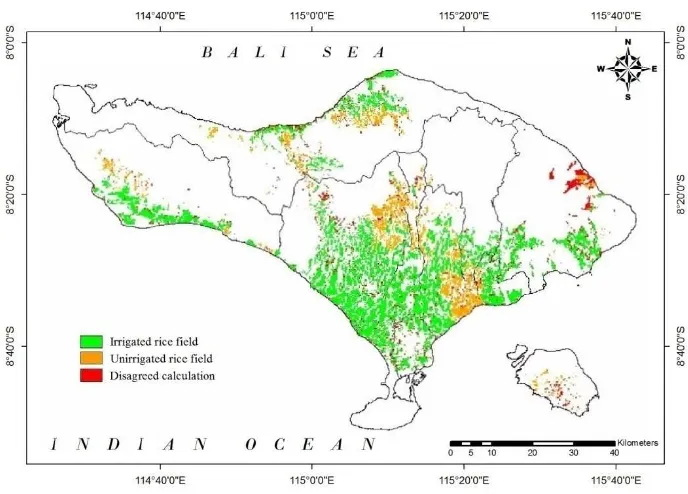
There are two types of rice field in Bali Province, irrigated and unirrigated rice field. Irrigated rice field has larger coverage than unirrigated rice field. Figure 5 shows rice field distributions by type of rice field. Pixel by pixel comparison between MODIS rice field with both types of rice field also indicates in the figure. The calculation result shows the same phenomenon, where irrigated rice field has coverage to 68, 23 hectare (76.15%) and unirrigated rice field to 21, 37 hectare (23.85%). The spatial agreement shows for irrigated rice field is 90.33% and unirrigated rice field is 82.05%.
The comparison of the rice field distribution and elevation is shown in Figure 6. Regency polygon also indicates in the figure. In Bali province, rice field are mostly located at the elevation 100 to 500 meters above sea level, which is about 54,100 or 47.81%. Only 225 hectare, or 0.20% of the rice field located at the elevation > 1000 meters above sea level. This is in accordance with the characteristics of rice plant that generally lives in lowland area and with the characteristics of Bali Island. Bali has broad lowland and sloping area in the southern part of the island, while in the northern part is narrow lowland and less sloping. So the rice field distribution is more common in the southern part of Bali.
On the ratio of spatial agreement, the elevations from 0 to 500 meters have similar ratio of spatial agreement, which is above 88%. While the elevation between 500-1000 m have lower ratio of spatial agreement, and the elevation >1000 m have the lowest ratio of spatial agreement, which is only 53.85%. This result shows that elevation affects the calculation. The reason for calculation result to underestimate rice areas in the hilly areas is likely a result of smaller rice field sizes in this part of study area. According to earlier study by Xiao et al. (2005), a similar pattern was observed as the MODIS rice algorithm underestimated rice areas in the hilly provinces of Southern China.
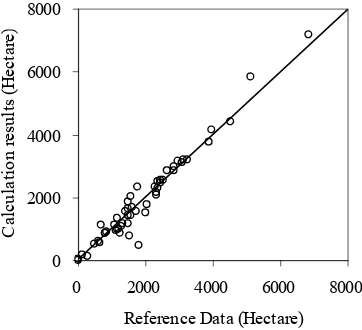
On regency level accuracy, Gianyar regency has the best ratio of spatial agreement, which is 96.41%. The big size of rice field with few cloud cover makes the good accuracy. Cloud cover is very important in tropical and sub-tropical areas where much of the world’s rice is grown and the availability of optical satellite data is severely constrained by frequent cloud cover (Xiao et al., 2005). The regency level comparison of rice field area is presented in Figure 7. The figure indicates comparison between the calculation result with reference data show good spatial agreement, yielding high correlation coefficients (r=0.98).
Gianyar regency has bigger rice field size than MODIS spatial resolution (250m). Therefore, the reflectance value of rice field easily can separable to other land use type. The low resolution is the weakness of MODIS data the process of identifying rice field, especially for rice fields that are much smaller than the MODIS spatial resolution.
On the other hand, Denpasar is regency that has much small sized rice field. This is the reason why the accuracy in Denpasar is lower than other regencies (80.39%). It is more difficult to identify the rice field using MODIS with 250 m spatial resolution. Xiao et al. (2006) showed that discrepancies between MODIS rice and reference data can be largely attributed to failure of MODIS based algorithm in identifying small patches of rice fields. And for heterogeneous areas such as those containing settlements, satellites with high spatial resolution are necessary to detect detailed features (As-syakur et al., 2010).
The district level comparison of rice field area in Bali Province is presented in Figure 8. The figure shows that the rice field distributions by district between calculation results and reference data are quite similar (r=0.95). South Kuta district has the lowest accuracy. The classification result identifies rice field, but the reference data does not show any rice field. However, the coverage of error in South Kuta does not too much (62.5 hectare). This error might be caused by the error of satellite data or the effect of atmospheric condition and the spatial resolution.
The other district with low-level accuracy is Kubu (19.93%) and followed by Abang district (44.81%). The high error in these districts can be caused by the rice field type in this area. Most of the rice field in Kubu and Abang district is unirrigated rice field. The classification result by type of rice field shows that unirrigated rice field has lower accuracy than irrigated rice field. This result affected by the crop cycle of unirrigated rice field. Unirrigated rice field only planted in rainy season. However, in rainy season, the cloud coverage is extensive. Bali is located in tropical area and has high rainfall. Therefore, the cloud cover problems are occurred for satellite data.
4. Conclusions
detecting the flooded, transplanting, and growth of rice field. Total area of rice field area was 101,218.75 hectare. Rice field distribution in Bali was comparable to rice field distribution from land use map of 2008 with the accuracy 88.21%. The calculation results show that elevation affected to rice field distribution. Elevation above 500 meters sea level shows the lower ratio of spatial agreement, because the sizes of rice field in hilly areas are quite small compared to MODIS spatial resolution. The unirrigated rice field rate showed lower accuracy comparing with irrigated rice field. The unirrigated rice field generally has one time crop cycle in a year, in rainy season. On regency and district level, rice field distribution spread on all regencies and district in Bali. The highest covered of rice field occurred on the regency and district in southern part of Bali compared with northern part. The regency and district level comparison of rice field area showed a good spatial agreement of accuracy (r=0.98 and r=0.95, respectively). In short, the results indicate the MODIS EVI2 250 m data can used to map homogeneous areas and might provide effective tool for operationally identifying the flooding and rice transplanting at paddy rice fields. The spatial resolution of this data set (250 m) is sufficiently fine to monitor the temporal characteristics of rice fields on a regency and district scale.
Acknowledgments
This work was supported by CReSOS, JAXA ocean mini project in Indonesia, and Department of National Education (DIKNAS) scholarship from the Indonesian government. We gratefully acknowledge data received from the National Aeronautics and Space Administration (NASA) for MOD09Q1 data product. The comments made by two anonymous referees also helped the authors to improve the quality of the manuscript considerably.
References
Aldrian, E. & Susanto, R. D. (2003). Identification of three dominant rainfall regions within Indonesia and their relationship to sea surface temperature. International Journal of Climatology, 23, 1435-1452. http://dx.doi.org/10.1002/joc.950
As-syakur, A. R., Osawa, T. & Adnyana, I. W. S. (2010). Medium spatial resolution satellite imagery to estimate gross primary production in an urban area. Remote Sensing, 2, 1496-1507. http://dx.doi.org/10.3390/rs2061496 As-syakur. A. R. (2011). Perubahan penggunaan lahan di Provinsi Bali. Ecotrophic, 6, 1-7.
Bakosurtanal. (2000). Peta digital rupa bumi Indonesia skala 25.000. National Coordinating Agency for Surveys and Mapping of Indonesia (Bakosurtanal), Bogor, Indonesia.
BPS. (2009). Provinsi Bali dalam Angka 2008. Indonesian central statistical agency (BPS), Denpasar, Indonesia. Bulsink, F., Hoekstra, A. Y. & Booij, M. J. (2010). The water footprint of Indonesian provinces related to the consumption of crop products. Hydrology and Earth System Sciences, 14, 119-128. http://dx.doi.org/10.5194/hess-14-119-2010
Chengyuan, H., H. Shaohong, & X. Chuanyang. (2008). Comparison of some vegetation indices in seasonal information. Chinese Geographical Science, 18, 242-248. http://dx.doi.org/10.1007/s11769-008-0242-y
Dirgahayu, D. and Parwati. (2005). Rice crop modeling using age index based on Landsat 7 ETM data. [Online] Available at: http://www.gisdevelopment.net/application/agriculture/production/ma05230.htm (December 12, 2009).
Evri, M., Sadly, M., Kawamura, K., et al. (2007). Assessing visible and near-infrared and hyperspectral vegetation indices to diagnosis crop variables in tropical irrigated wetland rice. The 5th EARSeL Workshop on Imaging Spectroscopy, April 23-25, 2007, Bruges, Belgium.
FAO. (1998). FAO/WFP Crop and Food Supply Assessment Mission to Indonesia; Special Report, 6 October 1998. FAO Global Information and Early Warning System on Food and Agriculture, Rome. [Online] Available at: http://www.fao.org/docrep/004/x4307e/x4307e00.htm (December 13, 2011).
Gumma, M. K., Nelson, A., Thenkabail, P. S., et al. (2011). Mapping rice areas of South Asia using MODIS multitemporal data. Journal of Applied Remote Sensing, 5, 053547. http://dx.doi.org/10.1117/1.3619838
Horning, N. (2004). Global land vegetation: an electronic textbook. NASA Goddard Space Flight Center Earth Sciences Directorate Scientific and Educational Endeavors (SEE): Greenbelt, MD, USA.
Huete, A. R., Liu, H. Q., Batchily, K., et al. (1997). A Comparison of Vegetation Indices over a Global Set of TM Images for EOS-MODIS. Remote Sensing of Environment, 59, 440-451. http://dx.doi.org/10.1016/S0034-4257(96)00112-5
Jiang, Z., Huete, A. R., Didan, K., et al. (2008). Development of a-two band enhanced vegetation index without a blue band. Remote Sensing of Environment, 112, 3833-3845. http://dx.doi.org/10.1016/j.rse.2008.06.006 Motohka, T., Nasahara, K. N., Murakami, K., et al. (2011). Evaluation of Sub-Pixel Cloud Noises on MODIS Daily Spectral Indices Based on in situ Measurements. Remote Sensing, 3, 1644-1662. http://dx.doi.org/10.3390/rs3081644
Nellis, M. D., Price, K. P. & Rundquist, D. (2009). Remote Sensing of Cropland Agriculture. In Warner, T. A., Nellis, M.D. and Foody, G.M. (Eds.). The SAGE handbook of remote sensing. SAGE Publications Ltd, New Delhi, India.
Nuarsa, I. W., Nishio, F. & Hongo, C. (2011). Relationship between rice spectral and rice yield using Modis data.
Journal of Agricultural Science, 3, 80-88. http://dx.doi.org/10.5539/jas.v3n2p80
Nuarsa, I. W., Nishio, F. & Hongo, C. (2012). Rice yield estimation using Landsat ETM+ data and field observation. Journal of Agricultural Science, 4(3). (Accepted on July 15, 2011. It will be published on March 2012, Vol 4 No. 3).
Nugroho, S. G., Lumbanraja, J., Suprapto, H., et al. (1996). Three-year measurement of methane emission from an Indonesian paddy field. Plant and Soil, 181, 287-293. http://dx.doi.org/10.1007/BF00012063
Redoña, E. D. (2004). Rice biotechnology for developing countries in Asia. NABC Report 16: Agriculture Biotechnology, Finding Common International Goals, The National Agricultural Biotechnology Council, pp. 201-232.
Sahu, K. C. (2008). Textbook of remote sensing and geographical information system. Atlantic Publishers and Distributors, India.
Sakamoto, T., Cao, P. V., Nguyen, N. V., et al. (2009). Agro-ecological interpretation of rice cropping systems in flood-pr one areas using MODIS Imagery. Photogrammetric Engineering and Remote Sensing, 75, 413-424. Sayaka, B., Sumaryanto, Croppenstedt, A., & DiGiuseppe, S. (2007). An Assessment of the Impact of Rice Tariff Policy in Indonesia: A Multi-Market Model Approach. ESA Working Paper No. 07-18. Agricultural Development Economics Division, the Food and Agriculture Organization of the United Nations, Rome, Italy.
Shao, Y., Fan, X., Liu, H., et al. (2001). Rice monitoring and production estimation using multitemporal RADARSAT. Remote Sensing of Environment, 76, 310-325. http://dx.doi.org/10.1016/S0034-4257(00)00212-1 Sidik, M. (2004). Indonesia rice policy in view of trade liberalization. Paper Presented at the FAO Rice Conference, February 12-13, 2004, Rome, Italy.
Subadiyasa, N., Arya, N., & Kimura, M. (1997). Methane emissions from paddy fields in Bali Island. Indonesia.
Soil science and plant nutrition, 43, 387-394.
Tucker, C. J. (1979). Red and photographic infrared linear combinations for monitoring vegetation. Remote Sensing of Environment, 8, 127-150. http://dx.doi.org/10.1016/0034-4257(79)90013-0
Van Niel, T. G. & McVicar, T. R. (2001). Remote sensing of rice-based irrigated agriculture: A review. Cooperative Research Centre for Sustainable Rice Production, P1105-01/01, Yanco, NSW, Australia, 58 pp.
Wang, L., Kong, J. A., Ding, K. H., et al. (2005). Electromagetic scattering model for rice canopy based on Monte Carlo simulation. Progress In Electromagnetics Research, 52, 153-171. http://dx.doi.org/10.2528/PIER07012903
Xiao, X. M., Braswell, B., Zhang, Q. Y., et al. (2003). Sensitivity of vegetation indices to atmospheric aerosols: continental-scale observations in Northern Asia. Remote Sensing of Environment, 84, 385-392. http://dx.doi.org/10.1016/S0034-4257(02)00129-3
Xiao, X., Boles, S., Frolking, S., et al. (2006). Mapping paddy rice agriculture in South and Southeast Asia using multi-temporal MODIS images. Remote Sensing of Environment, 100, 95-113. http://dx.doi.org/10.1016/j.rse.2005.10.004
Table 1. Coverage of Rice Field Area and spatial agreement between MODIS data with reference data in Bali Province
Reference Data (Hectare)
Calculation Result (Hectare)
Spatial agreement (Hectare)
Ratio of Spatial agreement (%)
Rice Field 101,587.50 101,218.75 89,606.25 88.21
Non Rice Field 457,443.75 457,812.50 445,831.25 97.46
Total 559,031.25 559,031.25 535,437.50
Table 2. Confusion Matrix
Reference (pixels)
Rice Non Rice Total
C
al
cu
lati
on
R
es
u
lt
(p
ixe
ls
) Rice 14,337 1,858 16,195
Non Rice 1,917 - -
Total 16,254 - -
Figure 1. Research Location
Figure 2. Average EVI2 value of several land use in a year
Figure 3. Rice field distribution derived from MODIS. District polygon also indicates in the figure
0 0.1 0.2 0.3 0.4 0.5 0.6 0.7
17-01-09 26-02-09 07-04-09 17-05-09 26-06-09 05-08-09 14-09-09 24-10-09 03-12-09
Time (8-day interval)
EV
I 2
Rice Field
Water Grass
Bushes
Settlement
Plantation Dry Land
Figure 4. Pixel by pixel comparison of rice field distribution. Green color is agreed calculation and red color is disagreed calculation between MODIS data with reference data, respectively.
District polygon also indicates in the figure
Figure 5. Rice field distribution by type of rice field. Green, yellow, and red color is irrigated rice filed, unirrigated rice filed, and disagreed calculation of both rice field between MODIS with reference data,
Figure 6. Rice field distribution compared with elevation above sea level. Regency polygon also indicates in the figure
Figure 7. Scatterplots of the calculation result versus reference data area for regency comparison level