EXPLORING THE RELATIONSHIPS BETWEEN LAND SURFACE TEMPERATURE,
GROUND COVERAGE RATIO AND BUILDING VOLUME DENSITY IN AN URBANIZED
ENVRONMENT
Q Zhana,b,c,*
, F. Mengb,c, Y. Xiaoa,c
a School of Urban Design, Wuhan University, Wuhan 430072, China
b School of Remote Sensing and Information Engineering, Wuhan University, Wuhan 430079, China c Research Center for Digital City, Wuhan University, Wuhan 430072, China
[email protected], [email protected], [email protected]
THEME: Atmosphere, weather and climate
KEY WORDS: Land surface temperature; Ground coverage ratio; Building volume density; Urban heat island; Landsat ETM+
ABSTRACT:
The objective of this study is to explore and compare the relationships between urban land surface temperature (LST), ground coverage ratio (GCR) and building volume density (BVD). Landsat ETM+ data of August 2011 and August 2013 are used to estimate the LST for Wuhan, China, metropolitan area, and maps of GCR and BVD are generated using building census data of 2011 and 2013. Our analysis indicates there is a strong linear relationship between LST and GCR, and when GCR is lower, the linear correlation is more prominent, whereas the relationship between LST and BVD is not straightforward, but seems some underlying pattern. The result suggests GCR and BVD provide complementary metrics to the traditionally applied land use/land cover (LULC) for analysing LST quantitatively for surface urban heat island studies using thermal infrared remote sensing in an urbanized environment. This study is of positive significance to understand today’s urban heat island issues, and contributes to the planning work of urban architectural space.
1. INTRODUCTION
Known as urban heat island (UHI), the phenomenon means that the temperature in urban areas is higher than the rural counterparts due to urbanization (Voogt and Oke, 2003). With China’s rapid economic development and accelerated process of urbanization, the scales of cities is expanding, populations of cities are increasing dramatically, buildings are becoming taller and denser, private cars are getting more and more popular, and industries are increasingly discharging pollutions, all of which cause urban heat island effect to varying degrees in many cities. Urban heat island effects increase air conditioning demands, which will cost amounts of energy, produce more pollution,
discharged heat. As a result, the characteristics and causes of UHI effects have been major concerns of many urban climate and environmental studies.
(LULC) changes on patterns of land surface temperature in Shanghai city(Li, et al., 2012; Zhang, et al., 2013). (Rajasekar and Weng, 2009) explored the relationship between land surface temperature created from ASTER images and biophysical/socioeconomic data in Indianapolis by utilizing the association rule mining model. (Yuan and Bauer, 2007) compares the normalized difference vegetation index (NDVI) and percent impervious surface as indicators of surface urban heat island effects in Landsat imagery. (Chen, et al., 2006 attempted to employ a quantitative approach in exploring the relationship between LST and several indices, including the Normalized Difference Vegetation Index (NDVI), Normalized Difference Water Index (NDWI), Normalized Difference Bareness Index (NDBaI) and Normalized Difference Build-up Index (NDBI), using Landsat TM/ETM+ images from 1990 to 2000 in Pearl River Delta.
Previous studies had related LST with biophysical properties of urban landscapes, such as impervious areas and several indices, characteristics of LULC, street geometry, population density, as well as anthropogenic activities. This paper further study the influences of urbanization on UHI effect, specifically explore the relationships between LST and ground coverage ratio (GCR), also called building density and building volume density (BVD) on the basis of those previous studies.
2. METHODS
2.1 Study area
With an area of 8494 km2 and a population of 10.34 million, Wuhan, the capital of Hubei Province, is the fifth most populous city of the nation, locating in central China (Figure 1). The Yangtze River and its tributary Hanshui meet here, and cut the city into three parts of Hankou, Hanyang, and Wuchang, namely, three towns of Wuhan. Wuhan possesses humid subtropical climate, with oppressive humid summer, where air temperature is around 37 °C in the daytime and keeps in 30 °C at night, being called the “stove city”. Especially in recent years, with rapid development, the urban heat island effect Wuhan suffers is enhanced obviously, which makes a threat to the city residents’ comfortable life.
Figure 1. Location of the study area
2.2 Image pre-processing
Two Landsat-7 Enhanced Thematic Mapper Plus (ETM+) images, captured on August 19, 2011 and August 8, 2013 were employed. The L1T image products are pre-processed via radiometric, geometric corrections is implemented by utilizing both ground control points and digital elevation models to guarantee geodetic accuracy. To analyse the relationships between LST, GCR and BVD in the study region, Universal Transverse Mercator Zone 49 North projection is applied, and all images and building census data are registered to the same coordinate system (WGS84).
2.3 LST retrieval
The classic Mono-window Algorithm (Qin, et al., 2001) is employed to retrieve the land surface temperature, which represented as
(1)
where is the retrieved LST (°C) while is the
at sensor brightness temperature (K), denotes effective
mean atmospheric temperature (K), and are constants
with value of 67.4 and 0.46 respectively, and are intermediate variables denoted as
(3)
where and are land surface emittance and atmospheric transmittance. The average estimation error is 1.1 °C if the inaccuracy of , and is considered (Qin, et al., 2001).
2.4 Calculation of GCR and BVD
Ground coverage ratio (GCR), referring to the coverage of buildings, is a two-dimensional parameter commonly used by architects and urban planners (Edward, 2011). Specifically, GCR is defined as
(4)
where represents the domain area, represents the built
area, is the average building width, and n is the number of buildings. GCR is an important indicator of architectural layout and urban morphology, which reflects the building density in a certain range of land. While, building volume density (BVD) introduces building height based on the two-dimensional GCR for observing the impact of the building height on urban morphology.
In this study, we need to get GCR and BVD calculation results in raster type with spatial resolution of 60 meters, in order to correspond with ETM+ TIR band. Firstly, using “building height” as the field, convert the building census data of vector type to raster type with the cell size of 1 meter; and then, make the building height raster into a binary image, on which if the pixel value is one if it covers buildings, otherwise the pixel value gets zero. Secondly, make the above binary image aggregate to a raster with cell size of 60 meters, where the quantity of pixels with value one in a 60 meter resolution pixel is the area of buildings of the new pixel, the ratio of the area and 60 m2 makes the GCR value of this pixel. Finally, as the pixel value of the first raster is height, which equals to the
sum of the cell values that are encompassed by the extent of the new cell with 60 meter resolution makes its building volume (BV) value. The BV raster divided by its maximum value generates the BVD map.
3. RESULTS AND DISCUSSIONS
3.1 LST patterns
The LST map of 2011 had a range of 19.5~46 °C with the highest surface temperatures located in the Qingshan and Zhuankou industrial zones, several compact mass of old and lower buildings, such as villages in Qiaokou District and Hongshan District, as well as some commercial centres. As shown in figure 2, the Yangtze River is the most obvious low temperature area, split the high temperature zones of the three towns. Other distinct low temperature zones are some large areas of water, including Hanshui River, East Lake, South Lake and so forth, which effectively block the continuous areas of high temperature. Some large parks with green space, such as Guishan Park, Liberation Park and Marshland Park, form a few low valley of urban heat surface. In some areas like Qiaokou District, the northwest of Jianghan District, and Zhuankou industrial zones, the high temperature region has broken through the boundary of the main city, which reveals the expansion direction of city space to some extent. As the air temperature of 2013.8.8 (28~37 °C) is higher than 2011.8.19 (25~35.5 °C), the overall LST map of 2013 is higher 2011 with a range of 22-47.5 °C. The LST map of 2013 has a similar distribution pattern to 2011, but parts of high temperature areas are in the expansion, such as Qingshan and Zhuankou industrial zones. From the two LST maps, we can draw the conclusion that high temperature surfaces appeared in the industrial zones, residential areas and commercial centres filled with dense buildings, which suggest GCR and BVD have significant influences on LST and urban heat island effect.
3.2 Maps of GCR and BVD
Considering the large areas of water, the scattered building distribution, and the heat source of industry in Wuchang and Hanyang, Hankou with various forms of residential and commercial districts is of strong representation to study the distribution characteristics of GCR and BVD, and investigate the relationships between LST and them.
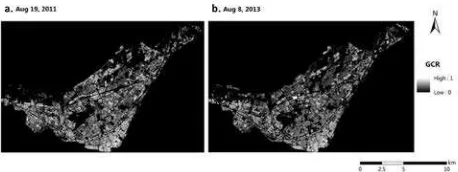
Ground cover ratio with a continuous range of building density from 0-1 is mapped in Figure 3 building volume density introducing building height based on the two-dimensional are shown in figure 4. The detail in the maps allows one to easily locate the major roads, central business districts, as well as urban residential areas with varying densities and patterns. As shown in the GCR maps of the two years, high density areas are residential communities and wholesale markets with old and low buildings around Hanzheng Street, large residential areas along Hanshui River in Qiaokou District, and villages in city along Fazhan Road. BVD maps have different distribution patterns because of the building height factor. Unlike continuous planar areas of high density in GCR maps, high values are dotted located in central business districts and modern residential communities with numbers of tall architectures, which implies building height makes a more important role in calculating BVD than building density. Comparing GCR and BVD maps of two years, big changes have taken place in Hankou’s architectural layout, where tall buildings have been constructed on vacant lands, and some old and low residential buildings have been demolished to become vacant space or new modern communities.
Figure 3. GCR images with the cell size of 60 meters derived from building census data of 2011 and 2013
Figure 4. BVD images with the cell size of 60 meters derived from building census data of 2011 and 2013
3.3 Relationships of LST to GCR and BVD
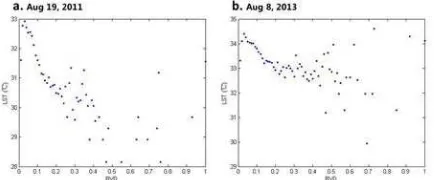
In order to facilitate the comparison, sample points located in water bodies, bare soil, grass or any non-building areas, were excluded, which means the points of GCR (BVD) values above 0 are selected. To investigate these relationships, a zonal analysis was utilized to evaluate the mean LST at each 0.01 increment of GCR and BVD from 0 to 1. A very strong linear relationship(r = 0.921, 2011; r = 0.909, 2013) is shown between the mean LST and GCR for both the two dates (Figure 5), suggesting the variations in the LST can be accounted for very well by GCR. The diagrams of the two years have the same pattern: as GCR < 0.2 and 0.5 < GCR < 0.8, most of the scattered dots locate above the fitted line; as 0.2 < GCR < 0.5, more dots are below the line, as GCR > 0.8, the dots get diverging and the linear relationship becomes weaker, which suggests low GCR values appear stronger linear correlation. Therefore, a new diagram is drawn in Figure 6 on the condition of GCR < 0.8. The correlation of LST and GCR has improved, and the correlation coefficients increase from 0.909 to 0.98 in 2013 and 0.921 to 0.977 in 2011. Accordingly,we infer that when GCR exceeds a certain threshold, the correlation of LST and GCR diminishes, or even it does not exist stable relationship. As GCR is less than different values, the corresponding correlation coefficients are shown in Table 1.
Figure 6. Relationship of mean LST to ground coverage ratio on the condition of GCR < 0.8
GCR < 0.5 < 0.6 < 0.7 < 0.8 < 0.9 < 1 2011 0.96 0.969 0.976 0.977 0.949 0.921 2013 0.958 0.969 0.979 0.98 0.956 0.909 Table 1. The corresponding correlation coefficients when GCR
is less than different values
Figure 7. Relationship of mean LST to building volume density
On the other hand, the relationships between the mean LST and BVD graphed in Figure 7 are not straightforward. However, there are similar patterns in the diagrams of the two years, which seems potential regularities. For instance, as BVD is less than 0.03, there is a positive correlation, and 0.03 < BVD < 0.2 appears negative correlation, furthermore, when BVD is more than 0.2, the dots scatter without rules, where BVD values is higher, the scatter is greater and more irregular. Thus, GCR has much more impacts on LST than BVD. Some analysis for this results have been tried: when BVD values are lower, as BVD increases, buildings are more dense, BVD has the same effects as GCR on LST; when BVD values are higher, the pixels of high values no longer corresponds to dense building areas, but may be sparse buildings with higher floors. From this point of view, lower and dense buildings make a greater contribution to rise land surface temperature,thereby aggravating urban heat island effect.
4. CONCLUSIONS
The study explored the relationships between the LST, GCR, and BVD in Wuhan metropolitan area. Results indicate there is a strong linear relationship between LST and GCR for both the two years, whereas the relationship between LST and BVD does not have obvious linear correlation, but seems some underlying pattern. The strong linear relationship model between the LST and GCR suggests that GCR accounts for most of the variation in LST dynamics. It suggests GCR provides complementary metrics to the traditionally applied land use/land cover (LULC) for analysing LST quantitatively for surface urban heat island studies using thermal infrared remote sensing in an urbanized environment. The results demonstrate that the hottest places are usually occupied by thousands of old and low dense buildings except factories which have surface heat sources. It has greater potential of reconstruction and redevelopment in the following regulation and planning, and of significance to relieve the current urban heat island issues.
We also realize that the conclusion is based on only one area, one season, and two different years. Although the data is limited, the analysis is not enough thorough, the results nevertheless provide useful information for measuring and understanding LST, GCR, BVD, their relationships, and urban heat island effect. Further studies of additional metropolitan areas and more remote sensing data are recommended.
ACKNOWLEDGEMENTS (OPTIONAL)
This research was supported the National Natural Science Foundation of China (No. 51378399).
REFERENCES
Chen X-L, Zhao H-M, Li P-X, et al., 2006. Remote sensing image-based analysis of the relationship between urban heat island and land use/cover changes. Remote Sensing of Environment, 104(2), pp. 33-146.
Li Y-y, Zhang H, Kainz W, 2012. Monitoring patterns of urban heat islands of the fast-growing Shanghai metropolis, China: Using time-series of Landsat TM/ETM+ data. International Journal of Applied Earth Observation and Geoinformation, 19, pp. 127-138.
Qin Z-h, Karnieli A, Berliner P, 2001. A mono-window algorithm for retrieving land surface temperature from Landsat TM data and its application to the Israel-Egypt border region. International Journal of Remote Sensing, 22(18), pp. 3719-3746.
Rajasekar U, Weng Q, 2009. Application of association rule mining for exploring the relationship between urban land surface temperature and biophysical/social parameters. Photogrammetric Engineering & Remote Sensing, 75(4), pp. 385-396.
Voogt, J. A., and Oke, T. R., 1998. Effects of urban surface geometry on remotely sensed surface temperature. International Journal of Remote Sensing 19(5), pp. 895-920.
Voogt, J. A., and Oke, T. R., 2003. Thermal remote sensing of urban areas. Remote Sensing of Environment, 86, pp. 370-384. Yuan F, Bauer M E, 2007. Comparison of impervious surface area and normalized difference vegetation index as indicators of surface urban heat island effects in Landsat imagery. Remote Sensing of Environment, 106(3), pp. 375-386.