GIS AND REMOTE SENSING FOR MALARIA RISK MAPPING, ETHIOPIA
A.Ahmeda, *
Abdulhakim Ahmed, TERI University, Dept. of Natural Resource, 110070, New Delhi, India, [email protected]
KEY WORD: - GIS, Remote Sensing, decision support system (DSS), multi criteria evaluation (MCE).
ABSTRACT:
Integrating malaria data into a decision support system (DSS) using Geographic Information System (GIS) and remote sensing tool can provide timely information and decision makers get prepared to make better and faster decisions which can reduce the damage and minimize the loss caused. This paper attempted to asses and produce maps of malaria prone areas including the most important natural factors. The input data were based on the geospatial factors including climatic, social and Topographic aspects from secondary data. The objective of study is to prepare malaria hazard, Vulnerability, and element at risk map which give the final output, malaria risk map. The malaria hazard analyses were computed using multi criteria evaluation (MCE) using environmental factors such as topographic factors (elevation, slope and flow distance to stream), land use/ land cover and Breeding site were developed and weighted, then weighted overlay technique were computed in ArcGIS software to generate malaria hazard map. The resulting malaria hazard map depicts that 19.2%, 30.8%, 25.1%, 16.6% and 8.3% of the District were subjected to very high, high, moderate, low and very low malaria hazard areas respectively. For vulnerability analysis, health station location and speed constant in Spatial Analyst module were used to generate factor maps. For element at risk, land use land cover map were used to generate element at risk map. Finally malaria risk map of the District was generated. Land use land cover map which is the element at risk in the District, the vulnerability map and the hazard map were overlaid. The final output based on this approach is a malaria risk map, which is classified into 5 classes which is Very High-risk area, High-risk area, Moderate risk area, Low risk area and Very low risk area. The risk map produced from the overlay analysis showed that 20.5%, 11.6%, 23.8%, 34.1% and 26.4% of the District were subjected to very high, high, moderate, low and very low malaria risk respectively. This help to plan valuable measures to be taken in early warning, monitor, control and prevent malaria epidemics.
1. INTRODUCTION
Malaria is a serious vector-borne disease affecting a greater proportion of the world's population. Malaria is essentially an environmental disease since the vectors require specific habitats with surface water for reproduction, humidity for adult mosquito survival and the development rates of both the vector and parasite populations are influenced by temperature (Ashenafi, 2003). The increase in malaria prevalence is determined by several factors: mosquito resistance to insecticides, parasite resistance to drugs, changes in land-use patterns, and reductions in funding and manpower dedicated to control activities. Most of the determinants are heterogeneously distributed, changing over both space and time. Factors such as topography, temperature, rainfall, land use, population movements, and degree of deforestation have a profound influence on the temporal and spatial distribution of malaria vectors and malaria. (FMoH,2009)
Malaria occurs in over 100 countries and more than 40% of the people in the world are at risk. The World Health Organization estimates that each year 300-500 million cases of malaria occur worldwide and more than two million
people die of malaria. Malaria is a leading cause of morbidity and mortality in the developing world, especially sub-Saharan Africa where the transmission rates are highest and where it is considered to be a major impediment to economic development (Robert et al., 2003). The vast majority of malaria deaths occur in Africa, south of the Sahara, where malaria also presents major obstacles to social and economic development. Malaria has been estimated to cost Africa more than US$ 12 billion every year in lost GDP, even though it could be controlled for a fraction of that sum.
Ethiopia, one of the sub-Saharan countries in Africa is the
victim of malaria epidemic and it’s far reaching negative
impacts. Malaria is one of the main health problems in Ethiopia in which its cases are one of the highest and it is increasing in an alarming rate. However, exposure to malaria varies markedly by location and season. Ethiopians live at
altitudes ranging from −100 to >4220 m, the topography
August, September, October and November each year. (Negassi F., 2008)
Malaria epidemic have had a notable impact on the economic, social, and political sphere of the society. The impact of Malaria derives from the natural environment that is favorable to its transmission and also from the lack of implementation the systematic approach of preventive plans. As a result, the cost of preventive plan and medical treatment becomes enormous burden on GDP and individual economy. At the same time economic productivity of the individual is declined due to Malaria infection. It has been estimated that the economic burden due to malaria accounting for a 1.3% reduction in the annual economic growth rate of countries. Based on this circumstance, timely and precise information of Malaria outbreak, transmission, and infection is desired in order to effectively implement a Malaria control plan. It is now convincing that in some parts of the country, prevalence and incidence of malaria is increasing with ultimate cause of socio-economic impediment.
The study was conducted in Kersa District of Jimma zone, Oromia National Regional state, Ethiopia with the objective developing map of malaria risk, which identify and integrates environmental factors that make condition suitable for breeding, outbreak malaria incidence and identification of habitat site for mosquito in the study area, develop land use/land cover map and different factors map for malaria risk and hazard analysis finally compute Eigen vector for the developed factors and conduct weighted overlay Analysis in ArcGIS by integrating information derived to develop a malaria risk map showing malaria risk areas using Remote Sensing and GIS.
2. METHODOLOGY
Malaria risk of the District were analyzed from the following general risk equation
Risk = (Elements at risk)*(Hazard)*(Vulnerability)
“Hazard (H)” is the probability of occurrence of a potential
damaging natural phenomenon within a specified period of time and within a given area
“Element at risk (E)” includes the population, economic
activities, public services, utilities and infrastructures, etc., at risk in a given area
“Vulnerability (V)” is the exposure of a given element or set
of elements at risk resulting from the occurrence of a damaging phenomenon of a given magnitude
“Risk (R)”is the expected degree of loss due to a particular
natural phenomenon. It may be expressed as the product of hazard (H), vulnerability (V), and element at risk (E)
The malaria hazard analyses were computed using multi criteria evaluation (MCE). To run MCE, the selected environmental factors such as topographic factors
(elevation, slope and flow distance to stream), land use/ land cover and breeding sites was developed and weighted. Then, weighted overlay technique were used, in ArcGIS9.2 environment using AHP extension, to generate malaria hazard map. For vulnerability analysis, health station location in Spatial Analyst/ module was used to generate distance to health center factor maps. Land use land cover map was used to generate element at risk factor map. Finally, malaria risk map of the District were generated in ArcGIS9.2 environment using spatial analyst/ raster calculator tool. This specific tool helps to multiply malaria risk factors (element at risk, vulnerability and hazard map).
3. DATA PROCESSING ANALYSIS
3.1 Introduction
Malaria transmission is strongly associated with environmental conditions, which control mosquito maturity and parasite development. Accordingly breeding sites, elevation, slope, and distance to stream are listed in order of importance. To assess malaria risk of the District using GIS and Remote Sensing, Multi-Criteria Evaluation was used. MCE is a procedure which needs several criteria to be evaluated to meet a specific objective.
The standardized raster layers were weighted using Eigen vector that is important to show the importance of each factor as compared to other in the contribution of malaria hazard. Accordingly, the Eigen vector of the weight of the factors was computed in ArcGIS 9.2 /AHP extension software. The computed Eigen vector, which is an output of the pair wise comparison matrix to produce a best fit set of weight, of Weight Module was: Distance to breeding site 0.1405, Elevation 0.2447, Slope 0.3229, Distance to stream 0.1065, Wetness index 0.1854 The consistency ratio (CR) of the calculated Eigen vector was 0.0435 which is acceptable. The computed Eigen vector was used as a coefficient for the respective factor maps to be combined in Weighted Overlay in Arc GIS environment. In malaria risk assessment all the factors remained accordingly their importance and Weighted Overlay.
3.2 Factor Development
3.2.1 Elevation factor
health, Ethiopia.1999). The elevation of the District was derived from 20 meter contour interval feature class which was digitized from topographic map of 1:50.000 scales and further rectified in GIS environment. This feature was converted 3D shape file using 3D analyst in convert feature to 3D module by interpolating contour using an attribute as a source. Further TIN was developed using 3D analyst in create TIN from feature 3D shape tin to raster elevation layer. The TIN was converted to DEM using TIN to raster option in 3D analysis tool. The elevation raster layer further reclassified into five sub groups and new values re-assigned in order of malaria hazard rating using ArcGIS/ArcMap 9.2.
3.2.2 Slope factor
Slope is other topographic parameter that may be associated with mosquito larval habitat formation, is the measurement of the rate-change of the land per unit distance which may affect the stability of the aquatic habitat (Stephen Munga, 2000). The slope of the study area was derived from 20 meter contour intervals feature class which was digitized from topographic map of 1:50.000 scale and further rectified in ArcGIS/ArcMap 9.2. This feature was converted to 3D shape file using 3D Analyst in convert feature to 3D module by interpolating contours using an attribute as a source. Further, TIN was developed using 3D analyst in create TIN from feature (3D shape). The TIN was converted to DEM using TIN to raster option in 3D analysis tool. Slope was derived using the DEM in 3D analysis tool using surface analysis surface/slope module. The slope raster layer was further reclassified in to five sub groups based on predefined slope class. The reclassified slope raster layer sub groups were ranked accordingly to the degree of suitability for malaria incidence in the locality. To elaborate, the steeper slope values are related to lesser malaria hazard and the gentler slope have high susceptible for malaria incidences. And new values re-assigned in order of Malaria hazard rating.
3.2.3 Distance to stream factor
Flow distance-to-stream may affect availability of the aquatic habitat and was calculated as the distance from a grid cell moving downstream to a stream grid cell defined by the Stream Raster grid .The advantage of using flow distance-to-stream rather than simple distance-distance-to-stream is that flow distance takes flow direction and landscape profile into consideration (Stephen Munga, 2000). The Flow distance to stream raster layer was generated from the DEM of the District using TauDEM(terrain analysis using Digital Elevation Model) specialized grid analysis/Flow Distance to Stream module. Taking heed of the maximum flying distance of anopheles mosquito from the distance to stream is 2 km as a basis for reclassification distance to the stream layer. Then river distance raster layer was further reclassified using natural break standard reclassification method in ARC GIS 9.2 software in to five subgroups and
the reclassified subgroups of stream distance raster layer were ranked according to mosquitoes flying distance threshold value, which means areas out of the flaying distance threshold were considered as less malaria risk level . And new values re-assigned in order of Malaria hazard rating.
3.2.4 Wetness index factor
Wetness index can affect the availability of mosquito in a given area. The wetness index factor contribute for malaria hazard, as the wetness of the land increase water holding capacity of the land increases and that would create a breeding site for the mosquito. The wetness index of the study Area was derived from 20 meter contour intervals feature class which was digitized from topographic map of 1:50.000 scale and further rectified in GIS environment. The Wetness index raster layer was generated from the DEM of the District using TauDEM (terrain analysis using Digital Elevation Model) specialized grid analysis/slope/area (wetness index inverse) module of ArcMap extension. Taking heed of the maximum and minimum index value of wetness of the study area, the raster was classified. Then wetness index raster layer was further reclassified using natural break standard reclassification method in ArcGIS 9.2 software in to five subgroups and the reclassified subgroups of wetness index raster layer were ranked according to the wetness index value, which means areas of less wetness index value were considered as less malaria risk level and areas of high wetness index value are considered as high malaria risk level. And new values re-assigned in order of Malaria hazard rating.
3.2.5 Distance to breeding site factor
One of environmental covariate significantly related to transmission intensity was distance from the water and wet land, indicating high transmission in the areas within 2 km of the water source (malaria journal of 2002). The breeding site was extracted from the wetness index factor raster map of the District. The wetness index shows the wetness level of the area under investigation. An index value greater than 0.007 according to the wetness index value obtained from the DEM of the District was taken as highly suspected area for mosquito breeding.
breeding site distance raster were ranked according to mosquitoes flying distance threshold value which means areas out of the flying distance are considered as less malaria hazard area and new values re-assigned in order of Malaria hazard rating.
3.2.6 Vulnerability (Accessibility index) factor
Vulnerability (Accessibility index) is prominent factor to malaria vulnerability. It was generated from Kebeles of the District health station point data and speed constant raster layer which was generated with equal allowable minimum car speed of town, 20km/hr. The health facilities location was digitized after georeferencing in ArcGIS9.2 environment. Spatial analyst/straight line distance tool was used to generate distance to health facilities raster layer. Spatial analyst/raster creation/create constant raster layer tool was used generate speed constant layer. Then spatial analyst/ raster calculator was used generate the accessibility to health facilities raster layer by dividing the distance to health facilities raster for speed constant raster layer. The result obtained was vulnerability (accessibility index) raster to malaria incidence. The pixel value was supposed to represent the time that would take for an individual traveling with car with the maximum allowable speed to a nearby health facility. The vulnerability raster was further reclassified in to 5 sub class. And the reclassified sub groups of vulnerability (accessibility index) raster layer were ranked according to the maximum minute that would take to arrive at nearby health facility. Minimum minutes to arrive at nearby health facilities are considered as less malaria vulnerable area. And new values re-assigned in order of Malaria vulnerability rating.
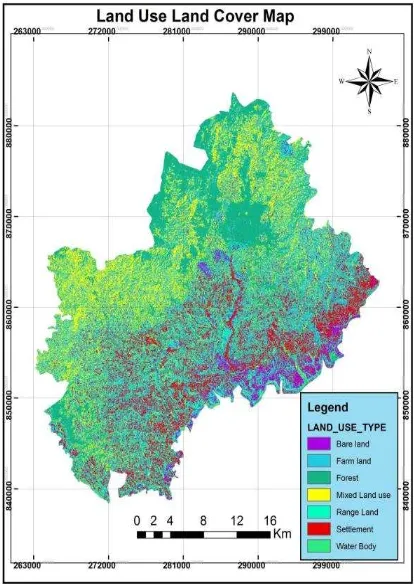
3.2.7 Land use land cover factor
The land use land cover was taken as element at risk that affect by malaria incidence. Land use is the way in which and the purpose for which human beings employ the land and its resources. Land cover by contrast the physical state of the land surface as in as in cropland, mountains or forests (Meyer 1995:25).The land use /land cover classes of Kersa District had been classified using Land sat ETM+ satellite image with a spatial resolution 30m.However, the coarse resolution bands (band 1, 2, 3, 4, 5 and 7) were layer stacked and spatially merged with high spatial resolution of (14.25m) panchromatic band 8 to enhance the resolution of the data in ENVI 4.0 using layer stacking and image sharpening tools respectively. The image generated with 14.25m spatial resolution was subsetted using the corner coordinate value of the study area in ENVI 4.0. Radiometric correction/ de-stripe was carried out on the subsetted image. ROI was collected from the field using GPS. Supervised classification method was carried out based on the AOI collected in ENVI 4.0 to classify the image in to seven basic classes (Settlement, Mixed Land use, Farm land, Rangeland, bare land, Forest, and Water body). The classified image was exported in to ArcGIS/ArcMap environment for further ranking and reclassification. Besides land use land cover of
the Kersa District was reclassified in seven sub groups in order their susceptibility and Suitability for malaria risk. Thus, the reclassified version implies 1 to 7, where 1 stands for highly affected land use land cover element and 7 for less affected land use / land cover elements.
Fig 9 Land Use Land Cover Factor Map (Element at Risk)
3.3 Malaria hazard analysis
parameter, the hazard layer was computed by over laying the five selected hazard parameter factors in ArcGIS 9.2/ArcMap AHP extension in GIS environment.
3.4 Malaria risk analysis
The development of malaria risk map of the District was done on the basis of Risk computation model (shook, 1999).
Risk = Element at risk * Hazard * vulnerability
………equation 1
The three components of malaria risk analysis are hazard, element at risk and vulnerability layers. The malaria hazard layers was computed by overlaying the five selected causative factors like distance to breeding site, elevation, slope, and distance to streams and wetness index raster layer, in weighted over lay module in the ArcGIS 9.2 software. The element at risk layer was developed by rasterizing and reclassifying land use/ land cover image file on the basis of malaria susceptibility of each land use/ land cover image file on the basis of malaria susceptibility of each land use/ land cover classes. Moreover, vulnerability layer was developed by computing distance module on the layer that was developed by computing health facility per population index density on the existing number of health facilities distribution per population distribution. In continuation, all the three components of risk were taken with equal importance for malaria risk. Finally raster calculator was used to multiply the three components of risk. The final out put raster layer generated by multiplying the risk components was the malaria risk raster layer, and it was reclassified according to the risk level in to five sub groups as very high, high, moderate, low and very low risk areas.
4. RESULTS AND DISCUSSION
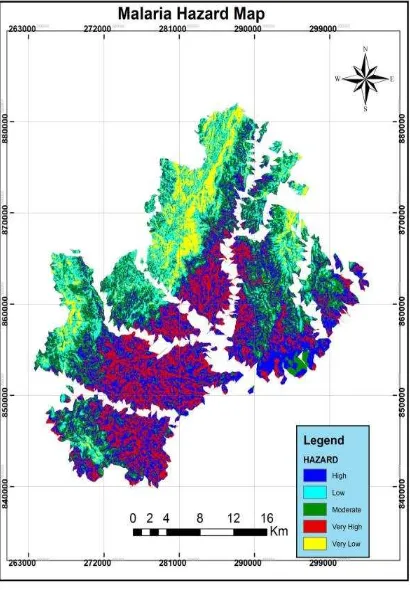
4.1 Identified Areas of Malaria Hazard
Hazard is the probability of occurrence of damaging natural phenomenon within specified period of time. As a hazard, malaria incidence is mapped by depending on some of the environmental factors which contribute for the survival of Anopheles mosquitoes. For the purpose of identifying areas of malaria hazard, this study focused on elevation, slope, distance to streams, distance to breeding site and wetness index as the factors of malaria incidence in the study area. The malaria incidence and transmission requires the environment with lower elevation (higher temperature), abundance of wet lands, occurrence of gentle slopes, availability of still waters around rivers, and areas of lower drainage density (Negasi, 2008). It is by overlaying these factors that areas vulnerable to malaria were identified. The overlay analysis was done after each factor was given the appropriate weight according to the degree of importance that they have for the incidence of malaria in this research.
Pair wise Comparison of the five parameters was carried out to develop the pair wise comparison matrix. After the overlay analysis of the five factors namely; elevation, slope, distance to streams, distance to breeding site and wetness index, the malaria hazard map in was produced.
No Classification Pixel count
Area Km2
Percentage (%)
1 Very High 674165 137 19.2
2 High 1085975 220 30.8
3 Moderate 883755 180 25.1
4 Low 582872 118 16.6
5 Very Low 295142 60 8.3
Table 4.1 Malaria Hazard Rating Area Coverage and Percentage
According to the malaria hazard map it was estimated that 19.2%, 30.8%, 25.1%, 16.6% and 8.3% of the District were subjected to very high, high, moderate, low and very low malaria hazard area respectively.
Fig 10 Malaria Hazard Map
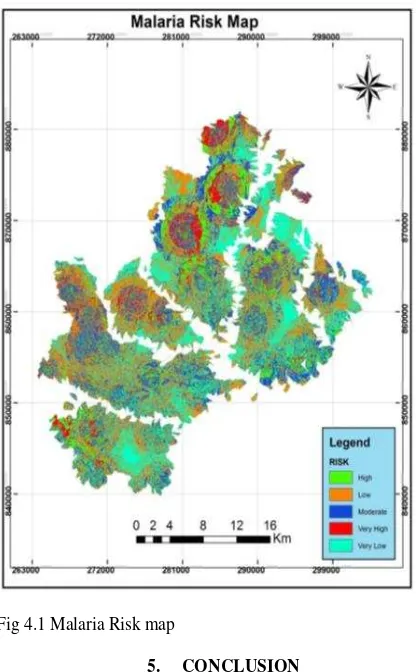
4.2 Identified Areas of Malaria Risk
In assessing the area in urgent need of attention to fight against Malaria, hazard mapping which is based solely on natural conditions is not sufficient but socio-economic factors, such as population density, distribution of health facilities, and land use land cover should also be included. Because, it is only then that one can site the area where
there’s high risk of malaria. The malaria hazard map, health
were multiplied and malaria risk indicator map was generated. The basis for the calculation of the map was the risk computation model developed According to (shook, 1999).
According to the malaria risk map it was estimated that 20.5%, 11.6%, 23.8%, 34.1% and 26.4% of the District were subjected to very high, high, moderate, low and very low malaria risk areas respectively.
No Classification Pixel count
Area Km2
Percentage (%)
1 Very High 143646 29.2 4.1
2 High 408534 83.0 11.6
3 Moderate 840471 170.7 23.6
4 Low 1199508 243.6 34.1
5 Very Low 928800 188.6 26.4 Table 4.1 Malaria Risk Rating, Area Coverage and Percentage
Fig 4.1 Malaria Risk map
5. CONCLUSION
The environmental drivers that determine the life cycles of both the vector and the parasite are complex, they can be monitored and analyzed using newly available technologies of RS and GIS. This research has shown that GIS and remote sensing is important to create operational maps which could help the vector control agencies to identify hazard and risk areas for disease control.
Risk maps are fundamental for estimating the scale of the risk, and hence the resources needed to combat malaria.
They provide benchmarks for assessing the progress of control and indicate which geographic areas should be prioritized. According to the result of the findings large area of the District is located on risk area for malaria. In this study pair wise comparison method of malaria hazard map generation is a good approach to deduce a sound decision for a forthcoming malaria disaster. This research confirmed the method used was capable to integrate all the malaria hazard causative factors and the components of malaria risk as well in a GIS environment. One of the Multi Criteria Evaluation technique which is known as Weighted Overlay in GIS environment was shown to be useful for delineating areas at different rating in terms of malaria hazard and malaria risk. Moreover, factor weight computation in AHP module, that is developed by providing a series of pair wise comparisons of the relative importance of factors to the suitability of pixels for the activity being evaluated, has generated valuable information. This could be useful for disaster control in the future. Therefore, it has been shown that MCE GIS based model combination has potentiality to provide rational and non-biased approach in making decisions in disaster studies.
Based on the spatial distribution of anopheles mosquito habitats the government, and NGO need to pay attention for indoor Residual Spraying or application of long acting chemical insecticides on the walls and roofs of all houses in order to kill adult vector mosquitoes that land and rest on these surfaces and distribution of treated bed nets.
References
1. Ashenafi, M. (2003). “Design and water management of irrigation systems to control breeding of Anopheles mosquitoes. Case study: Hara irrigation project, Arba Minch”, Ethiopia. M.Sc. Thesis. Wageningen University, Wageningen. The Netherlands.
2. Bian L, Mushinzimana, E., Munga S., Minakawa N. and Feng C. (2002/6). “Landscape determinants and remote sensing of anopheline mosquito larval habitats in the western Kenya highlands” Malaria journal 5:13. 3. Daniel, E. (1999). “Malaria: Failure, Puzzle, &Challenge” Perspectives in health. Media center press release megazine.No.1. 74
4. Felix P Amerasinghe (2003). “Towards a Risk Map of Malaria for Sri Lanka: the Importance of House Location Relative to Vector Breeding Sites” International Journal of Epidemiology 2003, Great Britain.
5. FMoH (2009) “National Strategic Plan for Malaria Prevention, Control and Elimination in Ethiopia 2010 – 2015”. Federal Ministry of Health, Addis Ababa, Ethiopia
7. Negassi Fisseha (2008) “Identifying, Mapping and Evaluating Environmental factors Affecting Malaria Transmission Using GIS and RS in Selected Kebeles of Adama district, Oromia Region”. MSc Thesis, AAU. 8. Stephen Munga (2006).”landscape determinants and
remote sensing of mosquito larval habitats in the high land of Kenya” Malaria journal.
9. Shook, G (1997). “An assessment of disaster risk and its management in Thailand”, Disasters 21(1): 77-88 10. WHO (2002). World Malaria Report. WHO Technique
Report. WHO