COMPLEX BUILDING DETECTION THROUGH INTEGRATING LIDAR AND AERIAL
PHOTOS
R. Zhai
College of Informatics, Huazhong Agricultural University, 430070, Wuhan, China, [email protected]
Commission V, WG V/4
KEY WORDS: Building Detection, LiDAR, Aerial Imagery, Image Segmentation, Multiple Seed Selection, Region Growing
ABSTRACT:
This paper proposes a new approach on digital building detection through the integration of LiDAR data and aerial imagery. It is known that most building rooftops are represented by different regions from different seed pixels. Considering the principals of image segmentation, this paper employs a new region based technique to segment images, combining both the advantages of LiDAR and aerial images together. First, multiple seed points are selected by taking several constraints into consideration in an automated way. Then, the region growing procedures proceed by combining the elevation attribute from LiDAR data, visibility attribute from DEM (Digital Elevation Model), and radiometric attribute from warped images in the segmentation. Through this combination, the pixels with similar height, visibility, and spectral attributes are merged into one region, which are believed to represent the whole building area. The proposed methodology was implemented on real data and competitive results were achieved.
1. INTRODUCTION
The acquisition of building positions can not only provide basic information for wise earth, and also it provides decision making support for governments. Therefore, there is an increasing demand for digital building model (DBM) generation. Automated building detection in urban areas is one of the difficult problems in photogrammetry even with the advent of LiDAR techniques.
Digital Building Model generation is usually performed in two steps: building detection/recognition and building reconstruction. Building detection is the process of generating the building hypothesis by differentiating buildings from other objects within the data. Building reconstruction, on the other hand, utilizes the hypothesized building regions in the data to derive the building model parameters for its 3D representation (Ma, 2004). A number of authors have proposed the integration of different data sources in 3D building reconstruction. The integration of imagery and 2D GIS data (i.e. building ground plans) has been proposed by Suveg (2004). The use of the ground plans helps in the building hypothesis generation and provides clues about the structure of the building. This is particularly useful in the process of partitioning the building into simple parts when using the CSG model. The integrated use of LiDAR and 2D GIS data for DBM generation has been exploited by Haala (1998) and Suveg (2001). They also employ the CSG model in the reconstruction process. The ground plans are subdivided into rectangular primitives and the selection of the parametric primitive for each 2D rectangle is based on the analysis of the LiDAR DSM. Although existing ground plans can be useful information in the sense that they reduce the search space in the reconstruction procedure, they might be out-of-date, incomplete or not co-aligned with LiDAR or imagery data.
Since the advent of LiDAR data, the integration of LiDAR and photogrammetric data for DBM generation has been the target of research of a number of authors (Rottensteiner, 2002;
McIntosh, 2002; Seo, 2003; Ma, 2004). This integration is mainly motivated by their complementary nature (Habib, 2004; Baltasavias, 1999). The main pitfall of DBM generation using only LiDAR is the lack of accuracy of the generated building boundaries. Since photogrammetry provides accurate breakline definition, and its integration with LiDAR can lead to a more accurate and automated DBM generation. Most of the researches proposing the integration of LiDAR and imagery data perform the building hypothesis generation and the building reconstruction using only LiDAR data (Seo, 2003; Ma, 2004), before the data are integrated. The outcome is an initial building model in the sense that its boundaries must be refined. Before the two data are integrated to refine the DBM, the photogrammetric and LiDAR data should be co-aligned relative to the same reference frame. For this purpose, LiDAR features can be used to georeference the imagery relative to the LiDAR reference frame. Since point primitives are not appropriate for LiDAR surfaces due to its irregular nature, other primitives such as lines and planar patches are usually employed (Habib, 2004; Ma, 2004). After the co-registration of the data, the initial LiDAR-derived building boundaries can be projected to the image space. The image edges are usually detected using the Canny edge detector (Canny, 1986). The projected building model is very close to the building boundary edges in the image. In this regard, valuable clues are provided for reducing the search space for matching of conjugate building edges. In addition, the plane parameters for the building roof planes, which are derived from the LiDAR data, provide additional constraints in the photogrammetric reconstruction process increasing its reliability and accuracy. After the imagery edges are correctly detected, they can be used to refine the projected model edges. Finally the refined DBM can be generated. Kwaw(2013) focused on generating building models by using a model-driven method. The focus of the research is generating models with right-angled-corners, which can be described with a collection of rectangles (e.g., L-shape, T-shape, U-shape, gable roofs, and more complex building shapes which are combinations of the aforementioned shapes), under the assumption that the majority of the buildings in urban areas
belong to this category.
In this research, building rooftop patch can be segmented from large amount of LiDAR data, and rough building rooftop boundaries are generated as well, however, the derived building boundaries are still not exact to some extent because of the irregularity of LiDAR data. It is believed the integration of LiDAR data and aerial imagery will come up with more reliable and high accurate building rooftop boundaries. Line feature detection and matching is the common way employing aerial imagery for building rooftop reconstruction. It is relatively easy to detect linear features from imagery, on the other hand, failed linear feature detection and line matching will also lead to non-reliable building boundaries. In this case, region growing methods are believed to give good segmentations that correspond well to the observed edges (Zhai, 2008). Combining region growing results from left and right images will represent whole rooftop area. This paper will be mainly focusing on the issues related to region oriented building rooftop generation.
The paper is organized as follows. Section 2 introduces and analyzes the proposed methodology used in our research, and the subparts will look at each of these questions. It will be shown that these questions are useful as a suitable base for analyzing the proposed techniques, although some of the questions are not entirely independent. Section 3 will do the experiments by using real datasets and analysis, which demonstrates the feasibility of the proposed method. The conclusion and future work is drawn in Section 4.
2. METHODOLOGIES
The process of extracting and representing information from an image to group pixels together into regions of similarity is commonly called segmentation (Fan, 2004). In 2D imagery, we would like to group pixels together according to the rate of change of their intensity and other properties (attributes) over a region. As for building rooftops, it is known that most building rooftops are represented by different regions from different seed pixels. Considering the purpose of this research and the principals of image segmentation, this paper employs a new region based technique to segment images, combining the advantages of cluster based and region based techniques. In the image segmentation process, we combine the elevation attribute from LiDAR data, visibility attribute from DEM (Digital Elevation Model), and radiometric attribute from warped images in the segmentation. Through this combination, the pixels with similar height, visibility, and spectral attributes are merged into one region. There are several questions to be answered through the process of automated building rooftop reconstruction based on this methodology. Each of the subsections will be explaining all the questions in detail.
2.1 Input Data
As introduced above, the segmentation procedures proceed by taking advantage of several attributes from different data source. Thus, several data are considered as the input data source, building roof patch generated from LiDAR data, building boundaries generated from LiDAR data, left and right warped image, left and right visibility maps, and Colour histogram of the building rooftop area. Each of them will be described in detail as follows.
Building patch generated from LiDAR data. As abovementioned, segmentation technique of LiDAR data has
and rough building boundaries (Kim, 2007). Planar patch is generated by fitting large set of discrete LiDAR points located at a same plane. Therefore, the segmentation technique can successfully identify the LiDAR points located on a building rooftop, which will be the rough building rooftop area because of the irregularity of LiDAR data.
Building boundaries generated from LiDAR data. The derived boundaries (Kim, 2007) do not represent the actual boundaries of the physical objects being segmented. In other words, these are the boundaries as determined by the LiDAR footprints, and their deviation from the actual physical boundaries depends on the average point density of the LiDAR data. However, they are still the rough boundaries of building rooftops. If these boundaries are projected onto imagery, it is expected that the derived boundaries will be rough estimates of rooftop boundaries.
Left and Right warped images. Distortions caused by different angles of viewing must be rectified. It is necessary to ensure that the imaging distortion does not affect the estimation of building rooftop area. For this purpose, we use a combination of a warping algorithm with assigning pixel values to an output image (matrix) after the transformation. The assigning is performed by resampling algorithms. Thus, in warping algorithms there are two main steps: (i) transformation and (ii) resampling. A warped image is computed by indirect transformation between input image and out image. Here, the mathematical model of the transformation is projective transformation. First, a plane segmented from LiDAR data is extracted and its range is determined from the derived rough boundary. The range of the plane is more extended than the exact boundary of the derived rough boundary while considering the resolution of LiDAR data. Using simple projective transformation, the corresponding colour (or grey) value from the original imagery is registered on the positions of each object point on the segmented plane. Two warped images are generated by projecting the left and right original images of a stereo-pair onto the relevant segmented plane. In addition, the original imagery and LiDAR data are integrated through the common reference frame and the warped images are produced. The utilization of the warped images will provide great benefit in the proposed DBM generation methodologies by handling spectral and positional information simultaneously (Kim, 2009).
Left and Right visibility maps (Habib, 2007). The visibility map is a data structure that describes the projection of the visible scene onto the image plane. The visibility of every cell from the observer cell is computed. Visibility is calculated by measuring the off-nadir angle from the observer's eye to each cell starting from the cells which are the closest to the observer. As long as the off-nadir angle increases in the line of site from the observer, the cell is considered as visible. If the off-nadir angle decreases, the cell is not visible anymore. In this research, the visibility map is generated using the generated DEM from LiDAR data and corresponding image EOP and IOP. The resolution of the visibility image should be consistent with the resolution of warped images. Therefore, interpolation techniques are introduced in the visibility map generation.
Colour histogram of the building rooftop area. A colour histogram is a representation of the distribution of colours in an image, derived by counting the number of pixels of each of a given set of colour ranges in a typically two dimensional or three dimensional colour space. In this work, the colour histogram will be done in 3D colour space, and only related to
2.2 Multi Seed Pixel Selection
One building rooftop is most likely composed of multiple regions. Therefore, it is not probably that only one region growing from one seed pixel will represent an entire building rooftop. The projected boundaries from LiDAR, as we have mentioned, will be the rough estimates of building boundaries. We are mainly interested in the image area located inside the LiDAR boundary, which is referred to as the Area of Interest (AOI) in this research. As previously mentioned, one building rooftop is probably composed of several different parts, i.e., multiple seed pixels should be selected before region growing proceeds. Therefore, this section will be focusing on this issue and proposing several conditions that one seed pixel should satisfy.
In order to find appropriate seed pixels, the following criteria that a seed pixel should satisfy are: Seed pixel should be located inside the area defined by the projected boundary from the LiDAR data, i.e. within the AOI. Colour at the seed pixel should correspond to, or be sufficiently close to, a peak in the colour histogram in the AOI. Seed pixel should be located within a homogeneous area. That is, the standard deviation of gray values in a window (e.g., 5*5) should be less than a given threshold (e.g., 10.0). Height at seed pixel is consistent with the height of the segmented LiDAR patch; Seed pixel should be located inside the visible area. As we have a visibility map, if one pixel satisfies the first four constraints, but is not visible in the visibility map, this pixel should not be considered as a seed pixel.
The detailed procedures of multiple seed point selection can be illustrated as follows. Pick up all the pixels inside the initial LiDAR boundary to generate a new image (Image_1), with same size to original image (Image_0), shown as Figure 1(a) and Figure 1(b), respectively. Do histogram statistics (Figure 1(c)) to the generated image (Image_1), without considering the black area; Pick up the pixel at the first peak in the histogram, check the height constraint, homogeneous characteristic, and the statistics number of this pixel. If all of these conditions are satisfied, this point will be determined as the first seed point, do region growing. A new image (Image_2) will be generated through region growing using the first seed point. Check the ratio between the area inside the LiDAR boundary from Image_2 and Image_1. If the ratio is smaller than the given threshold, go to Step . Area ratio computation is defined as Equation (1). Generate a new image with all pixels as black. Considering image (I_2), set the gray values of all segmented pixels inside the LiDAR boundary as black, to generate this new image (I_3). Do histogram statistics for the new generated image (I_3). Repeat Step - , till there is no new seed point, or the ratio between the segmented region to the region inside the LiDAR boundary is smaller than one threshold (e.g., 0.95)
_ _1
_
_ _ _ _
growing area area ratio
image area inside LiDAR boundary
=
1 Where area_ratio defines the ratio between growing regions
and the building area
growing_area 1 defines the region area from one seed point
image_area_inside_LiDAR_boundary defines the whole building roof top area inside the initial building boundary generated from LiDAR data
(a)Image_0 (b)Image_1 (c) Histogram: I_1
(d) Image_2 (e) Image_3 (f) Histogram: I_3
(g) Grwoing Region from Seed 1
(h)Grwoing Region from Seed 2
(i)Combined Regions
Figure 1 Multiple seed selection
2.3 Region growing strategy based on multiple seed pixels
After one seed pixel is selected, region growing proceeds increasing the size of the region by adding in neighbouring pixels that are similar with respect to one or more properties, e.g. colour, visibility and height properties.
Colour Consistency in Region Growing. As we have multiple bands(R, G and B), there can be various stopping conditions combining stop conditions in individual bands during the region growing procedures, strict condition and loose condition(Habib, 1999). In particular, strict condition means the region growing procedure stops only when all the three bands, Red, Green, and Blue, satisfy the stop condition. While loose condition means the growing procedure stops one of them satisfies the stop condition. In the research, we are using strict condition, but we have one extra condition as in the 8-connected neighbourhood, number of pixels satisfying this loose condition should be greater than the 4. Two threshold values are defined in region growing procedures by considering colour consistency: Mean threshold value (μ), and range threshold value (σ). Mean threshold value is the mean gray value of segmented area. The initial value is defined by the gray value of seed pixel. In the process of region growing, it is determined by the mean gray value of the segmented image area based on one seed pixel. Range threshold value is the standard deviation of the gray value in growing the region. The initial value is given by the user, or comes from the standard deviation of the check window, which is used for seed pixel selection.
Growing Region 1
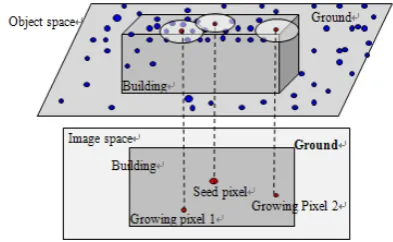
The segmented building rooftop patch from LiDAR data is more reliable than the LiDAR-derived boundaries. Thus, the height of the image pixels located on the roof area should be consistent with the segmented LiDAR patch, which is introduced in the region growing procedures as height consistency with the segmented LiDAR building rooftop patchA pixel, with the height constraint no more than a given threshold between the 3D point corresponding to this pixel and the LiDAR plane, will be added to the growing region. Two threshold values will be defined in the region growing process, by considering height consistency between the point being checked and the height of the segmented building rooftop: radius threshold value in X, Y plane (r_thr) and height threshold value (h_thr). r_thr defines the radius of a circle, which is used to check whether there is a LiDAR point close to a certain 3D point in this circle., while height threshold value (h_thr); defines the maximum distance between the searched LiDAR point corresponding with the checking pixel and segmented LiDAR planar patch.
Given one seed pixel shown in Figure 2 in image space, the corresponding 3D coordinates (X, Y, Z) can be computed using projective transformation. Define a circle with a given radius r_thr, centered at (X, Y), to search the closest LiDAR point in all the LiDAR data, including ground LiDAR points and non-ground LiDAR points. If there is no LiDAR data available in the certain search area, region growing will stops at that pixel, on the other hand, once some LiDAR points are found in the circle, the distance between the searched LiDAR data and the segmented LiDAR planar patch is computed, only when the distance is less than the given threshold h_thr, the region will keep growing, or it will also stop. Growing pixel 2 shows this case. It avoids the case that some building regions will invade into other building rooftops or ground area, given the color between the building rooftop and other objects are consistent.
Figure 2. Height consistency constrained in region growing
By considering height consistency in region growing, a radius threshold value is defined when utilizing visibility information. Radius threshold value in visibility map (r_thr_visiblity) defines the radius of a circle so as to check whether the added point is located inside the visible area. When one new pixel (x, y) is added to a region, all the pixels located inside the circle, centered at the checking pixel (x, y) with the given radius (r_thr_visiblity), are checked to find if there are image pixels that are visible in this circle area. If yes, the region growing process will proceed, otherwise it will stop at the pixel (x, y).
Visibility images are generated using a DEM from LiDAR data and available image EOPs. In building areas, especially in urban areas, a visibility map is a useful way to determine whether a certain area is visible in image space. If there are occluded parts
on the building rooftop, they will be invisible in the visibility map.
Figure 3. Visibility Consistency constrained in growing
2.4 Region growing procedures
The rough building rooftop boundaries derived from LiDAR data, visibility map generated from DEM, and warped images from different viewpoints, are all considered in order to segment the whole building rooftop area from warped images. The procedures of the region growing for segmentation are as follows. Select seed pixels that satisfy the criteria specified above; Region growing from the first selected seed pixel is performed until there are no other neighbouring pixels to be added to the region; Remove the segmented region in the AOI, and check whether there is another seed pixel that can be selected; Region growing from another seed pixel occurs, until there are no other pixels to be added to the current region;
Repeat Step 3)-4). Region growing will stop if there is no other possible seed pixel; Implement all the above steps in both left warped image and right image. Rooftop regions are represented in the left and right images respectively .The whole rooftop building area will be represented by combining all the regions grown from left and right images, which are illustrated as Figure 4.
Figure 4. Roof region defined by combining the segmented left and right regions
2.5 How to derive boundaries using segmented regions
In order to generate building boundaries using segmented regions from warped images. As mentioned above, the segmented regions are composed of small regions coming from different seed pixels, also, there are some small holes existing in the combination of images. What we are interested are the outer boundaries of the segmented regions. Thus, inflation and erosion is first used to remove the small holes. Then, the generated area is utilized for boundary generation. In this research, LSD (Line Segment Detector) Detector is adapted to
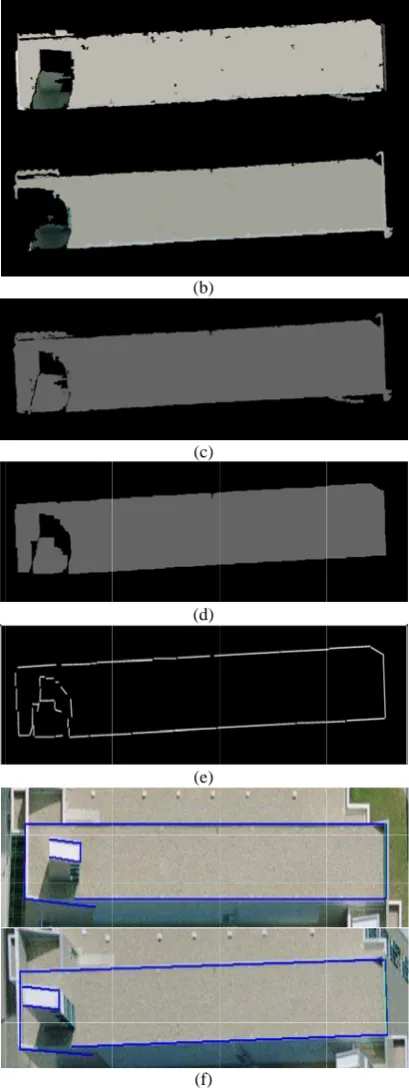
3. EXPER height of the p region growin shows the buil building rooft Figure 5(d). F the segmentati the result by u extraction and gray value to c set as 10.0. M
cquired at a fly spacing of 0.75 y, with an imag he proposed pr esults for two s nd Figure 6, re s a rectangular wn inside the ell
m LiDAR data to generate a sm f top area, res
sults from lef thodology in th
rt is not includ he height consi
protruding part ng procedures w lding area comb top area after Figure 5(e) show
ion results by u using the edge d matching we luded by the hi aken into consi op is also inclu
rocess of impl ould be set. The check whether ataset is from an ying height of 5m, and vertica ge scale 1:5000 rocedures used specific building espectively. As r building with lipse. The initia a were projecte mall image wh pectively. Figu ft and right im
his research. A ded in the reg istency. In oth is higher than will not invade t bining the left a inflation and e ws the line seg using LBD meth
information, s ere also implem as Figure 5(f) (H ults on another her higher neigh e threshold for s the point is in h gray value thr
20.0. Besides, inside LiDAR boundary is set a
(a) al accuracy of 1 0, was also acqu in this research g roofs are pres
shown in Figu one protruding al building boun ed onto the lef hich only includ
that of the roo this area. Figure we can see from e of the area in l
Since multiple egion outside o the ellipse in F
procedures, se standard deviati homogeneous a eshold in the r , area ratio bet R boundary an ived from the s
(b) r inflation and e egmented resul
from left & rig
on building one data projected ts from left & r ng left & right i erosion; (e)the
(a) ived from the s
have introduce firms that the co derive better re
ure work will f erate building m al and Space Im
ny, J., 1986. A
E Transaction lligence, 8, pp. 6
ksher F. A., Be r inflation and e egmented resul
from left & rig
4. CONCLU model by using t
the accuracy a ith other mod ion based and e
order to gene
CKNOWLED
like to express who is with C ng left & right i erosion; (e)the lts; (f) matched ght images
USIONS
ed approach to rial imagery an w that the prop ing boundaries
The building istance of the L LiDAR data an g either of them
testing with r uld like to than
the National N
al approach to e
rn Analysis
LiDAR Data. Photogrammetric Engineering and Remote
Sensing Journal, 76(5), pp. 609-623.
Habib, A., E. Kim, and C. Kim, 2007, New methodologies for true orthophoto generation, Photogrammetric Engineering and
Remote Sensing, 73(1), pp. 25-36.
Habib, A., Uebbing, R., and Novak, K., 1999. Automatic Extraction of Road Signs from Color Terrestrial Imagery.
Photogrammetric Engineering and Remote Sensing, 65(5):
597-601.
Haala, N., Brenner, C., and Anders, K., 1998. 3D urban GIS from laser altimeter and 2D map data, http://www.ifp.uni-stuttgart.de/publications/1998/ohio_laser.pdf (accessed Jan 2015).
Kwak, E., 2013. Automatic 3D Building Model Generation by Integrating LiDAR and Aerial Images Using a Hybrid Approach, ph.D. dissertation, The University of Calgary, Canada.
Kim C., Habib A., and Mrstik P., 2007, New approach for planar patch segmentation using airborne laser scanner. ASPRS
2007 annual conference, Tampa, Florida May 7-11.
Ma, R., 2004. Building Model Reconstruction from LIDAR Data and Arial Photographs, Ph.D. dissertation, The Ohio State University.
McIntosh, K. and Krupnik, A., 2002. Integration of laser-derived DSMs and matched image edges for generating an accurate surface model, ISPRS Journal of Photogrammetry and
Remote Sensing, 56, pp. 167-176, 2002.
Rafael Grompone von Gioi, Jérémie Jakubowicz, Jean-Michel Morel, and Gregory Randall, LSD: a Line Segment Detector, Image Processing On Line, 2 (2012), pp. 35–55.
Rottensteiner, F. and Briese, Ch., 2002. A new method for building extraction in urban areas from high-resolution LIDAR data, International Archives of Photogrammetry Remote
Sensing and Spatial Information Sciences, 2002, 34(3/A):
295~301.
Seo, S., 2003. Model Based Automatic Building Extraction from LIDAR and Aerial Imagery, Ph.D. dissertation, The Ohio State University.
Suveg, I., Vosselman, G., 2004. Reconstruction of 3D building models from aerial images and maps. ISPRS Journal of
Photogrammetry and Remote Sensing, 58, pp. 202–224.
Zhai R., Habib F., 2008, Use of LiDAR data to constraint the matching of conjugate features in large-scale imagery over urban areas, ASPRS 2008 annual conference, Portland, Oregon, April 28 – May 2.