SEASONAL VARIATION OF LAND COVER CLASSIFICATION ACCURACY OF
LANDSAT 8 IMAGES IN BURKINA FASO
J. Liu a, *, J. Heiskanen a, E. Aynekulu b, P. K. E. Pellikka a
a University of Helsinki, Department of Geosciences and Geography, P.O. Box 68, FI-00014, Helsinki, Finland – (jinxiu.liu, janne.heiskanen, petri.pellikka)@helsinki.fi
b World Agroforestry Centre, United Nations Avenue, P.O. Box 30677, Nairobi, 00100, Kenya – [email protected]
KEY WORDS : Phenology, Classification, Random Forest
ABS TRACT:
In the seasonal tropics, vegetation shows large reflectance variation because of phenology, which complicates land cover change monitoring. Ideally, multi-temporal images for change monitoring should be from the same season, but availability of cloud-free images is limited in wet season in comparison to dry season. Our aim was to investigate how land cover classification accuracy depends on the season in southern Burkina Faso by analyzing 14 Landsat 8 OLI images from April 2013 to April 2014. Because all the images were acquired within one year, we assumed that most of the observed variation between the images was due to phenology . All the images were cloud masked and atmospherically corrected. Field data was collected from 160 field plots located within a 10 km × 10 km study area between December 2013 and February 2014. The plots were classified to closed forest, open forest and cropland, and used as training and validation data. Random forest classifier was employed for classifications. According to the results, there is a tendency for higher classification accuracy towards the dry season. The highest classification accuracy was provided by an image from December, which corresponds to the dry season and minimum NDVI period. In contrast, an image from October, which corresponds to the wet season and maximum NDVI period provided the lowest accuracy. Furthermore, the multi-temporal classification based on dry and wet season images had higher accuracy than single image classifications, but the improvement was small because seasonal changes affect similarly to the different land cover classes.
* Corresponding author
1. INTRODUCTION
Land cover influences the energy balance, carbon budget and hydrological cycle, and land cover classification is the basis for many environmental applications (Zhu and Woodcock, 2014). Remote sensing data with its ability of frequent revisit, large coverage and relatively low cost has become a reliable data source for land cover classification.
In most parts of the world, land surface reflectance shows intra-annual variation due to phenology , which complicates land cover classification. If the land cover classification is based on a single image, one has to select it among all the images acquired in one year. This decision is usually made based on the assumption that images from a particular season are most appropriate for separating land cover types under interest. Furthermore, if land cover classifications based on single images are used for land cover monitoring, the images from the same season are preferred in order to avoid detecting false changes in land cover due to phenology (Clark and Pellikka, 2009). Often, images close to the peak of the growing season or time of maximum vegetation “greenness” have been preferred (Kim et al., 2011; Zhu and Liu, 2014). However, in practice image selection is also affected by
cloud cover of the images in order to avoid gaps in the classification map and need for processing several images.
With the opening free access to the Landsat archive, we now have more than 30 years of Earth observations, which makes Landsat a valuable source of data for long term land cover monitoring (Wulder et al., 2012). From the free Landsat archive, it is feasible to acquire multiple images for particular year, which enable us to study how season affects to the classification accuracy and get advice on image selection. In the seasonal tropics, the cloud-free images are usually available from the dry season but not necessarily every year from the late wet season, when maximum “greenness” occurs. Therefore, it would be important to know how accurately land cover can be classified using dry season images in comparison to commonly preferred maximum “greenness” images.
However, it is unclear how classification accuracy depends on the seasons when multi-temporal images were acquired.
Our objective was to investigate how the classification accuracy depends on the season of the selected image in our study area in southern Burkina Faso. We used images from one year and assumed that there were no land cover changes during that period. Hence, all the variation in the classification results should be due to phenology. Furthermore, we also aimed to find out whether the combination of images improves the classification accuracy , and how the accuracy is related to the seasons of the images used.
In order to accomplish our objectives, we designed three classification scenarios: (1) using each single date Landsat image separately ; (2) using each single date Landsat image together with the image providing the highest classification accuracy; (3) using all the Landsat images from one year.
2. MATERIAL AND METHODS
2.1 S tudy area and field data
The study area is located in the southern Burkina Faso (11°44'55"N 1°56'34"W). The annual mean temperature for 1950–2000 was 27.5°C and annual mean precipitation was 826 mm (Hijmans et al., 2005). The most of the precipitation falls between M ay and September. The driest months are December, January and February . According to the WWF Global Ecoregions map, the site belongs to the West Sudanian Savanna (Olson et al., 2001). The land cover is characterized by forest, savannah woodland and croplands (e.g., sorghum, millet, maize, cotton). Topographically , the study area is relatively flat with the mean elevation of 350 m. In the summer time (wet season), satellite images are likely to have clouds, and in the winter time (dry season), wild fires are common in the area.
Field data was collected from 160 field plots located within a 10 km × 10 km study area between December 2013 and February 2014 following the Land Degradation Surveillance Framework (LDSF) (UNEP, 2012). According to the tree crown cover (CC) and information on land use (cultivated or not), we divided field data into three land cover categories, including closed forest (CC > 40%), open forest (CC 40% and not cultivated) and Observation and Science (EROS) Centre archive. Considering the cloud contamination, we selected 14 images for further analysis. These 14 images covered all the seasons and phenological variation in the study area. In order to reduce the atmospheric effects on the images, the raw DN values were converted to the surface reflectance with the fast line-of-sight atmospheric analysis of hypercubes (FLAASH) module in
ENVI software (ITT, 2009). In addition, we used only bands 2– 7 (i.e. six bands in blue to short wave infrared range) for classification. The cloud and cloud shadows in the 14 images were masked with Fmask-method (Zhu and Woodcock, 2012). After the pre-processing, we calculated the percentage of cloud-free area for each image and our study area (Table 1).
Date Percentage cloud-free
Table 1. Summary of the 14 Landsat OLI images used.
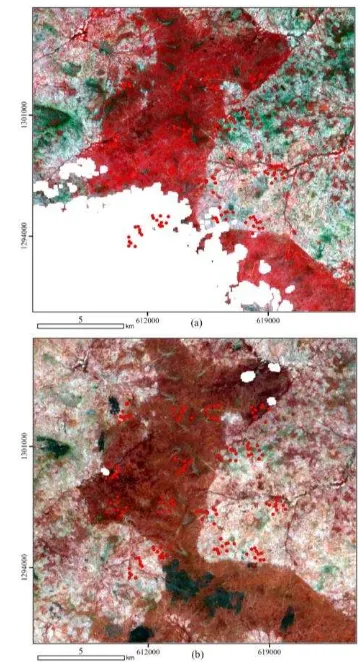
Figure 1. Examples of (a) wet and (b) dry season images.
clouds but some burn scars can be observed as dark patches. Because some of the field plots were covered by clouds, we kept only plots which were cloud free in all 14 images. This was done in order to have consistent data set for all dates. Furthermore, we excluded all the plots that were severely affected by fire according to the visual interpretation of each image. Finally, we used 78 plots for the classification.
2.3 Methods
Random forest classifier was employed for classification tests. This algorithm is increasingly being applied in remote sensing and ecology (Horning, 2010; Cutler et al., 2007).
Random forest is an ensemble decision tree-based classifier. It begins with generating a large number of decision trees. It uses bootstrap samples with replacement to grow a large collection of classification trees. Each tree is trained using two-thirds of randomly selected training samples and the remaining one-third of the samples, so called out of bag (OOB) samples, are reserved to estimate prediction error (Breiman, 2001). In each node of the tree, the split variable is also randomly selected. The prediction is determined by evaluating the responses from all the trees. Pixels are assigned to each class based on a majority voting rule which assigns a pixel to the class with the maximum number of votes. The strong law of large numbers ensures that the solution always converges without overfitting (Ghimier et al., 2010).
There are two parameters in Random forest classifier: the number of trees and the number of split variables at each node. For the number of split variables at each node, the square root of the total number of variables has been suggested (Zhu et al., 2012). In our study, we used 1000 for the number of trees and the square root of the total number of variables as the number of split variables.
The OOB error has been used to evaluate classification accuracy in remote sensing, and it is often ideal for smaller data sets as it allows for all information to be included within classification tree construction (Watts et al., 2011). Because there was limited number of field plots in our study , we used OOB error for estimating classification overall accuracy (OA), user’s accuracy and producer’s accuracy. To minimize the random variation between classification results, we run 100 classifications for each scenario and took the mean value as classification accuracy.
There were three types of input datasets for classification: (1) using each single date Landsat image separately; (2) using each single date Landsat image together with the image providing the highest classification accuracy; (3) using all the Landsat images from one year.
Some images were affected by fire with clear burn scars. After classification, we masked burnt pixels for each image using burn area index (BAI = 1 / ((0.1 − Band4)2 + (0.06 − Band5)2)) (Chuvieco et al., 2002) and normalized difference vegetation index (NDVI = (Band5 Band4) / (Band5 + Band4)) (Tucker,
1979). The threshold value for separating burnt areas was determined by visual analysis.
3. RES ULTS
3.1 S easonal effects on classification accuracy
According to the classification results, the season had an effect on the overall accuracy (Figure 3). To visualize the relationship between the overall accuracy and phenology, we computed the mean NDVI for the sample plots from the 14 images. From the NDVI time series, it is evident that cloud free images were not available between 23 July and 11 October when maximum NDVI likely occurred.
Figure 3. Overall accuracy and mean NDVI for each image.
The lowest overall accuracy among the 14 images (65.1%) was provided by the image from 11 October corresponding to the wet season and the maximum NDVI period. The best classification accuracy was provided by the image from 14 December (85.5%). This date corresponds to the dry season and is close to the minimum NDVI. The overall accuracy for the December image was around 20% higher than that of the October image.
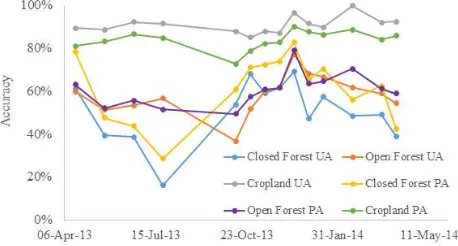
Figure 4. User’s accuracy and producer’s accuracy for different land cover types.
and for closed forest and open forest by the 14 December image. The image providing the lowest user’s accuracy for cropland was 27 October image, for closed forest 23 July image, and for open forest 11 October image. The image providing the highest producer’s accuracy for cropland, closed forest and open forest was 14 December image. The image providing the lowest producer’s accuracy for cropland and open forest was 11 October image and for closed forest 23 July image.
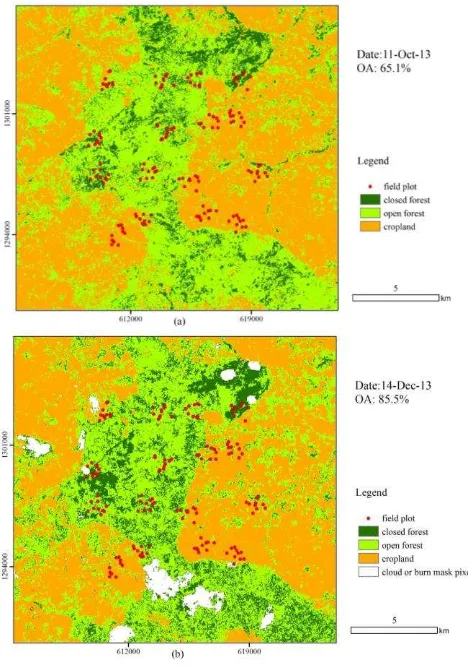
Land cover classification map s based on 11 October image and 14 December image are shown in Figure 5. The most obvious difference between the maps is in the distribution of the closed forest class.
Figure 5. Land cover classifications based on (a) 11-Oct-13 image and (b) 14-Dec-13 image.
3.2 Multi-temporal classification accuracy
The highest overall accuracy among the 14 images was provided by the image from 14 December. In order to test the effect of temporal information on overall accuracy, we combined the 14 December image with other 13 images (Table 2). Among the 13 combinations, the highest overall accuracy was yielded when combining 14 December image with 11 October image (OA = 87.0%). However, in general the overall accuracies were increased only marginally and in most cases the overall accuracy was not increased in comparison to 14 December image.
We extracted the mean spectral profiles for the three land cover types from 11 October and 14 December images (Figure 6). The profiles indicated that reflectance of open forest and closed forest in band 4 (near infrared) was similar in October image. By contrast, the difference was greater in December image. When combining the two images, the spectral bands capture the most important seasonal variation of the different land cover types. Other multi-temporal classification combinations did not improve the overall accuracy, which showed that multi-temporal classification does not necessarily increase the overall accuracy. Although the multi-temporal classification improved the overall accuracy, the improvement was small because seasonal changes are similar in the different land cover classes.
Date Single image OA 14-Dec-13 + other image OA
18-Apr-13 75.0% 85.3%
20-M ay-13 68.0% 82.6%
21-Jun-13 70.4% 85.4%
23-Jul-13 67.4% 85.9%
11-Oct-13 65.1% 87.0%
27-Oct-13 71.1% 85.0%
12-Nov-13 73.8% 83.7%
28-Nov-13 74.4% 84.7%
14-Dec-13 85.5%
30-Dec-13 76.3% 85.3%
15-Jan-14 76.7% 86.2%
16-Feb-14 78.6% 84.6%
20-M ar-14 73.9% 85.0%
05-Apr-14 70.9% 84.0%
Table 2. Overall accuracy (OA) of the multi-temporal classifications.
3.3 Classification accuracy with all the images
4. DIS CUS S ION AND CONCLUS ION
We explored the seasonal variation in land cover classification accuracy in seasonal tropics in southern Burkina Faso. The result demonstrated that during the dry season the classification result tends to be higher than during the wet season. The multi-temporal classification based on images from October and December had higher accuracy than single image classifications and other multi-temporal combinations. The results are similar to Senf et al. (2015) who found that multi-temporal classification of the maximum and minimum NDVI images increased the overall accuracy in the M editerranean area. This indicates that careful image selection is needed before using multi-temporal classification. When using all the 14 images together for classification, there were 6 × 14 input bands, and the high dimensionality and correlation between the spectral bands decreased overall accuracy.
ACKNOWLEDGEMENTS
This work was supported by the M inistry for Foreign Affairs of Finland under Building Biocarbon and Rural Development in West Africa (BIODEV) project and by the China Scholarship Council.
REFERENCES
Breiman, L., 2001. Random forests. Machine lear ning, 45(1), pp. 5-32.
Chuvieco, E., M artin, M . P., & Palacios, A., 2002. Assessment of different spectral indices in the red-near-infrared spectral domain for burned land discrimination. Inter national Jour nal of Remote Sensing, 23(23), pp. 5103-5110.
Clark, B.J.F., Pellikka, P.K.E., 2009. Landscape analysis using multiscale segmentation and object orientated classification. In: Röder, A., Hill, J. (Eds.), Recent Advances in Remote Sensing classification in ecology. Ecology, 88(11), pp. 2783-2792.
Ghimire, B., Rogan, J., & M iller, J., 2010. Contextual land-cover classification: incorporating spatial dependence in land-cover
classification models using random forests and the Getis statistic. Remote Sensing Letter s, 1(1), pp. 45-54.
Guerschman, J. P., Paruelo, J. M ., Bella, C. D., Giallorenzi, M . C., & Pacin, F., 2003. Land cover classification in the Argentine Pampas using multi-temporal Landsat TM data. Inter national Jour nal of Remote Sensing, 24(17), pp. 3381-3402.
Hijmans, R. J., Cameron, S. E., Parra, J. L., Jones, P. G., & Jarvis, A., 2005. Very high resolution interpolated climate surfaces for global land areas. Inter national jour nal of climatology, 25(15), pp.1965-1978.
Horning, N., 2010. Random Forests: An algorithm for image classification and generation of continuous fields data sets. Pr oceeding of Inter national Confer ence on Geoinfor matics for Spatial Infr astr uctur e Development in Ear th and Allied Sciences, pp. 9-11.
ITT Visual Information Solutions, 2009. Atmosphere correction module: QUAC and FLAASH user’s guide, Version 4.7, pp. 44. Kim, D.-H., Narashinman, R., Sexto, J.O.S., Huang, C., & Townshend, J.R., 2011. A methodology to select phenologically suitable landsat scenes for forest change detection. Inter national Geoscience and Remote Sensing Symposium (IGARSS), pp. 2613-2616.
Olson, D. M ., Dinerstein, E., Wikramanayake, E. D., Burgess, N. D., Powell, G. V., Underwood, E. C., ... & Kassem, K. R., 2001. Terrestrial Ecoregions of the World: A New M ap of Life on Earth: a new global map of terrestrial ecoregions provides an innovative tool for conserving biodiversity. BioScience, 51(11), pp. 933-938.
Senf, C., Leitão, P. J., Pflugmacher, D., van der Linden, S., & Hostert, P., 2015. M apping land cover in complex M editerranean landscapes using Landsat: Improved classification accuracies from integrating multi-seasonal and synthetic imagery. Remote Sensing of Envir onment, 156, pp. 527-536.
Tucker, C. J., 1979. Red and photographic infrared linear combinations for monitoring vegetation. Remote sensing of Envir onment, 8(2), pp. 127-150.
UNEP (United Nations Environmental Program) 2012. Land Health Surveillance: An evidence-based approach to land ecosystem management, illustrated with a Case Study in the West Africa Sahel. Nairobi.
Watts, J. D., Powell, S. L., Lawrence, R. L., & Hilker, T., 2011. Improved classification of conservation tillage adoption using high temporal and synthetic satellite imagery. Remote Sensing of Envir onment, 115(1), pp. 66-75.
Zhu, X., & Liu, D., 2014. Accurate mapping of forest types using dense seasonal Landsat time-series. ISPRS Jour nal of Photogr ammetr y and Remote Sensing, 96, pp. 1-11.
Zhu, Z., Woodcock, C. E., Rogan, J., & Kellndorfer, J., 2012. Assessment of spectral, polarimetric, temporal, and spatial dimensions for urban and peri-urban land cover classification using Landsat and SAR data. Remote Sensing of Envir onment, 117, pp. 72-82.
Zhu, Z., & Woodcock, C. E., 2014. Continuous change detection and classification of land cover using all available Landsat data. Remote sensing of Envir onment, 144, pp. 152-171.