*Corresponding author.
E-mail address:[email protected] (I.K. Sharma)
Biochemical Systematics and Ecology 28 (2000) 651}663
Observations of high genetic variability
in the endangered Australian terrestrial orchid
Pterostylis gibbosa
R. Br. (Orchidaceae)
I.K. Sharma
*
, M.A. Clements, D.L. Jones
Centre for Plant Biodiversity Research, Division of Plant Industry CSIRO, GPO Box 1600, Canberra, ACT, 2601, Australia
Received 2 August 1999; accepted 15 September 1999
Abstract
The genetic variation in all known populations of an endangered Australian native terrestrial orchidPterostylis gibbosaR.Br., was investigated with starch gel electrophoresis. A total of 16 isozyme loci were assayed. The percentage of polymorphic loci (P), the number of alleles per locus (A), observed and expected heterozygosity at population levels were 69%, 2.21, 0.210, 0.261, respectively. TheG
4tvalue of 15% indicates that around 85% of variation resides within
populations. Despite isolation by distance most alleles were distributed across most of the populations. High genetic variability along with low population divergence may be the result of recent population fragmentation or from extensive gene#ow maintained by seed and pollen movement. To investigate whether poor seed viability contributed towards its rarity, an orchid seed viability test using Fluorescein diacetate revealed high seed viability (range 68}90%). Although endangered and restricted to only four geographical areas, P. gibbosa showed a higher level of genetic variation than other orchids with larger populations. ( 2000 Elsevier Science Ltd. All rights reserved.
Keywords:Orchidaceae; Allozyme;P. gibbosa; Electrophoresis; Genetic diversity
1. Introduction
The taxonomic history, typi"cation, distribution and habitat of the rare and endangered Australian orchid Pterostylis gibbosa R.Br. was the subject of a recent
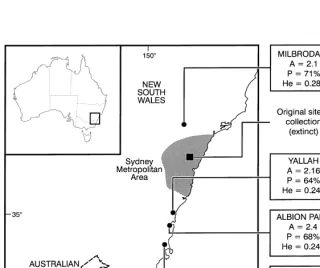
study (Jones and Clements, 1997). Currently its distribution is centred on Central Coast of New South Wales with disjunct northern populations near Milbrodale on the North Coast. Southern populations grow among shrubs in sparse open forest or woodland dominated by melaleucas, whereas northern populations grow in open forest dominated by eucalypts and native pines. The orchid plants survive hot dry summers as a dormant subterranean tuber, produce a rosette of leaves after rains in late autumn and#ower in spring. The survival of this species is threatened by urban sprawl, habitat destruction and illegal collecting. Because of its rarity, this species has been the subject of several conservation studies (Bradburn, 1984; Bradburn and Tunstall, 1993; Muston, 1991), but no research has been carried out into its genetic diversity or genetic structure. The present investigation also provides an excellent opportunity to study the e!ect of small population size and population geographic isolation on genetic variation inP. gibbosa.
Breeding structure is considered as one of the factors most strongly in#uencing the genetic variation of plant populations and survival of a species in the long term (Falk and Holsinger, 1991). Loss of variation can reduce the ability of a population to adapt to changing environments (Hamilton, 1982) and could ultimately lead to extinction. Among various ways of determining genetic diversity, isozyme electrophoresis has been used routinely in plants to investigate genetic variation within and between populations (House and Bell, 1994; Sonnante et al., 1996) and also to investigate the genetic structure of rare and endangered taxa including orchids (Cosner and Craw-ford, 1994; Godt et al., 1995; Richter et al., 1994; Sharma and Clements, 1995). It provides information on organisation of the gene pool in a large number of plant species (Gottlieb, 1981) and has implications in understanding relationships within populations of a taxon. Moreover such information is crucial for any sustainable conservation program of a rare taxon, where a fundamental goal, in addition to habitat preservation, is maintaining existing levels of genetic variation (Frankel and Soule, 1981).
The present study aims to provide baseline genetic information which could be used to develop appropriate conservation strategies by investigating allozyme diversity, gene#ow and Nei genetic identity co-e$cient within and among 12 populations of
P. gibbosa. As an adjunct to this study, viability tests of seeds collected from various localities was carried out to determine if poor seed viability was contributing to the decline of this species.
2. Material and methods
Samples (255 in all) were collected randomly from 12 populations growing in four geographical sites; Albion Park (55 samples), Yallah (66), Nowra (70) and Milbrodale (64) (Table 1, Fig. 1). At the Albion Park site, leaves were collected from an area of about 20]20 m; at Nowra four populations each about 100 m apart were sampled; at Yallah three populations about 200 m apart, were sampled; at Milbrodale four populations were sampled. Samples were collected in plastic bags and stored in the refrigerator for a maximum of seven days prior to processing. One leaf per plant was
Table 1
Location and number of plants examined from 12 populations ofPterostylis gibbosa
Province Populations No. of individual examined
Albion Park ALB 55
Yallah YA1 25
YAW 26
YAE 15
Nowra NO1 15
NO2 15
NO3 20
NO4 20
Milbrodale ML1 20
ML2 12
ML3 16
ML4 16
mashed in a small vial with a drop of extraction bu!er (phosphate bu!er pH 6.80, dithiothreitol 1 mg/ml) and the extract absorbed onto a 2.5]10 mm chromatography paper wick for starch gel electrophoresis.
Preparation of starch gel and running of electrophoresis was carried out using the method described by Weeden and Wendel (1989). Gels were cut into three slices and stained for di!erent enzymes. By utilising morpholine citrate (pH 6.1), Histidine (pH 8.0) and lithium bu!ers, eleven enzyme systems namely glucophospho isomerase (GPI, E.C. 5.3.1.9) isocitrate dehydrogenase (IDH, E.C. 1.1.1.42), 6-phosphogluconate dehydrogenase (6PGD, E.C. 1.1.1.44), phosphogluco mutase (PGM, E.C. 2.7.5.1), malate dehydrogenase (MDH, E.C. 1.1.1.37), uridine diphosphogluconic pyrophos-phatase (UGP, E.C. 3.4.11.2), Shikimic acid dehydrogenase (SDH, E.C. 1.1.1.25), alcohol dehydrogenase (ADH, E.C. 1.1.1.1), glycerate dehydrogenase (GLY, E.C. 1.1.1.29), (MR, E.C. 1.6.9.92) and GOT, E.C. 2.6.1.1 were assayed following the staining procedures of Weeden and Wendel (1989).
Banding patterns on gels were interpreted and scored according to the Mendelian genetic principal using known enzyme subunit structure with the fastest migra-ting locus of an enzyme numbered &1' and the next fastest as &2'. Similarly within each locus the fastest migrating allele was designated&1'and the next fastest as&2'and so on.
To assess genetic diversity the percentage of polymorphic loci (P), the allelic richness (A), observed heterozygosity (H
0), and gene diversity (H%) were calculated.
Wright's inbreeding coe$cient (F
*4) was used to measure deviations from random
mating. To examine population genetic structure, the total genetic diversity (H
5),
mean genetic di!erentiation within populations (H
S), mean genetic di!erentiation
between populations (D
45) and proportion of genetic di!erentiation between
popula-tions (G
45) were calculated following Nei and Chesser (1983). Genetic divergence
among populations was also assessed using pairwise measures of Nei's unbiased genetic distance (Nei, 1978). All parameters were calculated using the software package BIOSYS-1 (Swo!ord and Selander, 1981). Analysis of variance (ANOVA) was carried out using SAS (1988) to investigate whether values ofA,H
0 andH% in
respective populations were signi"cantly di!erent from each other. Estimation of gene
#ow (Nm) between populations was carried out using Wright's (1951) method i.e. (1!G
45/4G45).
Seed viability was tested following the procedure of Pritchard (1985) with the following slight modi"cation:*seeds in a test tube were soaked in 0.5 ml of distilled water along with 2ll of detergent for about 20 h at room temperature. A drop of seed
suspension containing approximately 100 seeds were placed on a clean glass slide. Excess water was absorbed with a "lter paper and a drop of 0.5% #uorescene diacetate (FDA) was placed on the seed suspension before covering it with a glass cover slip. After a gentle tapping (which ruptures the seed coat) FDA solution was applied for about 10 min (depending on how quickly the FDA evaporates). Seeds were then observed under the UV#uorescent microscope. Seeds with a bright yellowish green embryo were considered viable. Seeds from 23 plants (15 from Milbrodale, 3 from Yallah, 2 from Nowra and 3 from Albion Park were assayed for seed viability.
Table 2
Allele frequencies at 16 loci in 12 populations ofP. gibbosa
Populations
Albion Yallah Nowra Milbrodale
Locus 1 2 3 4 5 6 7 8 9 10 11 12
GPI
1 0.109 0.000 0.077 0.233 0.000 0.000 0.000 0.050 0.050 0.000 0.031 0.033
2 0.573 0.833 0.731 0.700 0.600 0.533 0.500 0.475 0.725 0.625 0.750 0.467
3 0.027 0.000 0.000 0.000 0.000 0.000 0.000 0.000 0.075 0.167 0.031 0.133
4 0.291 0.167 0.192 0.067 0.367 0.433 0.425 0.475 0.150 0.208 0.188 0.367
5 0.000 0.000 0.000 0.000 0.033 0.033 0.075 0.000 0.000 0.000 0.000 0.000
PGM
1 0.463 0.240 0.192 0.667 0.321 0.600 0.447 0.800 0.300 0.250 0.406 0.531
2 0.370 0.420 0.192 0.133 0.214 0.000 0.158 0.050 0.125 0.542 0.188 0.156
3 0.130 0.340 0.558 0.200 0.464 0.400 0.395 0.150 0.525 0.208 0.406 0.313
4 0.037 0.000 0.058 0.000 0.000 0.000 0.000 0.000 0.050 0.000 0.000 0.000
GLY
1 1.000 1.000 1.000 1.000 1.000 1.000 1.000 1.000 1.000 0.917 1.000 0.938
2 0.000 0.000 0.000 0.000 0.000 0.000 0.000 0.000 0.000 0.083 0.000 0.063
UGP-1
1 1.000 1.000 0.942 1.000 0.967 0.933 0.925 1.000 1.000 0.917 1.000 1.000
2 0.000 0.000 0.058 0.000 0.000 0.000 0.000 0.000 0.000 0.083 0.000 0.000
3 0.000 0.000 0.000 0.000 0.033 0.067 0.075 0.000 0.000 0.000 0.000 0.000
UGP-2
1 0.000 0.040 0.000 0.000 0.000 0.000 0.000 0.000 0.000 0.000 0.000 0.000
2 1.000 0.960 1.000 1.000 0.933 0.933 0.900 1.000 1.000 0.958 1.000 1.000
3 0.000 0.000 0.000 0.000 0.067 0.067 0.100 0.000 0.000 0.042 0.000 0.000
UGP-3
1 0.036 0.020 0.000 0.000 0.000 0.000 0.000 0.000 0.000 0.000 0.000 0.000
2 0.964 0.980 1.000 1.000 1.000 1.000 1.000 1.000 1.000 1.000 1.000 1.000
6PGD
1 0.000 0.080 0.058 0.000 0.833 0.833 0.800 1.000 0.000 0.000 0.000 0.063
2 1.000 0.900 0.923 1.000 0.167 0.167 0.200 0.000 1.000 0.958 1.000 0.938
3 0.000 0.020 0.019 0.000 0.000 0.000 0.000 0.000 0.000 0.042 0.000 0.000
MR
1 0.000 0.000 0.077 0.000 0.067 0.033 0.050 0.000 0.000 0.000 0.000 0.000
2 0.736 0.200 0.404 0.333 0.433 0.467 0.475 0.421 0.316 0.542 0.188 0.400
3 0.145 0.220 0.288 0.000 0.200 0.133 0.150 0.132 0.053 0.042 0.094 0.033
4 0.009 0.040 0.038 0.000 0.000 0.000 0.000 0.000 0.000 0.042 0.000 0.000
5 0.109 0.540 0.192 0.667 0.300 0.367 0.325 0.447 0.632 0.375 0.719 0.567
Table 2*continued
Populations
Albion Yallah Nowra Milbrodale
Locus 1 2 3 4 5 6 7 8 9 10 11 12
ADH
1 0.000 0.000 0.000 0.000 0.000 0.033 0.025 0.050 0.105 0.000 0.000 0.000
2 1.000 1.000 1.000 1.000 1.000 0.967 0.975 0.950 0.842 1.000 0.933 1.000
3 0.000 0.000 0.000 0.000 0.000 0.000 0.000 0.000 0.053 0.000 0.067 0.000
IDH
1 0.027 0.000 0.000 0.000 0.000 0.000 0.000 0.000 0.000 0.000 0.000 0.000
2 0.973 1.000 1.000 1.000 1.000 1.000 1.000 1.000 0.900 1.000 1.000 0.938
3 0.000 0.000 0.000 0.000 0.000 0.000 0.000 0.000 0.100 0.000 0.000 0.063
SDH
1 0.155 0.080 0.038 0.000 0.107 0.000 0.079 0.125 0.425 0.625 0.500 0.313
2 0.409 0.180 0.192 0.231 0.357 0.429 0.316 0.550 0.075 0.250 0.125 0.125
3 0.418 0.740 0.750 0.769 0.536 0.571 0.605 0.325 0.500 0.125 0.375 0.563
4 0.018 0.000 0.019 0.000 0.000 0.000 0.000 0.000 0.000 0.000 0.000 0.000
MDH-1
1 0.167 0.080 0.115 0.067 0.071 0.033 0.053 0.075 0.200 0.083 0.063 0.063
2 0.796 0.760 0.769 0.800 0.857 0.833 0.842 0.425 0.800 0.917 0.938 0.938
3 0.037 0.160 0.115 0.133 0.071 0.133 0.105 0.500 0.000 0.000 0.000 0.000
MDH2
1 0.745 0.800 0.731 0.867 0.933 0.933 0.900 0.500 0.650 0.750 0.688 0.625
2 0.255 0.200 0.269 0.133 0.067 0.067 0.100 0.500 0.350 0.250 0.313 0.375
MDH-3
1 0.917 0.700 0.788 1.000 0.967 0.967 0.950 0.775 0.725 0.792 0.688 0.781
2 0.056 0.280 0.115 0.000 0.033 0.033 0.050 0.225 0.150 0.125 0.000 0.094
3 0.028 0.020 0.096 0.000 0.000 0.000 0.000 0.000 0.125 0.083 0.313 0.125
GOT-2
1 0.100 0.020 0.000 0.033 0.000 0.000 0.000 0.000 0.000 0.000 0.000 0.063
2 0.745 0.500 0.500 0.533 0.667 0.733 0.650 0.775 0.375 0.542 0.469 0.375
3 0.155 0.480 0.500 0.433 0.333 0.267 0.350 0.225 0.625 0.458 0.531 0.563
GOT-3
1 0.927 0.780 0.923 0.967 0.867 0.900 0.875 0.925 0.800 0.750 0.844 0.719
2 0.073 0.220 0.077 0.033 0.133 0.100 0.125 0.075 0.200 0.250 0.156 0.281
656
I.K.
Sharma
et
al.
/
Biochemical
Systematics
and
Ecology
28
(2000)
651
}
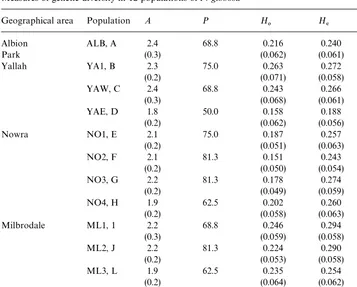
Table 3
Measures of genetic diversity in 12 populations ofP. gibbosa!
Geographical area Population A P H
0 H% F*4
Albion ALB, A 2.4 68.8 0.216 0.240 0.1
Park (0.3) (0.062) (0.061)
Yallah YA1, B 2.3 75.0 0.263 0.272 0.03
(0.2) (0.071) (0.058)
YAW, C 2.4 68.8 0.243 0.266 0.08
(0.3) (0.068) (0.061)
YAE, D 1.8 50.0 0.158 0.188 0.15
(0.2) (0.062) (0.056)
Nowra NO1, E 2.1 75.0 0.187 0.257 0.27
(0.2) (0.051) (0.063)
NO2, F 2.1 81.3 0.151 0.243 0.37
(0.2) (0.050) (0.054)
NO3, G 2.2 81.3 0.178 0.274 0.35
(0.2) (0.049) (0.059)
NO4, H 1.9 62.5 0.202 0.260 0.22
(0.2) (0.058) (0.063)
Milbrodale ML1, 1 2.2 68.8 0.246 0.294 0.16
(0.3) (0.059) (0.058)
ML2, J 2.2 81.3 0.224 0.290 0.22
(0.2) (0.053) (0.058)
ML3, L 1.9 62.5 0.235 0.254 0.07
(0.2) (0.064) (0.062)
ML4, M 2.2 75.0 0.267 0.294 0.10
(0.2) (0.075) (0.064)
Mean 2.21 69.81 0.210 0.261 0.17
!Note: (A) mean number of alleles per locus; (P) percentage of polymorphic loci; (H
0) observed
hetero-zygosity; (H
%) expected heterozygosity; (F*4)"xation index. Standard error in parenthesis.
3. Results
Eleven enzyme systems coded by 16 loci were scored: GPI, PGM, UGP-1, UGP-2, UGP-3, GLY, 6PGD, MR, ADH, IDH, SDH, MDH-1, MDH-2, MDH-3, GOT-2, GOT-3. Additional enzymes were assayed (SOD, peptidase) but were not included in the analysis due to poor resolution. All loci exhibited a simple diploid banding pattern. The number of alleles per locus ranged from two to"ve. The allele frequencies observed at 16 loci is shown in Table 2. There were a number of unique alleles present in a particular geographical area in low frequencies e.g. allele 3 of ADH and allele 3 of IDH was present in Milbrodale site, allele 5 of GPI was present in Nowra, allele 3 of SDH was present in Albion Park and Nowra areas (see Table 2). Twelve alleles can be considered as unique alleles since their frequencies were less than 0.1.
Genetic variation values in each of the populations are presented in Table 3 and there appeared to be little di!erence among populations with values of H
% which
ranged from 0.188}0.294 (mean 0.261) and values of Pwhich ranged from 50}81%
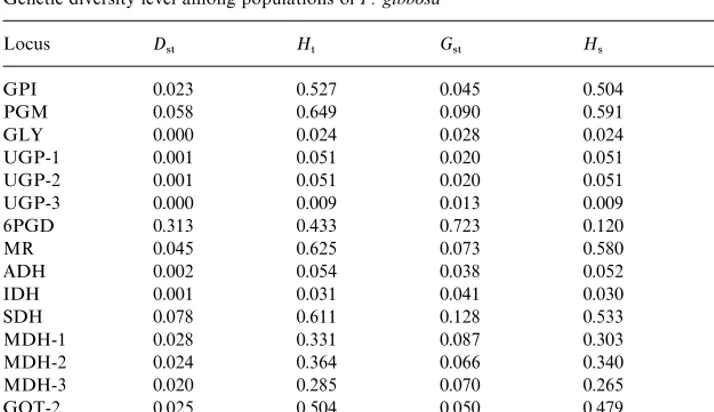
Table 4
Genetic diversity level among populations ofP. gibbosa
Locus D
45 H5 G45 H4 s2
GPI 0.023 0.527 0.045 0.504 129.46!
PGM 0.058 0.649 0.090 0.591 130.46!
GLY 0.000 0.024 0.028 0.024 33.35!
UGP-1 0.001 0.051 0.020 0.051 57.45!
UGP-2 0.001 0.051 0.020 0.051 50.10!
UGP-3 0.000 0.009 0.013 0.009 11.99NS
6PGD 0.313 0.433 0.723 0.120 398.82!
MR 0.045 0.625 0.073 0.580 148.09!
ADH 0.002 0.054 0.038 0.052 55.80!
IDH 0.001 0.031 0.041 0.030 49.99!
SDH 0.078 0.611 0.128 0.533 149.23!
MDH-1 0.028 0.331 0.087 0.303 103.32!
MDH-2 0.024 0.364 0.066 0.340 37.58!
MDH-3 0.020 0.285 0.070 0.265 96.90!
GOT-2 0.025 0.504 0.050 0.479 78.61!
GOT-3 0.004 0.246 0.019 0.242 23.10"
Average 0.045 0.299 0.151 0.254
Note:D
45mean genetic diversity found between populations;H5Total genetic variation;G45proportion of
genetic di!erentiation between populations;H
4mean genetic diversity within populations; !P(0.001.
"P(0.05.
(mean 69.81%). The mean number of alleles per locus (A) ranged from 1.8}2.4 (mean 2.21) and observed heterozygosity (H
0) ranged from 0.158}0.267 (mean 0.210).
Sim-ilarly, at all four geographical areas, the mean values ofA(range 2.07}2.40),H
%(range
0.240}0.283) and P(range 64}74%) when tested utilising ANOVA were not signi" -cantly di!erent (Fig. 1).
Genetic diversity within and among populations is shown in Table 4. Total genetic diversity (H
5) was 0.299 with most of this variation partitioned within sub-populations
(H
4"0.254). The proportion between populations (G45) are ranged from 0 to 1 and
obtained by ratios between variation found among populations (D
45) and the total
genetic variation (H
5). G45 value in the present study ranged from 0.01 (UGP-3,
GOT-3) to 0.1 (SDH), with a mean value of G
45"0.15 indicating about 85% of
variation resides within populations. The higherG
45 value indicate greater variability
between populations. Genetic diversity calculated from four geographical areas separ-ately were found to be comparable (Fig. 1). Average Gene#ow (N
.) of 6.51 suggests
that there is a moderate gene exchange amongP. gibbosapopulation and this would appear to be su$cient to prevent population di!erentiation.
The genetic identity coe$cient based on allele frequencies summarised over all loci is calculated following the method of Nei (1978) and is presented in Table 5. The highest genetic identity displayed was between populations NO1, NO2 and NO3 and
Table 5
Nei's genetic identity (I) for 12 populations ofP.gibbosa
Population 1 2 3 4 5 6 7 8 9 10 11 12
1 ALB, ***** 0.955 0.968 0.964 0.929 0.925 0.932 0.878 0.944 0.973 0.946 0.962
2 YA1, ***** 0.990 0.979 0.937 0.921 0.935 0.865 0.982 0.964 0.978 0.978
3 YAW, ***** 0.974 0.943 0.928 0.942 0.863 0.979 0.957 0.968 0.974
4 YAE, ***** 0.927 0.931 0.934 0.871 0.971 0.947 0.971 0.979
5 NO1, ***** 1.000 1.000 0.950 0.911 0.917 0.913 0.928
6 NO2, ***** 1.000 0.966 0.897 0.895 0.900 0.923
7 NO3, ***** 0.957 0.912 0.914 0.912 0.935
8 NO4, ***** 0.844 0.847 0.850 0.875
9 ML1, ***** 0.977 1.000 0.995
10 ML2, ***** 0.983 0.981
11 ML3, ***** 0.994
12 ML4, *****
I.K.
Sharma
et
al.
/
Biochemical
Systematics
and
Ecology
28
(2000)
651
}
663
the lowest was between NO4 and ML1. The mean genetic identity value in all four geographical areas were very similar ranging from 0.96}0.97.
To assess the hypothesis that poor seed viability might be contributing to this species rarity, a seed viability test showed that the seed viability ranged from 68}90% indicating substantial seed viability.
4. Discussion
A moderately high level of genetic variability was observed in P. gibbosa in comparison to various studies carried out on various plant species in the last decade or so (Karron, 1987; Hamrick and Godt, 1989; Hamrick et al., 1991; Soltis and Soltis, 1991). All these investigations emphasised the proposition that narrowly distributed taxa have less genetic variation than widely distributed taxa, thus making them prone to genetic drift leading to possible local extinction. Furthermore, Waller et al. (1987) reported no polymorphism in the extreme endemic,Pedicularis furbishiae. In their recent review Hamrick and Godt (1989) reported that the average genetic diversity statistics for long lived herbaceous perennials with animal pollinated outcrossing species with regional distribution were: percent polymorphic loci (P"49%), mean
number of alleles per locus (A"1.89), and genetic diversityH
%"0.131. By
compari-son, inP. gibbosavalues ofP"69.81%,A"2.21,H
0"0.210 andH%"0.261 were
all higher than those reported by Hamrick and Godt (1989) and by Gottlieb (1981) for comparable herbaceous plants. Results also indicated a high level of genetic variabil-ity compared with those reported for terrestrial orchids, e.g. Diuris sulphureafrom Australia (P"55%, A"1.71, H
0"0.169, H%"0.180 (Sharma and Jones, 1996); Gymnaedenia canopsea (P"56%, A"1.74, H
0"0.169, H%"0.171) (Scacchi and
DeAngelis, 1989), Epipactis species (P"38%, A"1.63. H
0"0.141, H%"0.14)
(Scacchi et al., 1987) andOrchisspecies (P"43%,A"1.63,H
0"0.141,H%"0.149)
(Scacchi et al., 1990) from Europe. Although the populations ofP. gibbosafrom four geographical regions were well separated (Albion Park, Yallah, Nowra and Mil-brodale), they still maintained high levels of genetic variation and furthermore, no signi"cant pattern of allozyme di!erentiation in terms of the value of A,P, and
H
%The presence of high levels of genetic variation and relatedness is pointed to(Table 3) was observed at these sites.
a common, well distributed ancestry prior to its present decline due to mainly habitat destruction for agriculture, urbanisation, bush"res, deliberately lit "res and over collecting.Pterostylis gibbosahas the potential to extend its geographical range to adjacent similar habitats as (a) seeds are wind blown (b) very high genetic variability and (c) seed viability is also high. However, despite these obvious attributesP. gibbosa
is currently con"ned to only four relictual sites. This can be attributed to the suitable ecological and microenvironmental factors being maintained in those areas. Further-more the outcrossing nature of this species through specialised pollination system (Dressler, 1981), high fecundity, wind dispersal of seeds and high level of gene#ow could also be responsible for the presence of high genetic variation inP. gibbosa. However, the presence of high genetic variation in endemic endangered taxa is not
unusual, and results supporting this have been recently reported for three species of
Coreopsisand endemicDelphiniumviridescens(Cosner and Crawford, 1994; Richter et al., 1994). Investigation by Ranker (1994) revealed high genetic variation in geographically restricted species, reinforcing the need to consider factors other than geographical distribution as an indicator of genetic variability (Soltis and Soltis, 1991). A high mean seed viability of 76% was found inP. gibbosaalso emphasising the fact that rarity in this species cannot be attributed to poor seed viability.
Gene #ow within populations via pollen and seed dispersal are the two major contributors for genetic di!erentiation (Loveless and Hamrick, 1984). InP. gibbosa, the two means of gene movement are (a) pollen transfer through specialised pol-linators and (b) dispersal of wind blown seeds over larger areas. Another possible contributing factor for long distance dispersal of seeds could be strong summer winds which occur sometime in Oct}Nov at the time of seed capsule dehiscence. This adds another dimension to seed dispersal over larger areas and prevents major population di!erentiation development. An alternative hypotheses that all these populations derived from a common ancestral stock and later spread to di!erent areas but still maintaining the similar genetic structure due to similar evolutionary forces, ecological characteristics prevailing in these sites cannot be ruled out. The estimated gene#ow (N
.) value of (6.51 migrants per population) were quite high in comparison to that
reported by Hamrick (1987) (N
."1.15) for 16 outcrossing animal pollinated species.
This is responsible for high degree of genetic exchange which in turn reduces popula-tion di!erences and maintains a reasonable level of genetic similarity. While other factors including genetic drift, founder e!ects, isolation from parent population and selection pressure (Clegg and Brown, 1983) can contribute to genetic di!erentiation, todate no evidence to support such factors has been observed inP. gibbosa.
The di!erentiation between populations is 15% (G
45"0.15) which is higher than
the values observed in other outbreeders (G
45"0.11) (Loveless and Hamrick, 1984),
lower than the means for outcrossing animal pollinated species (G
45"0.19) and is
comparable to species with wind dispersal seeds (G
45"0.14) (Hamrick and Godt,
1989). Furthermore, this value is similar also to values obtained with other outcross-ing orchid species, e.g. Orchis palustris Jacq. (G
45"0.17) (Scacchi et al., 1990), Cyperipedium calceolus L. (G
45"0.19) (Case, 1993), Pterostylis hamiltonii Nicholls
(G
45"0.14),P. rogersiiE.Coleman andP. aw. alata(0.13) (unpublished data), all of
which are wind dispersed from seed. This suggests that the long distance wind dispersal is a e!ective means of maintaining gene#ow and therefore genetic diversity, between populations of plants (rare or common species alike). This appears to be true even when the habitat requirements are restrictive and those regions are in widely distributed sites.
Overall, results of this study suggest that because of the presence of high genetic variability in small fragmented populations, high seed viability and the ability of seeds to be wind borne,P. gibbosahas not been at risk under the present circumstances. However action should be taken to ensure its long-term genetic viability by introduc-ing and implementintroduc-ing appropriate conservation and management strategies. Of particular signi"cance is the in situ conservation of the most diverse populations namely YA1, YAW, NO4, ML1, ML2, ML3, ML4. Since the species appears to be
exinct from the original point of collection (Fig. 1), the protection of these remaining sites is therefore paramount for the long-term survival of this species in the wild. To create a complete framework for devising a conservation strategy exsitu conservation should also be employed. This would include preservation of habitat and re-introduc-tion of seedlings to colonise similar habitats. It is preferable to employ seed propaga-tion from several individual as this avoids damage to the original plant and allows you to produce large number of genetically di!erent seedlings within a relatively short period of time. Furthermore, to ensure the long-term viability of these populations, protection from invasive weeds, animals (feral goats, rabbits), and illegal collectors is as crucial as the strategies for genetically depauperate population facing extinction.
Acknowledgements
We wish to thank Marion Garratt, Maggie Nightingale, Karina FitzGerald and Liz Gregory for technical support and Geo!rey Robertson of NPWS (NSW) for his keen interest and enthusiastic collection of samples.
References
Bradburn, G., 1984. Report on the proposed Tallawarra power project and its impact onPterostylis gibbosa. Report to the Electricity Commission of NSW by the Australian Native Orchid Society.
Bradburn, G., Tunstall, R., 1993. Census ofPterostylis gibbosaIllawarra Greenhood Orchid, Paci"c Power: Yallah site. Report prepared for Paci"c Power.
Case, M.A., 1993. High levels of allozyme variation withinCyperipedium calceolus(Orchidaceae) and low levels of divergence among its varieties. Syst. Bot. 18, 663}677.
Clegg, M.T., Brown, A.H.D., 1983. The founding of plant populations. In: Schonewald-Cox, C.M., Chambers, S.M., Macbryde, B., Thomas, L. (Eds.), Genetics and Conservation. Benjamin-Cummings, Memlo Park, CA, pp. 216}228.
Cosner, M.E., Crawford, D.L., 1994. Comparison of isozymic diversity in three rare species ofCoreopsis (Asterceae). Syst. Bot. 19, 350}358.
Dressler, R.L., 1981. The Orchids, natural history and classi"cation. Harvard University Press, Cambridge, MA.
Falk, D.A., Holsinger, K.E., 1991. Genetics and Conservation of Rare Plants. Oxford University Press. Oxford, p. 283.
Frankel, O.H., Soule, M.E., 1981. Conservation and Evolution. Cambridge University Press, Cambridge. Godt, M.L., Hamrick, J.L., Bratton, S., 1995. Genetic diversity in a threatened wetland species,Helonias
bullata(Liliaceae). Cons. Biol. 9, 277}280.
Gottlieb, L.D., 1981. Electrophoretic evidence and plant populations. Prog. in Phytochem. 7, 1}46. Hamilton, W.D., 1982. Pathogen as causes of genetic diversity in their host populations. In: Anderson,
R.M., May, R.M. (Eds.), Population Biology of Infectious Diseases. Springer-Verlag, New York, pp. 269}296.
Hamrick, J.L., 1987. Gene#ow and distribution of genetic variation in plant populations. In: Di!erentiation Pattern in Higher Plants. Academic Press, New York.
Hamrick, J.L., Godt, M.L., 1989. Allozyme diversity in plant species. In: Brown, A.H.H., Kehler, A.I., Weir, B.S. (Eds.), Plant Population Genetics, Breeding and Genetic Resources. Sinauer Associates, Sunder-land, MA, pp. 43}63.
Hamrick, J.L., Godt, M.J., Murawski, D.A., Loveless, M.D., 1991. Correlation between species traits and allozyme diversity: implications for conservation biology. In: Falk, D.A., Holsinger, K.E. (Eds.), Genetics and Conservation of Rare Plants, Oxford University Press, New York, pp. 75}86. House, A.P.N., Bell, J.C., 1994. Isozyme variation and mating system. In:Eucalyptus urophyllaBlake, S.T.
(Ed.), Silvae Genetica Vol. 43, pp. 167}176.
Jones, D.L., Clements, M.A., 1997. Characterisation of Pterostylis gibbosa R. Br. (Orchidaceae) and description ofP. saxicola, a rare new species from New South Wales. The Orchadian 12, 128}135. Karron, J.D., 1987. The pollination ecology of co-occurring geographically restricted and widespread
species ofAstragalus(Fabaceae). Amer. J. Bot. 76, 331}340.
Loveless, M.D., Hamrick, J.L., 1984. Ecological determinants of genetic structure in plant populations. Ann. Rev. Ecol. 15, 65}95.
Muston, R., 1991. Plan of management for the rare and endangered Illawarra Greenghood Orchid (Pterostylis gibbosa) on property owned by Electricity Commission of NSW at Yallah. Report prepared by Roslyn Muston and Associates, Fairy Meadow.
Nei, M., 1978. Estimation of average heterozygosity and genetic distance from a small number of individuals. Genetics 89, 583}590.
Nei, M., Chesser, R.K., 1983. Estimation of"xation indices and gene diversities. Ann. Hum. Gen. 47, 253}259.
Pritchard, H.W., 1985. Determination of Orchid seed viability using #uorescein diacetate. Plant Cell Environ. 8, 727}730.
Ranker, T.A., 1994. Evolution of high genetic variability in the rare Hawaiian fernAdenophorus periensand implications for conservation management. Biol. Conser. 70, 19}24.
Richter, T.S., Soltis, P.S., Soltis, D.E., 1994. Genetic variation within and among populations of narrow endemicDelphiniumviridescens(Ranunculaceae) Amer. J. Bot. 81, 1070}1076.
SAS Institute Inc.1988. SAS/STAT user's guide, Release 6.03 edition, Cary, NC: SAS Institute Inc. 1028pp. Scacchi, R., De Angelis, G., 1989. Isozyme polymorphism inGymnadeniaand its inferences for systematics
within this species. Biochem. Syst. Ecol. 17, 25}33.
Scacchi, R., Lanzara, P., De Angelis, G., 1987. Study of electrophoretic variability inEpipactis helleborine (L.) Crantz,E. palustris(L.) Crantz andE. microphylla(Ehrh.) Swartz (fam. Orchidaceae). Genetica 72, 217}224.
Scacchi, R., De Angelis, G., Lanzara, P., 1990. Allozyme variation among and within elevenOrchisspecies (fam. Orchidaceae) with special reference to hybridising aptitude. Genetica 81, 143}150.
Sharma, I.K., Clements, M.A., 1995. Evidence of low genetic diversity inDendrobium malbrowniiDockrill (Orchidaceae). The Orchadian 11, 459}464.
Sharma, I.K., Jones, D.L., 1996. An electrophoretic study of variability in Diuris sulphurea R. Br. (Orchidaceae) in the Canberra region. J. Orchid Soc. India. 10, 9}24.
Soltis, P.S., Soltis, D.E., 1991. Genetic variation in endemic and wide spread plant species: examples from Saxifragaceae andPolystichum(Dryopteridaceae). Aliso 13, 131}134.
Sonnante, G., Piergiovanni, A.R., Ng, Q.N., Perrino, P., 1996. Relationships ofVigna unguiculata(L.) Walp., V.vexillata(L.) A. Rich. and species of sectionVignabased on isozyme variation. Genet. Resour. Crop Evol. 43, 157}165.
Swo!ord, D.L., Selander, R.B., 1981. BIOSYS-1, A fortran program for the comprehensive analysis of electrophoretic data in the population genetics and systematics. J. Heredity 72, 281}283.
Waller, D.M., O'Malley, D.M., Gawler, S.C., 1987. Genetic variation in the extreme endemicPedicularis furbishiae(Scrophulariaceae). Cons. Biol. 1, 335}340.
Weeden, N.F., Wendel, J.F., 1989. Visualisation and interpretations of plant isozymes. In: Soltis, D.S., Soltis, P.S. (Eds.), Isozymes in Plant Biology. Dioscorides Press, Portland, Oregon, pp. 46}72.
Wright, S., 1951. The genetic structure of populations. Ann. Eugen. 15, 323}354.