Time-of-Day Variations of Indicators of Attention:
Performance, Physiologic Parameters, and
Self-Assessment of Sleepiness
Susanne Kraemer, Heidi Danker-Hopfe, Hans Dorn, Andrea Schmidt, Ingrid Ehlert,
and Werner M. Herrmann
Background:A study was performed to analyze time-of-day variations of different indicators of attention and their interrelations.
Methods: After a sufficiently long all-night sleep 12 healthy non–sleep-deprived subjects ran through a test battery (Stanford Sleepiness Scale, Visual Analogue Scale, Critical Flicker Fusion Test [CFF], Visualization Test, Number Facility Test, Reaction Time, Pupillometry, and modified Multiple Sleep Latency Test) every 2 hours from 7:00AMuntil 11:00PM. Time-of-day variations were tested
nonparametrically with Friedman’s test for repeated mea-surements. Principal component factor analysis (of indi-vidually standardized values) was used to identify variable complexes with the same pattern of time-of-day variation.
Results: Statistically significant time-of-day variations were found for all variables, except for Fusion Frequency in CFF and Reaction Time. In factor analysis the physio-logic parameters (pupillometric variables and sleep laten-cies) load on one factor, whereas the self-assessment scales, the Visualization Test, Number Facilty Test, and CFF load on the second factor. The variables that load primarily on factor 1 show peak levels of alertness immediately after getting up (at 7:00 AM) and again at
9:00PM. Those variables that load primarily on factor 2
indicate a peak level of alertness around noon (11:00
AM–3:00PM).
Conclusions:Different aspects of attention follow different time-of-day variations. It is discussed, that these findings can be attributed to underlying circadian and homeostatic fac-tors. Biol Psychiatry 2000;48:1069 –1080 ©2000 Society of Biological Psychiatry
Key Words:Time-of-day variation, attention, sleepiness, pupillometry, performance, circadian rhythms
Introduction
P
atients suffering from sleep disturbances often com-plain about an impairment of well-being and perfor-mance during daytime. Although some sleep disorders result in an increased daytime sleepiness (e.g., narcolepsy, obstructive sleep apnea syndrome), which causes poor daytime functioning, in others (e.g., psychophysiologic insomnia) affected persons may complain about a reduc-tion of performance during daytime, irrespective of feeling sleepy or not. Whereas there is a consensus that hyper-somnia is a disabling condition, the significance and amount of the reduction of efficiency caused by insomnia is still a matter of debate (Sateia et al 2000). For the evaluation of the degree of hypersomnia the Multiple Sleep Latency Test (MSLT) is a generally accepted diagnostic tool. For the impairment of daytime function-ing, which according to the International Classification of Sleep Disorders (American Sleep Disorders Association 1997) is an essential characteristic of insomniacs, no adequate diagnostic tool is suggested. This might be explained by the fact that daytime functioning is a com-plex condition that can only be assessed by a multidimen-sional concept. Because of the complexity of the problem, there is no generally agreed-upon definition. In addition, daytime functioning, which is based on attention-related processes, varies during the course of the day. So, like sleepiness in the MSLT, attention has to be assessed at various times of the day using the same tasks and state markers. This is necessary to be able to determine whether different dimensions of attention follow different patterns of time-of-day variations.Young and middle-aged adult human beings of the northern hemisphere usually follow a monophasic circa-dian rhythm of sleep and wakefulness. During the waking period there are variations in the degree of attention as measured by 1) different self-assessment scales; 2) phys-iologic parameters (e.g., electroencephalogram [EEG], sleep latencies, pupillometric parameters); and 3) perfor-mance in tests from which results are thought to reflect From the Interdisciplinary Sleep Clinic, Laboratory of Clinical Psychophysiology,
Department of Psychiatry, Benjamin Franklin University Hospital, Free Uni-versity of Berlin, Berlin, Germany.
Address reprint requests to Susanne Kraemer, M.D., Free University of Berlin, Interdisciplinary Sleep Clinic, Department of Psychiatry, Eschenallee 3, 14050 Berlin, Germany.
Received November 5, 1999; revised April 24, 2000; accepted April 24, 2000.
© 2000 Society of Biological Psychiatry 0006-3223/00/$20.00
attention, when exogenous influences like motivation, training, and so on are allowed for. There is generally no agreed-upon definition of indicators of sleepiness; how-ever, since sleep-related indicators reflect attention-related processes, the German Society for Sleep Research and Sleep Medicine (Weeß et al 1998) adopted the model of attention as proposed by Posner and Rafal (1987). Accord-ing to this model, attention comprises five components: vigilance and selective and shared attention, which are based upon and act on the tonic and phasic activation of the central nervous system (alertness).
Tonic activation follows a circadian rhythm and is not subject to conscious control (Weeß et al 1998). Circadian rhythms are driven by an endogenous circa-dian pacemaker interacting with the duration of wake-fulness (Monk et al 1997). Out of the physiologic parameters, body temperature rhythm has become the gold standard for human circadian rhythm, although Monk et al (1997) could show that cortisol and mela-tonin levels appeared as well as temperature as circa-dian correlates of performance. The phasic component of alertness refers to a transient elevation of the level of central nervous alertness due to a signal that requires a response. Contrary to the tonic and phasic alertness of the central nervous system, the components vigilance and selective and divided attention are subject to conscious control (Weeß et al 1998). Selective attention facilitates the selection of relevant stimuli from the sum of all stimuli to which an individual is exposed. Divided attention refers to a rapid, automatic, controlled pro-cessing of information. Vigilance, in this model, is defined as a nonspecific readiness or capacity to keep a high or higher level of attention over a prolonged period of time, in a situation where stimuli requiring a re-sponse are rare and occur by chance.
Our study was designed to investigate the time-of-day variations of different indicators of attention under stan-dardized conditions. The data presented are supposed to serve as a reference to be used in future studies in which the dimensions and the time course of differences between insomniacs and healthy individuals will be assessed. To get this data, the following problems were analyzed:
1. Do all indicators of attention used in this study (i.e., the self-assessment of the degree of sleepiness, the physiologic parameters, and the performance in different tests) show time-of-day variations in healthy subjects without sleep disorders the day following an undisturbed, polysomnographically re-corded night?
2. Do all variables that reflect different aspects of wakefulness and attention, respectively, show simi-lar patterns of time-of-day variations?
Methods and Materials
Subjects
Subjects were 12 white volunteers (seven female and five male) aged from 23 to 59 years (mean 3167 years). They had the same socioeconomic background, and had a high level of education. Furthermore, they can be assumed to have been quite homogenous with regard to motivation and attitude towards the tasks. All subjects were carefully screened by interview for absence of sleep disorders and for a normal nycthermal routine. All subjects were healthy, with no history of psychiatric disorders, and were free of any medications and of drugs (except oral contraceptives). A continuous nocturnal recording of core body temperature by a rectal device and a bihourly sampling of saliva during daytime revealed that our subjects followed a normal circadian rhythm. The nadir of nocturnal core body temperature occurred around 3:00AMand the cortisol peak was observed around 7:00AM.
General Schedule
To avoid any bias introduced by training effects, every subject was individually trained on the complete test battery the week preceding the study. Subjects entered the laboratory at 7:00PM. Electrodes and additional devices for the polysomnographic recording, including the rectal probe, were placed. After a further training session subjects went to bed between 9:30 PM and midnight. Since time of “lights on” was standardized, the timing for “lights off” was set by the individual habitual sleep duration as determined by sleep diaries filled in for 2 weeks before the study.
At 6:45AMthe subjects had to get up and were allowed to have a cup of herbal tea and biscuits. The test battery, with a duration of 45 to 50 min, was repeated in the same order every 2 hours from 7:00AMuntil 11:00PM. Self-assessment took place every hour. The time between the testing periods was used for electrode checks, standardized physical activities (walks), self-determined activities like studying and reading, and light meals. Nutrition was standardized to avoid an enhancement of sleepiness due to meals (Wells et al 1998). To avoid hunger and thirst, light snacks and caffeine-free soft drinks were available all the time; coffee and black tea (Johnson et al 1990) were not allowed, and smoking was restricted to a maximum of four cigarettes per day. Two nights and days were recorded in every subject, with an interval between the 2 days of the study ranging from 3 to 14 days. The only difference between the two sessions was that on one day a modified MSLT (mMSLT) was carried out at the end of every test battery, whereas on the other day the mMSLT was replaced by a routine of sitting in a comfortable chair listening to music with the instruction not to fall asleep (modified Multiple Maintenance of Wakefulness Test). The order of these 2 test days was randomly assigned. All tests were done on Mondays and Wednesdays from September until December 1996 by two trained persons (SK and AS). This article refers only to the data collected on the day with the mMSLT.
Polygraphic Recording and Scoring
Ger-many). The following EEG leads were recorded with Cz as common reference: Fz, Fp2, F4, C4, P4, T6, O2, A1, and A2. Gold-disk electrodes (Astro-Med, GRASS Instruments Division, West Warwick, RI) were placed according to the International 10 –20 System. The impedance was kept below 5 kV. Electro-myographic (EMG) electrodes were placed bilaterally on the mentalis muscles. Horizontal electro-oculography (EOG) was also registered. In addition to these basic polygraphic parameters the following data were recorded: electrocardiography; actogra-phy at the right upper arm; rectal temperature (YSI Thermistor-sonde Series 400, Yellow Springs Instruments, Yellow Springs, OH); light exposure; and EMG of the left anterior tibialis muscle, from which electrodes were removed after subjects got up. Gains and calibration signals were set according to the operator instruction manual of the Vitaport System (Jain and Gehde 1994). The sampling frequency was 150 Hz for EEG channels and 30 Hz for both EOG and EMG channels. High-pass filters were set to a time constant of 0.33 sec for EEG, 1 sec for EOG, and 0.015 sec for EMG. The cutoff frequency of the low-pass recording filter was 50 Hz for EEG, 10 Hz for EOG, and 1000 Hz for EMG, resulting in an intended aliasing in the latter case to preserve amplitude information for the whole EMG frequency range without consuming too much digital bandwidth. For the external sensors, additional circuitry for signal conditioning and interfacing the Vitaport System was developed.
The nights and mMSLTs were scored visually according to the rules of Rechtschaffen and Kales (1968), but instead of C3–A2 and C4 –A1 the derivations Cz–A2 and Cz–A1 were used.
Assessment of Attention
Since attention is a multidimensional process, various scales, performance tests, and physiologic parameters were assessed to cover three out of the five different aspects hypothesized by Posner and Rafal (1987). The complete test battery was repeated every 2 hours to ensure an assessment of time-of-day variations with a high time resolution. Single tests, thus, had to be comparatively short. That is why vigilance tasks have not been taken into consideration. Phasic attention occurs when a subject reacts to a sudden, rather alarming stimulus. Because such a stimulus could alter the natural course of attention, this aspect was also omitted. Other aspects of selection were that the tests are available in German and that isoforms exist to prevent learning effects.
MODIFIED MULTIPLE SLEEP LATENCY TEST. The MSLT (Thorpy 1992) was modified to minimize the influence of daytime rest on the circadian rhythms and to standardize the duration of resting time for all subjects. All subjects lay in bed for a duration of 15 min in a dark, noiseproof room after having gone through the test battery. After 15 min they had to get up, irrespective of whether they had fallen asleep or not. The polygraphic recording registered during resting was analyzed visually according to the rules of Rechtschaffen and Kales (1968). From this scoring S1 and S2 latencies (LAT-S1 and LAT-S2) were derived. Both latencies are defined as the time span from lights off until the occurrence of the first epoch that has to be scored as the sleep stage under consideration (Penzel et
al 1993). According to the general rules of evaluation the latency was set to 15 min when a sleep stage was not attained (Mayer 1997).
PUPILLOMETRY. The subjects were placed comfortably in
a continuously adjustable chair in front of the Compact Inte-grated Pupillograph (CIP Version 8.0, AMTech, Weinheim, Germany) in a dark and noiseproof room. Subjects placed their head in the chin and forehead rests of the apparatus on the table in front of them. They were asked to fix their gaze at a dim red spot 0.5 cm in diameter and located 10° above eye level at a distance of 2 m in front of them. Subjects were instructed to sit quietly, to keep eyes open with vision fixed, and to try to avoid blinking. During the recording stimulation was strictly avoided. Registration started after 2 min of adaptation to the dark and lasted for 10 min. The measuring device consisted of a charged-coupled device line scan camera connected to a frame grabber in a personal computer and an image processing software with a 16 2/3-Hz real-time analysis. The system electronically detects the pupil margins under infrared illumination and continuously tracks the maximum pupil diameter (PD), which is calculated as the difference between the pupil margins. Pupil diameter was measured horizontally and recorded 1000 times per minute or with a frequency of one recording every 60 msec.
In the present context the mean PD and its coefficient of variation (CVPD) as a measure of stability of the PD were used as pupillometric variables.
SELF-ASSESSMENT OF SLEEPINESS. The self-assessed stage of sleepiness was measured by the Stanford Sleepiness Scale (SSS; Hoddes et al 1972) as well as on a Visual Analogue Scale (VAS). The SSS provides a choice among seven stages ranging fromfeeling active and vital; alert, wide awake(1) to
almost in reverie; sleep onset soon, lost struggle to remain awake
(7). The VAS measures sleepiness on a continuous scale ranging from wide awake (0%) to nearly being asleep (100%). The subjects marked their stage of sleepiness by placing a tick on a 10-cm–long line.
Subjects were asked to fill in separate SSS and VAS scales on new forms presented to them every hour to avoid bias by previous ratings. Every SSS form provided the full description of the seven stages.
PERFORMANCE TESTS. The performance test battery com-prised four tests: the Number Facility (NF) Test, the Visualiza-tion Test (VT), Critical Flicker Fusion Test (CFF), and ReacVisualiza-tion Time (RT). The NF Test and VT are two paper-and-pencil tests out of six, constructed by Moran and Mefferd (1959), to provide repetitive psychometric tests that allow monitoring of intraindi-vidual variability in a time dimension to prevent learning effects. Since for both tests 20 parallel forms exist, repeated use of the same form by an individual could be avoided.
The NF Test has 90 items on every form and requires the addition of one- or two-digit numbers in sets of three. The score is the number of correct answers obtained within 3 min. The VT sheets consist of eight sets of 10 tangled lines each. The starting points of the lines on the left side are numbered. The subjects have to follow the path of each line visually from left to right and
Time-of-Day Variations of Attention BIOL PSYCHIATRY 1071
to place the number of the line into the appropriate cell on the right. The score is the number of cells correctly identified within 3 min.
The CFF, a measure that is frequently used in psychopharma-cology, is believed to reflect central nervous system arousal, vigilance, and information processing capacity. According to Curran et al (1990), CFF reflects the functioning of the central nervous system rather than being related to a specific anatomic structure. The precise anatomic and physiologic substrate is still unknown. Subjects are seated comfortably in front of the Flicker Frequency Analysator (Version 3.0, Dr. G. Schuhfried GmbH, Mo¨dling, Austria) in a darkened room. The forehead rests on the upper brim of the tube so that both eyes are enclosed by the tube. Subjects have to fix their gaze on a red light placed in the middle of a slightly illuminated screen. The red light was presented automatically with flicker frequencies ranging from 25.0 Hz to 65.0 Hz in alternating descending and ascending order. The frequency was altered by 1.0 Hz/sec. By pressing a button, subjects indicated when they perceived that flickering was starting (FLF) or coming to an end (FUF). A total of 12 cycles was recorded at each session, and the median frequencies of six trials each for both ascending and descending CFF were used for further calculations.
Reaction Time is the time that elapses between detection of a target signal in a series of target and nontarget signals presented at random and the pressing of a button with the forefinger of the dominant hand as motor reaction. Subjects were placed in front of a board with a red and a yellow light (distance, 7 cm), a microphone, and two buttons. The forefinger of the dominant hand rested on the first button. At the appearance of the target signal the finger had to be lifted as fast as possible to touch the target button at a distance of 6.5 cm. The target was a complex signal. The subjects had to react only when a sound occurred simultaneously with the yellow light. Eight target signals were mingled randomly with a total of 24 nontarget signals (e.g., red
or yellow light alone, sound alone, a combination of red light and sound). The reaction time device (Wiener Reaktionsgera¨t, Ver-sion 1.0-90, Dr. G. Schuhfried GmbH) was capable of storing a maximum of four different sequences of the 32 signals, so that three sequences had to be presented twice and one sequence three times. Signals were presented every 2.5 sec for the duration of 1.0 sec. Three time parameters were recorded: appearance of the target signal until lifting of the forefinger (Decision Time [DT]), time span between lifting the finger and touching the target button (Motor Reaction Time [MT]), and the sum of both (Total Reaction Time [TR]). Recording ended after eight reactions, irrespective of whether reactions were right or wrong. False reactions were marked but not used for calculation of mean reaction times. Since false reactions were very rare in our sample, the numbers of right and false reactions were not considered for further analyses.
On every measuring occasion the test battery was performed in a fixed order: SSS, VAS, CFF, NF Test, VT, RT, Pupillometry, mMSLT.
The components of attention that are reflected by the different tests, scales, and physiologic parameters are summarized in Table 1.
Statistical Methods
Analysis of the time-of-day variations of the parameters listed above is based on 17 (SSS and VAS) and nine (all other variables) points on the time scale, respectively. To study these variations, chronobiologists most often use analysis of variance, especially if the number of data on the time scale is compara-tively small (e.g., in analysis of human performance; Monk 1982).
All parameters were monitored longitudinally (i.e., subjects providing information for different measuring occasions were the same over the entire time span). This within-subject research Table 1. Variables Selected for Analysis and Related Aspect of Attention
Variable Test Abbreviation Aspect of attention
Subjective assessment of sleepiness Stanford Sleepiness Scale SSS Subjective assessment of sleepiness Visual Analogue Scale VAS S1 latency Modified Multiple Sleep Latency Test LAT-S1 S2 latency Modified Multiple Sleep Latency Test LAT-S2
Fusion Frequency Critical Flicker Fusion FUF Tonic central nervous alertness
Flicker Frequency Critical Flicker Fusion FLF
Pupil diameter Pupillometry PD
Coefficient of variation of pupil diameter
Pupillometry CVPD
Calculation performance
Visual performance
Number Facility Test (Moran and Mefferd [1959] Test Battery)
Total Reaction Time Wiener Determinationsgera¨t TR
design, among others, has the advantage over a between-subjects research design in that the sample size can be smaller and individual differences in performance levels, physiologic param-eters, and self-assessment can be controlled.
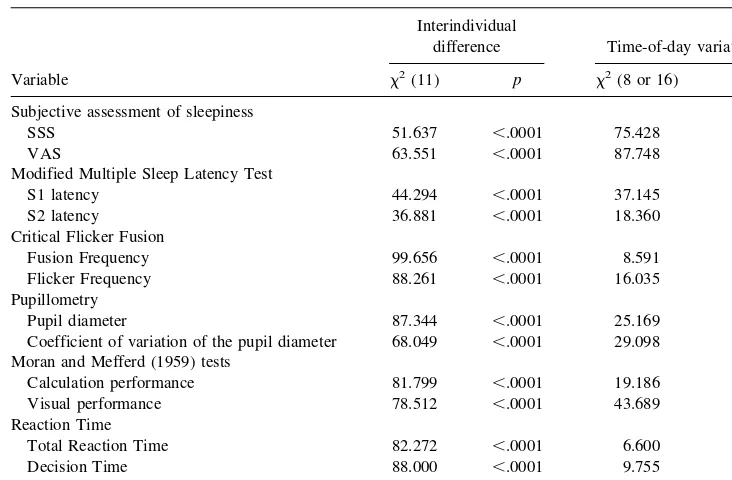
A nonparametric approach was preferred where possible to avoid conflicts with deviations from a Gaussian distribution, a feature that is crucial for many statistical tests. Univariate one-way analysis of variance (Kruskal–Wallis test and Friedman test for repeated measurements, respectively) revealed significant interindividual differences for all variables (Table 2). To allow for these interindividual differences the data were standardized. Values were expressed asZscores, using the overall mean of test-specific performance of an individual at the testing day and
its standard deviation as parameters for standardization. The effect of standardization is shown in Figure 1.
Subsequently, nonparametric one-way analyses of variance for repeated measurements were performed for all measures of attention to test the main effect of time. All tests were performed with a double sideda-error,p,.05.
Additionally, a summaryZscore was calculated as indicator of the overall level of attention. The summaryZscore, which was calculated as simple mean of the 12 trait-specificZscores (TR was omitted because it is a simple linear combination of DT and MT), takes into account that, for different variables, positive and negative signs have different meanings with regard to the state of attention. For all variables under consideration in the graphic
Figure 1. Effect of standardization on the pattern of time-of-day variation shown for performance in the Visualization Test.Left:n5
12 individual curves of time-of-day variations of the nonstandardized results.Right:n512 individual curves of time-of-day variations after standardization.
Table 2. Results of Kruskal–Wallis Test on Interindividual Differences and of Friedman Test on Time-of-Day Variations
Variable
Interindividual
difference Time-of-day variations
x2(11) p x2(8 or 16) p
Subjective assessment of sleepiness
SSS 51.637 ,.0001 75.428 ,.001
VAS 63.551 ,.0001 87.748 ,.001
Modified Multiple Sleep Latency Test
S1 latency 44.294 ,.0001 37.145 ,.001 S2 latency 36.881 ,.0001 18.360 .019 Critical Flicker Fusion
Fusion Frequency 99.656 ,.0001 8.591 .378 Flicker Frequency 88.261 ,.0001 16.035 .035 Pupillometry
Pupil diameter 87.344 ,.0001 25.169 ,.001 Coefficient of variation of the pupil diameter 68.049 ,.0001 29.098 ,.001 Moran and Mefferd (1959) tests
Calculation performance 81.799 ,.0001 19.186 .014 Visual performance 78.512 ,.0001 43.689 ,.001 Reaction Time
Total Reaction Time 82.272 ,.0001 6.600 .580 Decision Time 88.000 ,.0001 9.755 .283 Motor Reaction Time 88.520 ,.0001 7.578 .476
SSS, Stanford Sleepiness Scale; VAS, Visual Analogue Scale.
Time-of-Day Variations of Attention BIOL PSYCHIATRY 1073
display, positive Z scores indicate a level of attention that is above the average of the day; on the other hand, negative values indicate a level of attention below the average.
The degree of correspondence between different measures of attention was analyzed by means of correlation analysis and principal component factor analysis. The number of eigenvalues retained was determined by the mineigenvalue criterion minei-gen $ 1. The factor loadings were considered after varimax rotation of the initial factors.
Results
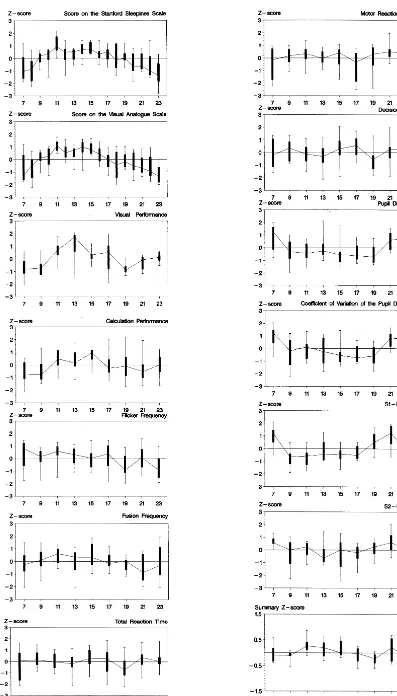
Time-of-day variations of the 13 indicators of attention under consideration and the summary Z score are dis-played in Figure 2. The figures showing the time-of-day variations of the self-assessment of sleepiness indicate that the course of variation is very similar for the ratings on SSS and VAS. Both ratings increase from 7:00AM to an absolute maximum at 11:00 AM, indicating that, at a subjective level, attention as measured on a sleepiness scale is highest late in the morning. With some fluctua-tions, attention remains comparatively high until the early afternoon (3:00PM) and steadily declines thereafter. Over-all, the time-of-day variations are statistically significant [SSS,x2(16)575.428,p,.001; VAS,x2(16)587.748, p,.001].
The results of the VT show that the task was difficult to solve early in the morning. At 7:00 AMand 9:00 AMthe number of correctly identified line endings is lowest. From 9:00 AM onwards, performance steadily increases and reaches a peak at 1:00 PM. From 1:00 PM to 7:00 PM performance decreases, with a slight reversal of the trend noticed at 5:00 PM, where interindividual variation was very high. At 7:00 PM another local minimum occurs, followed by an improvement. In the late evening interin-dividual variation, as reflected by narrow quartile ranges and differences between extremes, was comparatively small. The time-of-day variation is statistically significant [x2(8) 543.689,p,.001].
Overall the tendency of time-of-day variations of the NF Test was similar to the performance in the VT (Figure 2), although the variations are less marked and show greater interindividual variability in the evening (7:00PM to 11:00 PM). Nevertheless, the variation is statistically significant [x2(8) 5 19.186, p 5 .014]. Subjects per-formed best around midday (11:00AM, 1:00PM, and 3:00 PM), reaching a maximum at 3:00 PM. The number of correct results in this test is lowest early in the morning (7:00AMand 9:00AM) and reaches another local minimum at 9:00PM. Again, performance is better at 11:00PMthan earlier in the evening.
Time-of-day variations of the results of CFF are less marked than for the indicators of attention mentioned above. Although the variation in the Flicker Frequency
(FLF) reached statistical significance [x2(8) 5 16.035, p5.035], the one in the Fusion Frequency (FUF) did not [x2(8)58.591,
p5.378]. On average the FUF is highest at 11:00AMand lowest at 9:00PM, whereas FLF shows a maximum at 7:00AMand 11:00AMand a minimum at 7:00 PM.
None of the three RT parameters’ time-of-day varia-tions proved to be statistically significant [TR, x2(8) 5 6.600, p 5 .580; DT, x2(8) 5 9.755,
p 5 .283; MT, x2(8) 57.578,p5 .476].
On the other hand, the pupillometric variables again show a marked and statistically significant time-of-day variation (PD,x2(8)525.169,p,.001; CVPD,x2(8)5 29.098,p,.001]. The greatest PD, indicating the highest level of attention, is observed immediately after getting up in the morning (7:00 AM) and again in the evening (9:00 PM and 11:00PM). There is a sharp decrease of mean PD from 7:00AMto 9:00AM, followed by a much less marked decreasing tendency until 7:00 PM. Pupil diameter is smallest at 7:00 PM, indicating the lowest level of tonic alertness early in the evening. The same pattern of variation of vigilance is reflected by the CVPD.
The visual scoring of the EEG recorded during the mMSLT shows that in a total number of 108 mMSLTs recorded (12 subjects39 mMSLTs) stage 1 was attained 30 times (27.8%) and stage 2 was attained 50 times (46.3%). In 28 tests (25.9%) subjects stayed awake.
Time-of-day variations of LAT-S1 and LAT-S2 are also displayed in Figure 2. Both reflect statistically significant time-of-day variations [LAT-S1, x2(8) 5 37.145, p , .001; LAT-S2,x2(8) 5 18.360,p5 .019]. S1 latency is longest at 7:00 AM and 9:00 PM, reflecting the lowest physiologically measured degree of sleepiness. The mean level of sleepiness decreases sharply from 7:00AMto 9:00 AM. The median then stays almost constant until 5:00PM, whereas the quartile ranges and the extreme values re-flected a slight increase from 11:00AMto 1:00PM. From 5:00PM to 9:00PM LAT-S1 increases, reflecting the fact that the subjects become less tired. At 11:00PM LAT-S1 again is lower (i.e., subjects are more tired), with a high degree of individual variation.
This pattern of variation corresponds well with the biphasic pattern of diurnal variation of sleepiness in healthy adult individuals described with maximal sleep latencies immediately after arising in the morning and in the evening, and a minimal sleep latency at midday (Clodore et al 1990; Dement et al 1982; Richardson et al 1982). This midday decrease in sleep latency is also observed as unrelated to food intake (Carskadon and Dement 1992).
corresponding decrease in LAT-S1. There is more varia-tion in LAT-S2 from 9:00AMto 5:00PM. As for LAT-S1, there is an increase in the LAT-S2 from 7:00PMto 9:00PM followed by a decrease from 9:00PM to 11:00PM. These changes are also less marked, however.
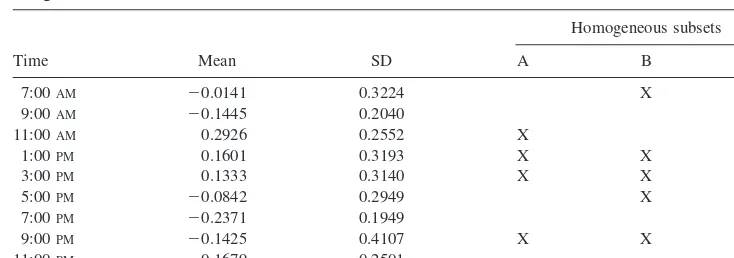
Finally, Figure 2 shows the time-of-day variation of the overall level of attention that was derived from 12 differ-ent indicators as a summaryZscore. Total Reaction Time was omitted because it is simply a linear combination of DT and MT. Since for the summaryZscore there was no reason to reject the hypothesis of a Gaussian distribution, mean and SD are listed additionally in Table 3. For the same reason, the effect of time of day was tested paramet-rically by one-way analysis of variance. The variations are statistically significant [F(8,94) 5 4.38, p , .001]. The figure shows that the overall level of attention as ex-pressed by the summaryZscore increases from 7:00AMto 11:00 AM, reaching an absolute maximum of 10.29 (mean) at 11:00AM. From 11:00AMto 7:00PMthe degree of attention measured by the summary Z score is slowly decreasing to an absolute minimum of 20.24 (mean). From 7:00PMto 9:00PMthere is again a slight increase in the overall level of attention, followed by another decrease to the level that corresponds to the one observed at 7:00 AM.
As ana posterioritest to detect homogenous subsets, a Duncan multiple range test was performed. The results are listed in Table 3. There are four homogenous subsets, indicating a comparatively stable, high level of attention from 11:00 AMto 3:00PMand a comparatively low level early in the morning (7:00AM) and in the evening, except for the 9:00 PMtesting.
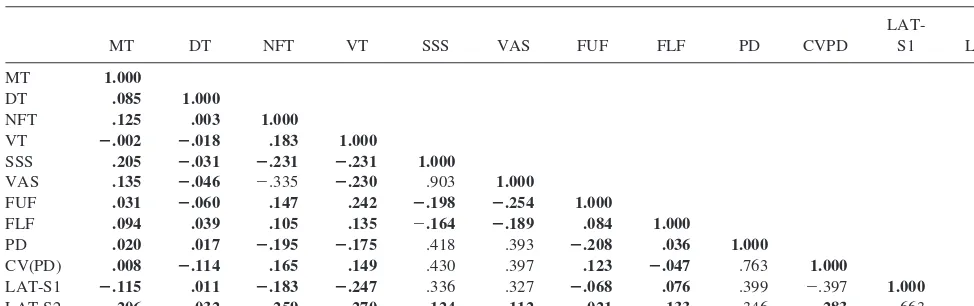
The degree of correspondence between different mea-sures of attention was analyzed by means of correlation statistics and factor analysis. The correlation coefficients are summarized in Table 4. Those correlation coefficients that are statistically significant at the two-sided a 5 5% level after Bonferroni adjustment for multiple testing are indicated in bold. Overall, only 13 out of the 66 correlation
coefficients meet the criterion of statistical significance. The table demonstrates that the RTs, the results of the VT, and the results of the CFF are not at all correlated with other variables under consideration. The highest correla-tion is observed for the two ratings on the self-assessment scales (r5.903,p,.0001), followed by the correlation between the two pupillometric variables (r5 2.763,p, .0001) and between the two sleep latencies (r5.663,p, .0001). The correlation matrix indicates that significant correlation also exists between the sleep latencies (espe-cially LAT-S1), the pupillometric variables, and the self-assessment ratings.
In a principal component factor analysis with the criterion mineigen $1, four factors were retained in the analysis. These four factors altogether explain 62.6% of the variance. After orthogonal varimax rotation the first factor is dominated by the sleep latencies, and the second by the self-assessment ratings and MT. The pupillometric variables load slightly better on the first factor than on the second. The third factor is dominated by the results of the two Moran and Meffered (1959) tests variables and the CFF frequencies, whereas the fourth factor represents the isolated effect of DT. Since the latter does not show a significant time-of-day variation, factor analysis was re-peated, restricting the number of factors to be extracted to three. The results are shown in Figure 3. This figure exhibits for each variable in the analysis the loadings on factor 1, factor 2, and factor 3 in a three dimensional space. The three factors altogether explain 53.6% of the variance. The first factor, explaining 29.0% of the vari-ance, is dominated by the physiologic variables (i.e., by the sleep latencies reflecting sleepiness at the level of the EEG and the pupillometric variables).
The only variable that loads substantially on factor 3 and that is not represented adequately by the other two factors is MT, a variable that does not show significant time-of-day variation. All other variables (i.e., the ratings on the self-assessment scales, the results of the CFF, and Table 3. Descriptive Statistics of the SummaryZScore and Results of the Duncan Multiple
Range Test
11:00AM 0.2926 0.2552 X
1:00PM 0.1601 0.3193 X X
3:00PM 0.1333 0.3140 X X
5:00PM 20.0842 0.2949 X X
7:00PM 20.2371 0.1949 X
9:00PM 20.1425 0.4107 X X
performance in the Moran and Mefferd [1959] tests) load on factor 2.
The time-of-day variations of the summaryZscores of the variables loading on factors 1 and 2 are shown in Figure 4. The summaryZscore of the variables loading on factor 1 is highest at 7:00AM, indicating the highest level of the special aspect of attention underlying this factor. From 7:00 AM to 9:00 AM there is a steep decrease, followed by a very slight decrease to a minimum of this aspect of attention at 3:00 PM. In the afternoon after 3:00 PMattention increases again, reaching a relative maximum at 9:00PM(i.e., at this time attention is almost as high as after getting up in the morning). After 9:00PMattention as measured by the variables loading on factor 1 is again decreasing.
Discussion
The nonparametric analyses of variance of the standard-ized data reveal that, except for FUF and the RTs, all variables show a statistically significant time-of-day vari-ation (Table 2).
According to the concept of attention as described in the Introduction, reaction time parameters represent an aspect of shared alertness. This was the sole test used in our battery that provided the subject with direct feedback, thus boosting motivation and improving performance. Due to this mechanism the underlying circadian modulations were leveled off. As subjects were not sleep deprived, they obviously were able to compensate for fluctuations of the level of wakefulness. It is known that the influence of motivation decreases with the duration of the task (Weeß et al 1998). Since the duration of reaction time task was relatively short (3 min), motivation most probably did not change. In addition, the reaction time task was the most
attractive task in the battery. This again suppressed effects of circadian variations of attention.
In the CFF task subjects do not get feedback, but their action interferes with the further course in that the flicker frequency changes direction; however, this task is not as attractive as the reaction time task, so the effect of motivation is less prominent. Nevertheless, circadian vari-ations in the fusion criterion of CFF were not statistically significant. All other variables (SSS, VAS, NF Test, VT, S1-LAT, S2-LAT, PD, and CVPD), which are less influ-enced by motivation, showed clear time-of-day variations. Factor analysis was performed to investigate the differ-ent dimensions of attdiffer-ention, which are represdiffer-ented by the tasks under consideration. The results show that variables with significant time-of-day variations can be attributed to two different complexes. The variables loading on factor 1 (i.e., the pupillometric variables and the sleep latencies) reflect the level of tonic central alertness, which is determined by circadian rhythms and is not influenced by voluntary control.
There are many open questions with regard to the function of sleep. It is discussed that sleep is important for the recovery of the brain, which is indicated by a deteri-oration of performance after sleep deprivation (Jewett et al 1999). Sleep is also thought to be important for the consolidation of memory (Buzsaki 1998). This could explain why variables reflecting the level of central nervous alertness indicate a high level of attention after an undisturbed all-night sleep (Figure 4). The data are also in agreement with the Two-Process Model of sleep regula-tion (Daan et al 1984). According to this model, sleep is regulated by an independent circadian process (C) and a superimposed homeostatic process (S). Factor S (viz., the sleep propensity) increases with the duration of being awake. After an undisturbed all-night sleep, which in its Table 4. Matrix of Pearson Correlation Coefficients
MT DT NFT VT SSS VAS FUF FLF PD CVPD
LAT-S1 LAT-S2
MT 1.000
DT .085 1.000
NFT .125 .003 1.000
VT 2.002 2.018 .183 1.000
SSS .205 2.031 2.231 2.231 1.000
VAS .135 2.046 2.335 2.230 .903 1.000
FUF .031 2.060 .147 .242 2.198 2.254 1.000
FLF .094 .039 .105 .135 2.164 2.189 .084 1.000
PD .020 .017 2.195 2.175 .418 .393 2.208 .036 1.000
CV(PD) .008 2.114 .165 .149 .430 .397 .123 2.047 .763 1.000
LAT-S1 2.115 .011 2.183 2.247 .336 .327 2.068 .076 .399 2.397 1.000
LAT-S2 2.206 2.032 2.259 2.270 .124 .112 2.021 .133 .346 2.283 .663 1.000
Correlation coefficients not in boldface are those that proved to be statistically significant at the two-sideda 5.05 level after Bonferroni adjustment for multiple testing. MT, Motor Reaction Time; DT, Decision Time; NFT, Number Facility Test; VT, Visualization Test; SSS, Stanford Sleepiness Scale; VAS, Visual Analogue Scale; FUF, Critical Fusion Frequency; FLF, Critical Flicker Frequency; PD, pupil diameter; CVPD, coefficient of variation of the pupil diameter; LAT-S1, S1 latency; LAT-S2, S2 latency.
Time-of-Day Variations of Attention BIOL PSYCHIATRY 1077
duration was adapted to the subject’s need, sleep propen-sity is reduced to a minimum at awakening. In our data this is reflected by long sleep latencies in the early morning. Associated are wide PDs and a low coefficient of variation of the PD. With increasing duration of wakefulness, PD and sleep latencies decrease and instability of the PD increases. This is parallel to an increase of the homeostatic factor S of growing sleep propensity; however, the in-creasing level of attention starting at 5:00PMand reaching an evening peak at 9:00PM can not be explained by the homeostatic factor. The pattern of variation rather resem-bles a circadian process.
The pattern of time-of-day variation of variables load-ing on factor 2, especially from 11:00 AM onwards, parallels the course of process S. This leads to the assumption that the underlying regulating factors of per-formance and self-assessment as measured in our study are the same as those underlying process S. Although factor S is at a minimal level after awakening, performance is as bad as late in the evening at 7:00AMand 9:00 AM. This could be attributed to the known fact that after awakening from sleep there is or can be an impairment of cognitive and sensomotoric performance and of memory. This period, which is called hypnopompic phase (Kubicki
Figure 3. Scatter of variables in the three dimensional factor space. S1-Lat., S1 latency; S2-Lat., S2 latency; MT, Motor Reaction Time; VAS, self-assessment on the Visual Analogue Scale; SSS, self-assessment on the Stanford Sleepiness Scale; CVPD, coefficient of variation of the pupil diameter; PD, pupil diameter; FLF, Flicker Frequency; DT, Decision Time; FUF, Fusion Frequency; VT, visual performance; NF, calculation performance.
1995), is reflected by the comparatively lowZ scores of variables loading on factor 2 (SSS, VAS, NF Test, VT, FUF, and FLF).
Referring to the concept of attention, our study com-prises eight variables reflecting the tonic central nervous alertness. Four of these variables load on factor 1 (pupil-lometric variables and sleep latencies), whereas the other four (SSS, VAS, FUF and FLF; Table 1) load on factor 2. This suggests that those variables thought to be indicators of tonic central nervous alertness are not homogenous with regard to their pattern of time-of-day variations. This could be explained by the fact that all tests loading on factor 2 require complex cognitive abilities. They are not solely determined by the underlying regulatory activation system, but they are additionally modulated by compen-satory mechanisms such as motivation and ambition (VT, NF Test, FUF, and FLF), expectancy due to experience (SSS and VAS) based on the duration of the time of being awake and the amount of activity, the ability to relax, and the individual capability of initiating sleep as a trait marker (Harrison and Horne 1996). The VT and the NF Test especially seem to have a strong component of selective alertness. That high ratings of subjective sleepi-ness are not correlated with objective sleepisleepi-ness as mea-sured by the MSLT has also been shown by Manni et al (1991) and Lichstein et al (1997). Although according to Dement et al (1982) subjective sleepiness correlates with performance, Manni et al (1991) observed no consistent correlation between subjective and objective sleepiness and performance tests. The lack of correspondence be-tween changes in the sleep propensity in the MSLT and comparable changes in the ability to perform has unani-mously been shown (Bliwise et al 1991; Hoch et al 1992). In conclusion, most indicators of attention used in our study show a time-of-day variation even in healthy non– sleep-deprived subjects. The only exception was a test with direct feedback enhancing motivation; however, the pattern of time-of-day variation is not homogenous. The indicators of attention could be attributed to two underly-ing factors with almost opposite patterns of variation. These patterns can largely be explained by the effects of underlying circadian and homeostatic regulatory factors, respectively.
With respect to insomniacs it has to be concluded that in the future their daytime impairment will have to be assessed by a variety of tests and cannot be measured by a single parameter as can be done with sleep latency in hypersomnia. Many observations on daytime performance in insomniacs have been published, but often with contra-dictory results (Sateia et al 2000). This could be due to the fact that frequently testings have been performed only once a day. As phenomena like wakefulness, sleepiness, performance, etc. are not stable traits but vary during the
course of the day, multiple testing should reveal more valid information.
References
American Sleep Disorders Association (1997):The International Classification of Sleep Disorders, Revised: Diagnostic and Coding Manual.Rochester, MN: Davies.
Bliwise DL, Carskadon MA, Seidel WF, Nekich JC, Dement WC (1991): MSLT-defined sleepiness and neuropsychological test performance do not correlate in the elderly.Neurobiol Aging12:463– 468.
Buzsaki G (1998): Memory consolidation during sleep: A neu-rophysiological perspective.J Sleep Res7(suppl 1):17–23. Carskadon MA, Dement WC (1992): Multiple sleep latency tests
during the constant routine.Sleep15:396 –399.
Clodore M, Benoit O, Foret J, Bouard G (1990): The Multiple Sleep Latency Test: Individual variability and time of day effect in normal young adults.Sleep13:385–394.
Curran S, Hindmarch I, Wattis JP, Shillingford C (1990): Critical Flicker Fusion in normal elderly subjects; a cross-sectional community study.Curr Psychol Res Rev9:25–34.
Daan S, Beersma DGM, Borbe´ly AA (1984): Timing of human sleep: Recovery process gated by a circadian pacemaker.
Am J Physiol246:R161–R183.
Dement W, Seidel W, Carskadon M (1982): Daytime alertness, insomnia, and benzodiazepines.Sleep5:S28 –S45.
Harrison Y, Horne JA (1996): “High sleepability without sleep-iness.” The ability to fall rapidly asleep without other signs of sleepiness.Neurophysiol Clin26:15–20.
Hoch CC, Reynolds CF 3d, Jennings JR, Monk TH, Buysse DJ, Machen MA, et al (1992): Daytime sleepiness and perfor-mance among healthy 80 and 20 year olds.Neurobiol Aging
13:353–356.
Hoddes E, Dement WC, Zarcone V (1972): The development and use of the Stanford Sleepiness Scale (SSS). Psychophys-iology10:431– 436.
Jain A, Gehde E, (1994):Bedienungshandbuch,Vitaport System und Softwarepaket VitaGraph. Karlsruhe, Germany: Ing-enieurbu¨ro Becker.
Jewett ME, Dijk D-J, Kronauer RE, Dinges DF (1999): Dose-response relationship between sleep duration and human psychomotor vigilance and subjective alertness. Sleep 22: 171–179.
Johnson LC, Spinweber CL, Gomez SA, Matteson LT (1990): Daytime sleepiness, performance, mood, nocturnal sleep: The effect of benzodiazepine and caffeine on their relationship.
Sleep13:121–135.
Kubicki S (1995): Vigilanz und Schlaf. In: Zschocke S, editor.
Klinische Elektroenzephalographie. Berlin: Springer, 165– 202.
Lichstein KL, Means MK, Noe SL, Aguillard RN (1997): Fatigue and sleep disorders.Behav Res Ther35:733–740. Manni R, Ratti MT, Barzaghi N, Galimberti CA, Zucca C,
Perucca E, et al (1991): Daytime sleepiness in healthy university students: A multiparametric study.Ital J Neurol Sci
12:303–309.
Time-of-Day Variations of Attention BIOL PSYCHIATRY 1079
Mayer G (1997): Multipler Schlaflatenz Test (MSLT), Kap III, 3.2.1. In: Schulz H, editor. Kompendium Schlafmedizin. Landsberg, Germany: Ecomed.
Monk TH (1982): Research methods of chronobiology. In: Webb WB, editor. Biological Rhythms, Sleep and Performance.
New York: Wiley, 27–57.
Monk TH, Buysse DJ, Reynolds CF III, Berga SL, Jarrett DB, Begley AE, Kupfer DJ (1997): Circadian rhythms in human performance and mood under constant conditions.J Sleep Res
6:9 –18.
Moran LJ, Mefferd RB (1959): Repetitive psychometric mea-sures.Psychol Rep5:269 –275.
Penzel T, Hajak G, Hoffmann RM, Lund R, Podszus T, Pollma¨-cher T, et al (1993): Empfehlungen zur Durchfu¨hrung und Auswertung polygraphischer Ableitungen im diagnostischen Schlaflabor.Z EEG EMG24:65–70.
Posner MI, Rafal D (1987): Cognitive theories of attention and the rehabilitation of attentional deficits. In: Meier M, Benton A, Diller L, editors.Neuropsychological Rehabilitation. Ed-inburgh: Churchill Livingstone, 182–201.
Rechtschaffen A, Kales A (1968): A Manual of Standardized
Terminology, Techniques, and Scoring System for Sleep Stages of Human Subjects.Los Angeles: University of Cali-fornia, Brain Information Service.
Richardson GS, Carskadon MA, Orav EJ, Dement WC (1982): Circadian variation of sleep tendency in elderly and young adult subjects.Sleep5:S82–S94.
Sateia MJ, Doghramji K, Hauri PJ, Morin CM (2000): Evalua-tion of chronic insomnia.Sleep23:243–308.
Thorpy MJ (1992): The clinical use of the Multiple Sleep Latency Test. A report from the American Sleep Disorders Association.Sleep15:268 –276.
Weeß H-G, Lund R, Gresele C, Bo¨hning W, Sauter C, Steinberg R, Arbeitsgruppe Vigilanz der Deutschen Gesellschaft fu¨r Schlafforschung und Schlafmedizin (DGSM) (1998): Vigi-lance. Tendency to fall asleep. Attention, somnolence, sleep-iness. The evaluation of sleepiness related processes in hypersomnia theoretical background.Somnology2:32– 41. Wells AS, Read NW, Idzikowski C, Jones J (1998): Effects of

![Figure 4. Box-plots of time-of-day variation of summary Z scores for variables loading mainly on factor 1 (S1 and S2 latencies, pupildiameter, and coefficient of variation of pupil diameter) and factor 2 (self-assessment variables, Critical Flicker Fusion Test variables,and Moran and Mefferd [1959] tests variables).](https://thumb-ap.123doks.com/thumbv2/123dok/3143002.1383438/10.612.118.501.80.289/variation-latencies-pupildiameter-coefficient-assessment-critical-variables-variables.webp)
