HULU SUNGAI PERAK BED SEDIMENT MAPPING USING UNDERWATER
ACOUSTIC SONAR
N. Arriafdia, O. Zainona, U. Dina, A. W. Rasida, Z. Mat Amina, R. Othmana, A. S. Mardia, R. Mahmuda, N. Sulaimanb
aDepartment of Geoinformation, Faculty of Geoinformation and Real Estate, Universiti Teknologi Malaysia,
81310 Johor Bahru. Johor. b
Department of Survey and Mapping Malaysia, 50578 Kuala Lumpur. [email protected], [email protected], [email protected], [email protected], [email protected], [email protected],
[email protected], [email protected], [email protected]
KEY WORDS: Side Scan Sonar, Riverbed Sediment, Correlation, Backscatter, Signal Strength, Image Analysis
ABSTRACT:
Development in acoustic survey techniques in particular side scan sonar have revolutionized the way we are able to image, map and understand the riverbed environment. It is now cost effective to image large areas of the riverbed using these techniques and the backscatter image created from surveys provides base line data from which thematic maps of the riverbed environment including maps of morphological geology, can be derived when interpreted in conjunction with in situ sampling data. This article focuses on investigation characteristics of sediments and correlation of side scan backscatter image with signal strength. The interpretation of acoustic backscatter rely on experienced interpretation by eye of grey scale images produced from the data. A 990F Starfish Side Scan Sonar was used to collect and develop a series of sonar images along 6 km of Hulu Sungai Perak. Background sediments could be delineated accurately and the image textures could be linked to the actual river floor appearance through grab sampling. A major difference was found in the acoustic returns from the two research area studies: the upstream area shows much rougher textures. This is due to an actual differences in riverbed roughness, caused by a difference in bottom currents and sediment dynamics in the two areas. The highest backscatter correlates with coarsest and roughness sediment. Result suggest that image based backscatter classification shows considerable promise for interpretation of side scan sonar data for the production of geological maps.
1.0 INTRODUCTION
Hydrographic surveying is the branch of applied science which deals with the measurement and descriptions of the physical features of oceans, seas, coastal areas, lakes and rivers, as well as with the prediction of their change over time for the primary purpose of the safety for the navigation and in support of all other marine activities including economic development, security and defense, scientific research and environmental protection. Hewitt et al. (2004) stated that hydrographic survey is conducted to measure the depth and bottom configuration of water bodies. The data is used to update nautical charts and develop hydrographic models for multiple purpose. The survey is made to acquiring the precise location least depth, to warn mariners of dangers to navigation and as well as to determine sea floor material such as sand, mud and rock which is important for anchoring, dredging and structure construction.
Developments in marine acoustic survey techniques have revolutionized the producing of image, map and understand the seabed environment. It is now cost effective to image large areas of the seafloor using these techniques and the information from such surveys provides base line data from which thematic maps of the seabed environment including maps of surficial geology, can be derived when interpreted in conjunction with in-situ ground trothing data. Traditional methods for the interpretation of acoustic backscatter rely on experienced interpretation by eye of grey scale images produced from the data. However, according to Craig et al. in 2011, the interpretation can be subjective and new developments in semi-automated backscatter classification software offer an objective method of segmentation of acoustic backscatter data into acoustically similar regions, but are not yet well tested or accepted.
One of the most accurate systems for imaging large areas of the river floor is called side scan sonar (Kyle et al., 2003). This is a towed system that normally functions when it is moving in a straight line. Side scan transmit a specially shaped acoustic beam 90 degrees from the support craft’s path and out to each side. This beam propagates into the water and across the riverbed. The roughness of the floor of the ocean and any objects laying upon it, reflect some of the incident sound energy back in the direction of the sonar. The sonar is sensitive enough to receive these reflections, amplify them and send them to a sonar data processor and display. Images produced by quality sonar systems are highly accurate and can be used to delineate even very small (<1cm) objects. Hence, with technological developments over the past decade, backscatter imagery system has improved significantly to the point where modern systems gives as much or detail.
River can be defined as an enclosed body of water (usually freshwater) totally surrounded by land and with no direct access to the sea. Deborah (1992) stated that a river may also be isolated, with no observable direct water input and, on occasions, no direct output. In many circumstances such as evaporation or groundwater inputs, the isolated lakes may become saline. A river may occur anywhere within a river basin depending on its origin. A headwater lake has no single river input but is maintained by inflow from many small tributary streams, by direct surface rainfall and by groundwater inflow. Hewitt et. al., (2004) stressed that knowledge of broad scale distribution patterns of population, communities and habitats of the seafloor is needed for impact assessment, conservation and studies of ecological patterns and processes. Bottom or seafloor sediments consist of particles that have been transported by water, air or glaciers from the sites of their origin in a terrestrial environment and have been deposited on the floor of a river, lake or ocean. In addition, bottom sediments will contain materials from precipitated from chemical and biological processes. The management practices should incorporate a clear appreciation of the roles and necessity of biological components and of the geological and surface soil components in the surrounding watershed and of suspended and bed materials in the water bodies themselves.
Rivers are traditionally under-valued resources to human society. They provide a multitude of uses and are prime regions for human settlement and habitation. Rivers have various uses including drinking and municipal water supply, industrial and cooling water supply, power generation, navigation, commercial and recreational fisheries, body contact recreation, boating and other aesthetic recreational uses. In addition also, it has been commonly believed that large rivers have an infinite ability to absorb or dilute industrial and municipal waste. Hence, the purpose of the paper is to construct sediment map for appropriate remedial action using an image based approach for river bed sediment mapping for Hulu Sungai Perak. The classified backscatter data is validated using available surficial sediment ground truth samples and the relationship between acoustic classes and surficial sediment features are explored. Specifically, the study presented in this paper addresses the following two main objectives:
1. To investigate the characteristics of sediments in Hulu Sungai Perak
2. To correlate the side scan backscatter image with the signal strength
2. REGIONAL SETTING
The Perak River flowing along the 400 km from its Headwaters from the upstream to its confluence with the Malacca Strait, at the Benting Beras Barah, Bagan Datoh, Perak. Perak River is the 2nd longest river Peninsular Malaysia after Pahang River. The project of Perak River in 1974, present the construction of a dam called Temenggor Dam built in Hulu Perak River. The dam is located across the Perak River about 200 km to the northeast of Ipoh, Perak. This construction produces a large lake called Lake Temenggor. Temenggor Lake located in adventure form the watershed as a source of water and hydroelectricity generators. Temenggor lake covering approximately 15,200 hectares and is the largest man-made lake in Perak. Forest areas are submerged for the dam, which is the strategic idea of the Prime Minister, the late Tun Abdul Razak in 1974. Once flooded, hill ranks of appeals, which is the high ground here turned into two small islands connected by a bridge of appeals.
It is not only costly but also involves the transfer of a number of traditional Malay and Orang Asli.
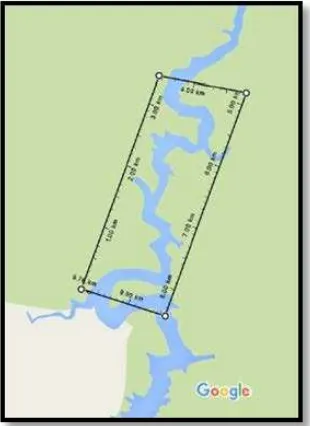
Figure 1. The location of Research Study at Hulu Sungai Perak
3. METHOD
3.1 Single Beam Data Collection
The survey area for this research was near at the Sungai Kejar Village, Royal Belom State Park, Gerik, Perak (see Figure 1). Bathymetry data were collected for this area on 23rd April 2016 to 25th April 2016 using Teledyne Odom Hydrographic Hydrotrac II SBES on board of a fiber boat for bathymetry survey. Teledyne Odom Hydrographic Hydrotrac II was used to record the water depths at the survey area. This Echo Sounder system was thoroughly checked and bench tested prior to mobilization. The portable transducer was installed rigidly to its bracket and side-mounted on the starboard side at 0.5 meter draft. The transducer shoe was kept sufficiently deep in order not to experience turbulence and aeration when the boat moved at survey speed. The depth of the transducer below water line was ascertained by reference to the marks on the pole. The DGPS antenna unit was mounted close to the Echo Sounder transducer thus eliminating the need for offset calculations.
Prior to data acquisition the draft of the transducer was verified by the “Bar Check” method. The Bar Check chain was checked to confirm that the marks were at regular 2 meters intervals. This calibration is used to account for the variation in the acoustic propagation velocity of sound through sea water and also to check the transducer mounting after the vessel was stopped at the survey area, the bar was lowered to 2 meters below the transducer. The sound velocity was then tuned and adjusted. After the transmission mark is set, the apparent depth of the transducer was noted on the analogue record. Care was taken no to subsequently move the sound velocity. The bar is then lowered at 2 meters interval to the maximum practical depth. Time was allowed for the Bar to settle at each depth. On recording the maximum obtainable depth the bar was similarly stepped back to the surface. The digitized depth was also checked during the Bar calibration.
fix. Soundings were recorded at 30s interval. The paper trace could be later compared to known positions. All soundings values were measured from the transducer to the seabed and corrected to true depth by adding the transducer draft value by the acquisition system. The velocity of sound in water was 1475 m/s for the entire survey. The survey run lines were carried out at 50 meters interval line spacing with cross lines interval of 100 meters. The boat’s speed was generally about 5 to 6 knots due to the time constraints.
3.2 Side Scan Sonar Data Collection
The Side Scan Sonar is operates by emitting a narrow beam of high frequency acoustic energy in a plane orthogonal to both the directions of ship travel and the sea surface, then recording the acoustic returns from the sea bed. Typically, the acoustic transceivers are mounted in streamlined housing (tow fish) that is towed behind the survey vessel. The survey operation is conducted using a fiber survey boat and an outboard engine speedboat as the survey platform for data acquisition. Therefore all sounding data is collected using single beam echo sounder. Starfish Seabed Imaging System are some of the most portable, shallow water side scan sonars available on the market and have been designed with portability and simplicity in mind. It is ideal for shallow water operations, including port and harbor surveys, wreck hunting and Search and Rescue (SAR) mission.
The starfish 990F uses high frequency 1 MHz acoustic ‘chirped’ pulses with a 0.3° horizontal beam width to produce the most and defined clear images from any Starfish system. With a 35 meters range capability on each channel (giving 70 meters total swath coverage), the Starfish 990F is ideal tool for high resolution surveys. The side scan sonar survey is carried out with a Starfish 990F system. The side scan sonar was towed at the Stern. The side scan sonar sweeping at 50 meters per channels. Progressing at minimal optimum speed, the side Scan Sonar was deployed overboard accordingly. An initial trial run was carried out over the proposed area as the side scan sonar operator carried out an optimum fine turning of the side scan. Abstract of sonar contacts are interpreted by an experienced geophysics.
3.3 In-Situ Sampling
The purpose of sampling is to collect a representative, undisturbed sample of the sediment to be investigated. There are many factors which need to be considered in the selection of suitable equipment. These factors include the sampling plans, the type of available sampling platform, location and access to sampling site, physical character of the sediments, the number of sites to be sampled, weather and number and experience of the personnel who was carried out the sampling. Because of these factors, the standardization of sampling technique is difficult. Generally, the aim is such that selected sampling equipment should recover undisturbed sediment samples.
The sampling device are attached to the rope sing a shackles. For safety, the rope and all shackles should have a load capacity at least three times greater than the weight of a full sampler. The grab sampler are lowered through the water column at a controlled speed. Under no circumstances, the sampler allowed to “free fall” to the bottom, as this may result in triggering, an excessive bow wake or improper orientation upon contact with the bottom. The sampler should contact the bottom gently and only its weight or piston mechanism are used to force it into the sediment. After the sediment sample is taken, the sampler are raised slowly off the bottom. Before the sampler breaks the
water surface, the survey vessel should head into the waves to minimize vessel rolling. The sampler are secured immediately after it is brought on board survey vessel. If the sampler tips or slides around before secured, extra attention should be paid to evaluating sample disturbances.
4. RESULTS AND DISCUSSION
The processed sonar images were first interpreted visually, i.e. qualitatively. Some distinct areas were selected for further investigations on the basis of their coverage and complexity. Three section contains snag structures from the downstream of Hulu Sungai Perak (Figure 2, 3 and 4) while the other sections were chosen over the snag structures and sedimentary structures of the near upstream Hulu Sungai Perak. In a general way, the different units of sonar images can be mapped on the basis of their tonal and textural properties. Tonal information is directly related to the amount of acoustic energy backscattered, i.e. the grey level while local textural properties can be intuitively qualified as rough or smooth, varied or homogeneous, repetitive or random and hence can help in distinguishing between different areas and features in the image. As applications of acoustic backscatter methods for quantitative riverbed characterization is an emerging field and there are arguably too few published studies to assess whether the results obtained here are site specific or more widely applicable.
Two representative area (upstream area and downstream area) of the backscatter image showing the features and types of sediment cover at both area. The visual quality of the backscattered image obtained are depends on the contrast of the acoustic properties of the riverbed and together with the micro and macro relief of organisms living there. Hard areas of the riverbed like rocks reflect more sound and have a stronger or louder return signal than softer areas like sand. Areas with loud echoes are darker than areas with quiet echoes. Objects or features that rise above the sea floor also cast shadows in the sonar image where no sound hit. The size of the shadow can be used to guess the size of the feature.
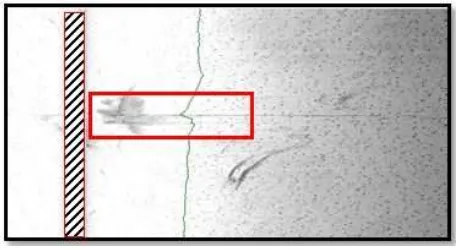
Figure 3. The shadow of the snag in backscatter image at the upstream area (roughest textures)
Figure 4. Backscatter image shows the hanging snag at upstream area (roughest textures)
Most of the earlier studies had noted a positive correlation between backscatter strength and sediment grain size in general terms, i.e. that the highest backscatter correlates with the coarsest sediments. This studies incorporated flood deposits and the high backscatter in the fine grained sediments was attributed to anomalous internal stratigraphy and degree of bioturbation. The result from this studies are in a general agreement with available previous studies in Goff et al., (2000) which also suggested a simple linear relationship between the two parameters and the results lend support to the potential of
Figure 5. The backscatter image showing variation grey scale of different features such as grass and rock at downstream area
(smoothest textures)
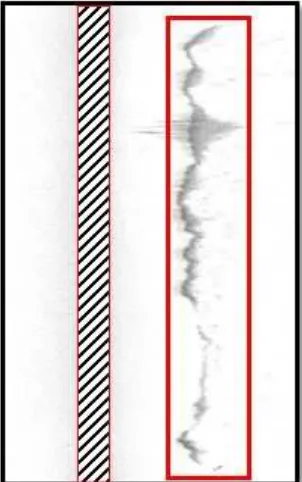
Figure 6. The backscatter image shows like a trench in the river bed downstream area (smoothest textures)
sophisticated way to compensate for the grazing angle dependence on the backscatter for different sediment types.
Alternatively, the moderate degree of correlation between measured backscatter and sediment grain size properties obtained in this study may be inherent due to the natural local variability of surficial sediments and the complexity of the physics of scattering. This study also revealed a positive correlation between the backscatter and sediment grain size distribution. Although this study unable to find another example of this comparison in the literature so it cannot be concluded whether it is typical for marine sediments. It is possible that the success of the analysis was because the sediment in Hulu Sungai Perak have a distinct modality, being silty muds with different amount of sand or gravel. However, it suggest that the analysis presented here could be useful determinant of grain size sorting.
5. CONCLUSIONS
The objectives of this articles were two-fold: first to investigate the characteristics of sediments in the Hulu Sungai Perak; second to correlate the side scan image with the signal strength to bolster and quantify the interpretations of these images. It is show that there is a clear difference between the acoustic character of the upstream and downstream at Hulu Sungai Perak. In the upstream area, background sediments can be clearly delineated from acoustic textures alone. Edge are the roughest because of the presence of rock fragments on the seabed causing an irregular relief. Background sediments in the downstream are mainly muds, forming a smooth seafloor. The difference between upstream and downstream is most probably caused by a difference in currents regimes. The generations of internal tides in the downstream could enhance the currents there and influence the resuspension of sediments. The work presented here is one of the multidisciplinary research necessary to understand the complex but unique dynamics and environment currently being discovered along the Hulu Sungai Perak.
This study found that side scan to be an excellent tool for assessing the morphology of the river bed sediment. The visual quality of the backscatter image obtained over any features will be site specific as it depends on the contrast of the acoustic properties of the seabed together with the micro and macro relief of organisms. As an alternative to side scan, swath bathymetry systems have also been used to determine marine morphology (Shyue and Yang, 2002), but these systems are much costly and logistically more demanding than side scan.
ACKNOWLEDGEMENTS
The author would like to acknowledge the support received from the Ministry of Higher Education, Universiti Teknologi Malaysia, Government of the State of Perak and Perak State Park Corporation who has been directly involved, give their permission and support this study. This research work is part of University Research Grant (Cost Center No. Q.J130000.2527.13H04).
REFERENCES
Bogen, J. and Ottesen, R. T., (2008). Global Geochemical Mapping and Sediments Associated Flux of Major World
Rivers. Geology for Society, Geological Survey of Norway Special Publication, 11, pp.83-92.
Brown, C. J., and Collier, J. S., (2008). Mapping Benthic Habitat in Regions of Gradational Substrata: An Automated Approach Utilising Geophysical, Geological and Biological Relationships. Estuarine, Coastal and Shelf Science 78, 203-214.
Craig J. B., Brian, J. T., Vladimir, E. K., and Richard A. P., (2011). Image Based Classification of Multibeam Sonar Backscatter Data for Objective Surficial Sediment Mapping of Georges Bank, Canada. Continental Shelf Research (31), S110-119.
Crone, T. (2004, November). The Basic Sediment Transport Equations Made Ridiculously Simple. In OCEAN/ESS 410 Marine Geology and Geophysics.
Czuba, J. A., Magirl, C. S., Czuba, C. R., Grossman, E. E., Curran, C. A., Gendaszek, A. S., & Dinicola, R. S. (2011, August). Comparability of Suspended-Sediment Concentration and Total Suspended Solids DataSediment Load from Major Rivers into Puget Sound and its Adjacent Waters. USGS Fact Sheet 2011–3083. Tacoma, WA: U S Geological Survey.
Deborah, C., (1992). Water Quality Assessment – A Guide to Use Biota, Sediments and Water in Environmental Monitoring. UNESCO/WHO/UNEP.
Golterman, H. L., P. G. Sly and R. L. Thomas (2003). Study of the Relationship between Water Quality and Sediment Transport. UNESCO: International Hydrological Programme.
Kyle, F. E., Jon, J. W., Peter, D. T. and Paul, S. B., (2003). Acoustic Instrumentation for Measuring Near-Bed Sediment Process and Hydrodynmics. Journal of Experimental Marine Biology and Ecology,pp 105-118.
Hewitt, J. E., S. F. Thrush, P. Legendre, G. A. Funnell, J. Ellis and M. Morrison (2004). Mapping of Marine Soft Sediment Communities: Integrated Sampling for Ecological Interpretation. Ecological Society of America Journal.
Gray, J. R., Gylsson, G. D., Turcios, L. M., & Schwarz, G. E. (2000, August). Comparability of Suspended-Sediment Concentration and Total Suspended Solids Data. USGS Water-Resources Investigations Report 00-4191. Reston, VA: U S Geological Survey.
Hickin, E. J. (Ed.). (1995). River Geomorphology. Chichester: Wiley.
Langland, M., & Cronin, T. (Eds.). (2003). A Summary Report of Sediment Processes in Chesapeake Bay and Watershed. In Water-Resources Investigations Report 03-4123. New Cumberland, PA: U S Geological Survey.
Perlman, H. (2014, March). Sediment and Suspended Sediment. In The USGS Water Science School.
Shyue, S.W., and Yang, K. T., 2002. Investigating Terrain Changes Around Artificial Reefs by Using A Multibeam Echosunder. ICES J. Mar. Sci. 59, S338-S342.