FAST AND ROBUST STEM RECONSTRUCTION IN COMPLEX ENVIRONMENTS
USING TERRESTRIAL LASER SCANNING
D. Wanga,∗, M. Hollausa, E. Puttonenb, c, N. Pfeifera
a
Department of Geodesy and Geoinformation, TU Wien, Vienna 1040, Austria -(di.wang, markus.hollaus, norbert.pfeifer)@geo.tuwien.ac.at
b
Centre of Excellence in Laser Scanning Research, Finnish Geospatial Research Institute (FGI), Masala 02431, Finland [email protected]
cDepartment of Remote Sensing and Photogrammetry, National Land Survey of Finland,
Finnish Geospatial Research Institute (FGI), Masala 02431, Finland
KEY WORDS:Terrestrial Laser Scanning, Stem Detection, Cylinder Fitting, RANSAC, Self-adaptive Cylinder Growing, Point Cloud Sampling
ABSTRACT:
Terrestrial Laser Scanning (TLS) is an effective tool in forest research and management. However, accurate estimation of tree pa-rameters still remains challenging in complex forests. In this paper, we present a novel algorithm for stem modeling in complex environments. This method does not require accurate delineation of stem points from the original point cloud. The stem reconstruction features a self-adaptive cylinder growing scheme. This algorithm is tested for a landslide region in the federal state of Vorarlberg, Austria. The algorithm results are compared with field reference data, which show that our algorithm is able to accurately retrieve the diameter at breast height (DBH) with a root mean square error (RMSE) of∼1.9 cm. This algorithm is further facilitated by applying an advanced sampling technique. Different sampling rates are applied and tested. It is found that a sampling rate of 7.5% is already able to retain the stem fitting quality and simultaneously reduce the computation time significantly by∼88%.
1. INTRODUCTION
Terrestrial Laser Scanning (TLS) has been established as an effi-cient tool for acquiring 3D data used for a multitude of applica-tions. For example, Buckley et al. (2008) described the usage of TLS data in geology, Ghuffar et al. (2013) used TLS data in com-bination with airborne laser scanning (ALS) data to monitor dis-placements of a landslide, Zogg and Ingensand (2008) used TLS for deformation monitoring of a bridge, Mart´ınez et al. (2012) used TLS data to extract building facades, and Eysn et al. (2013) used TLS data for extracting tree models in a forest. However, for forestry applications several publications can be found in lit-erature, using TLS data for extracting single tree parameters such as diameter at breast height (DBH) (Kankare et al., 2015), stem and branch models (Bremer et al., 2013), tree biomass (Calders et al., 2015), forest structure (Reid et al., 2014) or the forest terrain (Moskal and Zheng, 2011), just to name a few.
The current study is focused on the use of TLS data for deriv-ing forest parameters of landslide-affected forests. Such forests are often characterized by steep terrain with multi-layered canopy structure including dense understory, mixed forests and complex stem shapes. Thus TLS measurements in such forests are still challenging and often lead to an incomplete coverage of the 3D forest scene, especially in the upper tree canopy. Additionally, the measurements are often influenced by wind.
These facts lead to a limited usability of available approaches, such as convex hull method (Wezyk et al., 2007), alpha shapes method (Rutzinger et al., 2010), circles fitting on cross-section area (Olofsson et al., 2014), and even robust cylinder fitting method (Liang et al., 2014), which are often applied for managed forests that are less complex than unmanaged ones.
Therefore, the objective of this paper is to present a novel algo-rithm for stem modeling in complex forest environments. The
∗Corresponding author
stem reconstruction is done by a self-adaptive cylinder growing scheme. This algorithm is tested for a landslide region in the state of Vorarlberg, Austria. The derived results are compared with field reference data. The derived stem models will be used for assessing tree biomass, which will be used as a reference for calibrating ALS-based biomass regression models (Hollaus et al., 2009). Furthermore, the derived stem curves will be used as a ba-sis for predicting slope movements leading for example to tilted or curved tree trunks.
In the following section 2 the study area and the used data are de-scribed, in section 3 the developed method for extracting the stem shape is presented. Finally, in section 4 the results are presented and discussed in section 5.
2. STUDY AREA AND DATA
2.1 Study area
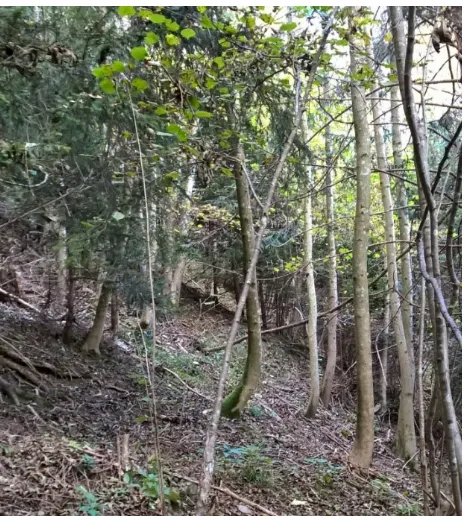
The study area is located in the federal state of Vorarlberg, Austria (Figure 1). The study site is inside a small forest over the main body of a landslide. The ground condition is complex featur-ing steep terrain, dense understory and dead tree branches. Tree stems are overall curved due to the effects of soil movements. The dominating tree species is Norway spruce (Picea Abies).
2.2 Study data
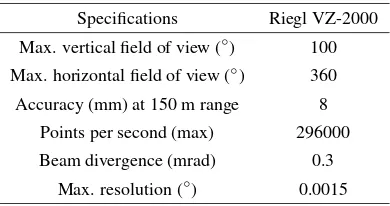
The TLS was carried out using a Riegl VZ-2000 (RIEGL Mea-surement Systems, Horn, Austria) in October 2015 under leaf-on conditions. Table 1 shows basic specifications of the scanner. It was not possible to set up the scanner from various directions because of the difficult terrain conditions. In total, seven scans were conducted in order to achieve a good TLS point coverage of all trees (Figure 1). Several trees were covered by TLS multi-scanning, whereas some were only measured from one scanning The International Archives of the Photogrammetry, Remote Sensing and Spatial Information Sciences, Volume XLI-B3, 2016
Figure 1. Study region in the state of Vorarlberg, Austria. The red rectangle covers a small transection which approximately equals to an area of 31 m×19 m. The blue dots indicate the locations of seven TLS scans.
position. The seven scans were registered using Riegl’s RiSCAN PRO software (http://www.riegl.com). The registered data was partitioned according to a defined polygon to cut off the points distributed outside the study site. No sampling or filtering was applied to original data at this stage. In total, more than 200 mil-lion points were exported.
In addition to the TLS measurements, the DBH (i.e. diameter at the height of 1.3 m above ground) of 27 trees were manually mea-sured using a measuring tape and were served as reference data. The average DBH in this study site is 32.8 cm and the standard deviation is 14.3 cm.
Table 1. Specifications of the scanner Riegl VZ-2000
Specifications Riegl VZ-2000
Max. vertical field of view (◦) 100 Max. horizontal field of view (◦) 360 Accuracy (mm) at 150 m range 8
Points per second (max) 296000
Beam divergence (mrad) 0.3
Max. resolution (◦) 0.0015
3. METHODS
3.1 Terrain Points Removal
The terrain points are estimated and removed firstly. In this paper, the determination of the digital terrain model (DTM) is done by a hierarchical approach (Pfeifer and Mandlburger, 2009). Start-ing from a thinned point cloud (lowest points within 3 cm raster cells), the lowest points within 4×4 m2 raster cells were used for a robust moving planes interpolation. For filling the gaps in the derived model a triangulated model is used, which is derived
from the lowest points within 4×4 m2raster cells. The derived elevation model is used for normalizing the elevations of the point cloud.
3.2 Stem Detection
Stem detection delineates and labels the point cloud into differ-ent trees, thus is important for the latter stem fitting procedure. At the same time, it is also a challenging task because the geometry of tree stems and the point density can vary significantly. Nor-mal vectors have been proven to be a promising technique to find points that belong to a stem in the forests (Liang et al., 2012). A point with a small z-component of its normal vector usually lies on a vertical structure. Nonetheless, the estimated normal vectors in complex environment can be implausible. For example, mis-cellaneous branches will affect the calculation of normal vectors and aggregated foliage points could lead to a ’false’ structure.
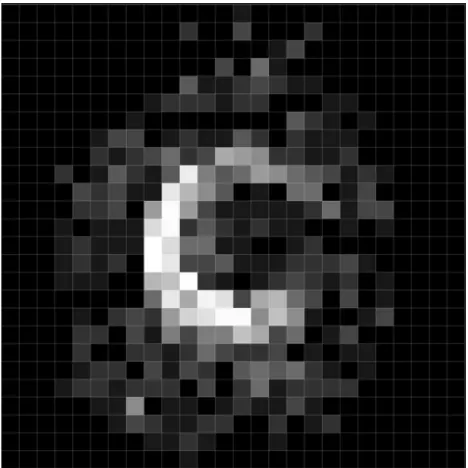
Stem points are generally distributed vertically in space, thus when projecting them onto horizontal plane, the corresponding cells will have larger density than others (Figure 2). Such prop-erty allows the separation of stem points from other points. Olofs-son et al. (2014) used a similar strategy for circles detection with Hough transformation. In complex forests, a potential issue is that tree stems are not rigorously vertical. The projected points may not perfectly form a circle, which poses a problem for circle detection. Furthermore, branchy and leafy trees will also result in plenty of points around the stem when projecting the point cloud. It is difficult to separate points associated with branches and leafs from the stem solely based on projected cells.
Figure 2. Point cloud around a tree projected onto horizontal plane with 2 cm×2 cm cells.
We firstly calculate the normal vectors from locally approximated planes. Then, all points are projected onto the horizontal plane with 2 cm×2 cm cells. Instead of counting the amount of points in each grid, the average absolute z-component of normal vectors divided by the amount of points is assigned to each cell. As men-tioned before, one would expect a small z-component value and a large quantity of points if the majority of points are from a ver-tical structure. Therefore, the calculated new value that assigned to each cell should be significantly small if the grid belongs to a tree stem. A proper threshold is selected to remove grids with large calculated value.
Our method assumes that at least part of the stem points are rec-ognized and grouped. Given that, we can simply enlarge the x-y extent of every group by a certain factor (e.g. a factor of 1.5 in this study) for every group, to retain all surrounding points from the point cloud if only parts of the stem are detected by the aforementioned approach. The range extension will probably also incorporate points from branches, foliage and even under-story. Nonetheless, our subsequent stem modeling technique is able to eliminate such effects.
3.3 Stem Reconstruction
3.3.1 Starting cylinder In a preparation step, each stem is di-vided into height sections. We chose 20 cm as the section height because a large value will not be able to retain the actual stem shape if the stem does not grow vertically. The section that con-tains the most points is selected as the starting section.
When modeling tree stems, cylinder is the frequently used geo-metric primitive (Markku et al., 2015; Kelbe et al., 2015). In view of this, we also fit circular cylinders to stem points. Thus, the crit-ical question is how to achieve a robust cylinder fitting. Liang et al. (2012) and Liang et al. (2014) applied Gaussian mixture er-ror model and re-weighted method to solve the non-linear least square problem. Meanwhile, the RANdom SAmple Consensus (RANSAC) (Fischler and Bolles, 1981) algorithm was also ex-plored to acquire a robust fitting, although it was applied to circle fitting for stem cross sections instead of cylinder fitting (Olofsson et al., 2014).
Figure 3. (a) Point cloud of a height section. (b) RANSAC cylin-der fitting. (c) Direct cylincylin-der fitting.
In this study, we apply the RANSAC algorithm to the cylinder fitting problem. RANSAC is able to identify inliers and outliers, thus diminish the impact of outliers (Figure 3). When solving the nonlinear least square fitting problem for cylinder, 7 points is the minimum amount of points that is required to achieve a unique solution (Beder and F¨orstner, 2006). Therefore, for each itera-tion, 7 points are randomly selected to generate a unique cylinder.
P = 1−(1−(1−ǫ)m)M (1)
where P= the probability to achieve a good model ǫ= percentage of error points in data m= minimum amount of points required
M= minimum number of iterations
The frequency of iteration that is required by the RANSAC al-gorithm is given by formula 1. In this study, 487 iterations are needed in order to achieve a good model at the probability of 99.9999%.
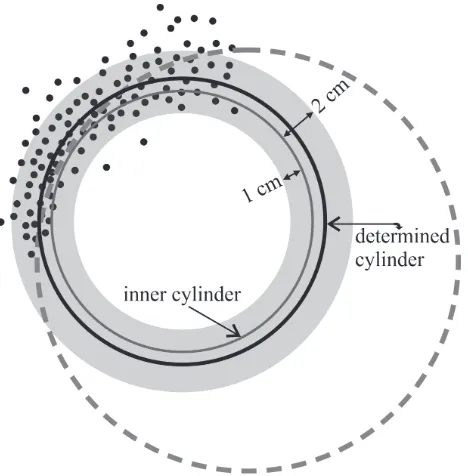
In each iteration, the distances between all points to the cylinder are calculated. We define an asymmetric distance to identify in-liers and outin-liers (Figure 4). The asymmetric thresholds are set because LiDAR pulses are not able to penetrate into stems, thus no points should be spread inside the cylinder. Therefore, the fit-ting can be regarded as geometric primitive inscribing. However, this assumption often does not hold under certain circumstances, such as due to co-registration error, textures on tree barks, long ranges or wind effects. In this regards, we set a 1 cm distance criterion inside the cylinder and a 2 cm limitation outside the cylinder. Further, the amount of points inside should be less than 20% of the points outside. Such asymmetric thresholds are use-ful to prevent the common overfitting issue when direct giving an asymmetric limitation, such as±2 cm (dotted circle in Figure 4). Consequently, we consider an inner cylinder (Figure 4). This simple idea is also an effective way to eliminate the impact of branches and leaves. One can conceive a cylinder that always fits itself inside the tree stem, thus is unaffected by branches or any points that away from tree stems.
After all iterations, the cylinder that contains the largest number of inliers will be selected as the determined cylinder. The radius of the determined cylinder is then enlarged by 0.5 cm to com-pensate the asymmetric distance threshold (Figure 4). It is worth mentioning that, such compensation is more likely because of the tree bark or the texture on the stem surface, not the deficiency of our algorithm. The asymmetric thresholds enforce the fitted primitive lies inside the stem points (i.e. inscribing), which is plausible because in practical, laser pulse cannot penetrate into stem.
3.3.2 Cylinder Growing Once the starting cylinder is deter-mined, a cylinder growing strategy is applied. A set of candidate cylinders are generated to represent the next section of the tree. The International Archives of the Photogrammetry, Remote Sensing and Spatial Information Sciences, Volume XLI-B3, 2016
Figure 4. Plan view of cylinder fitting. Dotted circle stands for the over-fitted cylinder.
The stem radius is decreased in 5% steps down to 80% for upper parts, and increased until 150% in the same way for lower parts, based on the assumption that tree stem will be thinner in higher parts. The axis is rotated by 20% of local maximum deviation an-gle allowance in the vertical direction until reaching such maxi-mum allowance, which is determined proportionally to the height of a section. A maximum 20-degree shift is allowed for the low-est part. This criterion is plausible because tree stem tends to be straight in the top. After the vertical shift, a 360-degree rotation on the horizontal plane is followed for the stretched vertex, with 30 degrees each time. The criterion of finding qualified points is the same with the starting cylinder fitting procedure. Simi-larly, the best candidate is determined as the one retained the most amount of inlier points. The cylinder growing is stopped on the upper part of the tree where not enough points exist, and downwards until reaching the ground.
3.3.3 Post Processing The cylinder fitting and growing allow the reconstruction of each tree stem with cylinders in every 20 cm section. The fitting is robust in terms of disturbances of points from branches, leaves or random noises. However, the cylinders may not be well sealed at the section connection parts (Figure 5). We apply a moving technique to further smooth the connection parts.
Figure 5 shows the scheme of moving window processing. A window with 20 cm height is moving to the connection part of two cylinders. Such a window will contain part of the data from section 1 and part from section 2. All contained data are tested against cylinder 1 and cylinder 2, respectively. The radius of one of the two cylinders which better fits all contained data will be selected. For example, in Figure 5, the cylinder 1 fits the data in the window better than the cylinder 2, thus its radius is chosen for this node. In this way, a truncated cone (Figure 5) is generated to replace the original cylinder. Therefore, each node at every 20 cm height is described by it spatial location and an assigned radius.
3.3.4 Sampling Technique LiDAR point cloud usually con-tains a large amount of data. How to efficiently process them is still a challenging task. In this study, we further integrate an advanced sampling method to test whether sampling of point
Figure 5. (a) Cylinder smoothing with moving windows. (b) Truncated cone.
cloud will speed up the processing while at the same time re-tain the quality of stem reconstruction. Point cloud sampling was performed with a sampling routine presented in Puttonen et al. (2013), namely leveled histogram sampling. The routine was selected based on its speed and effectiveness. The leveled his-togram sampling aims to collect scanned points evenly from a dis-tribution describing the point cloud with a selected metric. Here, the 3D distance of the points from the scanner was used. The algorithm requires two control parameters, the sample size and histogram bin width. For bins with high point number, the point selection is performed in uniform fashion as individual points are not assumed to have critical information in them. Bins with low number of points are included as such. The total number of se-lected points in all bins will correspond with the required sample size in the end.
In this study, 100 histogram bins were selected. These corre-sponded approximately to 0.40 m bin widths on average for the tested scans. Sampling times varied from 5 to 13 seconds for the tested sampling ratios from 0.5 to 50%.
4. EXPERIMENTS AND RESULTS
10 rounds of algorithm running were tested, for data with sam-pling rate of 0.5% to 100% (Figure 6). The overall results are demonstrated in Figure 6. The computation time and number of reconstructed trees are normalized to full data processing time and 27 trees, respectively (left axis in Figure 6). An overview of reconstructed tree stems in the test field in shown in the Figure 7.
Due to the fact that stem detection significantly depends on the data density, and the thresholds used in the detection algorithm vary from each dataset, therefore stem detections are done sepa-rately. The computation time is thus only considered for stem re-construction part, with same parameters and processing applied. Meanwhile, we only compare the results of DBH in this study. The average root mean square error of DBH compared to manual measurement is 3.7 cm, while the average median error is 1.2 cm, with the algorithm results smaller than field data. Trees with sig-nificant errors, e.g. the 3σrule, are marked as detection failure and excluded from comparison.
5. DISCUSSION
Figure 6. Results of stem detection and reconstruction for data with 10 sampling rates.
Figure 7. Overview of reconstructed stems in the test site.
environments. For example, in the forest with translational land-slide activities, tree growths are affected by the soil movement. The growth anomaly is reflected on stem shapes (Figure 8) and cross-sections (Figure 9). Subsequently, the stem detection be-comes a demanding task. Further, the irregular shapes make the stem reconstruction more difficult.
The advantage of our RANSAC based cylinder fitting strategy is that it does not require accurate stem delineation, which is a dif-ficult task in complex environments. The robust inner cylinder fitting (Figure 4) is able to eliminate the effects from branches and leaves. Figure 9 shows an example of a small curved tree in our study site. The stem points are only roughly delineated and some low vegetation and small braches are still retained. How-ever, the stem reconstruction works well and is not affected by outliers. In addition, the irregular shape of the stem is success-fully and smoothly restored. This is because our cylinder growing strategy always takes the advantage of the previous robustly de-termined cylinder, beginning from the starting cylinder which is determined by the RANSAC algorithm.
The results shown in Figure 6 indicated that a sampling rate at 7.5% achieved the best reconstruction quality in terms of RMSE error of DBH with 1.9 cm. The median errors are overall persis-tent, whereas the RMSE errors are increasing surprisingly when
Figure 8. Tree grow anomaly induced by translational landslides.
more data than 7.5% are involved in the calculation. This indi-cates that some large DBH deviations occur when more data are used. This could very well originate from the reason that more random noises are included inside the tree stem, and yet our al-gorithm is tending to find the inner cylinder inside the stem points (Figure 4). We further introduced a criterion that the amount of points inside should be less than 20% of the points outside. Such a criterion is set because theoretically LiDAR is not able to pen-etrate into tree stems and no points should be spread inside the stems. Nonetheless, in fact, points could potentially be present inside tree stems because multi-scans co-registration errors, wind effects or random errors. Therefore, if the amount of points inside The International Archives of the Photogrammetry, Remote Sensing and Spatial Information Sciences, Volume XLI-B3, 2016
Figure 9. 2D representation of a tree stem cross-section and cylin-der fitting. The red circle stands for direct fitting and the yellow one is the inner one that determined by our algorithm.
a tree stem is too large, our algorithm tends to underestimate the DBH due to the fact that we inscribe an inner cylinder to elimi-nate the impact from braches and leaves.
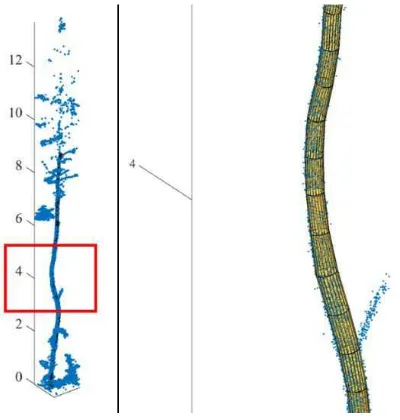
Figure 10. Example of one reconstructed tree stem.
On the other hand, a critical problem for tree stem fitting in land-slide region is that, most of the trees will not have a perfect cir-cular shape on the cross-section (Figure 9). The soil movement underneath the tree adds a mechanical stress to the root, and fur-ther changes the wood formation (Plomion et al., 2001). The stem cross-section will have an irregular shape, most often an ellipse-like shape instead of circle. That noted, a circular cylinder may not be proper or sufficient enough to represent the actual shape of the stem (Markku et al., 2015). Especially in this study, we fit a cylinder that inscribes the stem, which exacerbates the underes-timation the diameter. For example, the 2D representation of the yellow cylinder in Figure 9, is the inscribed inner cylinder that determined by our algorithm, which significantly underestimated the actual diameter. We highlight that such phenomenon should be taken into account in the future algorithm development. How-ever, we also point out that the inner cylinder provides a unique opportunity in quantifying the stem cross-section anomaly, which infers the underneath soil movement, if we can evaluate the level how the actual cross-section shape deviates from a circle.
promote the processing efficiency.
6. CONCLUSION
In this study, we present a novel tree stem detection and recon-struction method in complex environments (i.e. canopy structure, steep terrain, amount of undergrowth, occlusions of the TLS point cloud, shaped tree stems). Our method only requires a rough esti-mation of stem locations, which can be done automatically based on normal vectors and point projection density. The RANSAC based method is able to cope with the effects of tree branches, leaves and other outliers. A robust cylinder growing strategy is developed to restore the actual shape of tree stems. This algo-rithm is tested for a small forest in a landslide area. A further lev-eled histogram sampling method is also tested. We found that for the test dataset, a sampling rate at 7.5% achieved the best result with RMSE of DBH of 1.9 cm. In the meanwhile, the calculation time is reduced significantly by 88%.
We further addressed some difficulties and limitations of our al-gorithm, in modeling tree stems over landslide regions. In the form demonstrated here, our method tends to slightly underes-timate the diameter because we inscribe a cylinder inside the stem points, whereas the actual shape of tree stem could devi-ate from circular cylinder, especially in landslide region where the soil movement changed the wood formation mechanism, thus induced tree growth anomaly. Next development step of our ap-proach should be focusing on dealing with such growth anomaly on cross-sections.
ACKNOWLEDGEMENTS
The authors would like to thank Martin Wieser and David Reifelt-shammera for the assistance in field measurements. Special thanks are due to three referees for their constructive reviews that im-proved the manuscript significantly. This study is funded by the
¨
OAW project BioSLIDE.
REFERENCES
Beder, C. and F¨orstner, W., 2006. Direct solutions for comput-ing cylinders from minimal sets of 3d points. In:Computer
Vi-sionECCV 2006, Springer, pp. 135–146.
Bremer, M., Rutzinger, M. and Wichmann, V., 2013. Deriva-tion of tree skeletons and error assessment using lidar point cloud data of varying quality. ISPRS Journal of Photogrammetry and
Remote Sensing80, pp. 39–50.
Buckley, S. J., Howell, J., Enge, H. and Kurz, T., 2008. Terrestrial laser scanning in geology: data acquisition, processing and accu-racy considerations. Journal of the Geological Society165(3), pp. 625–638.
Eysn, L., Pfeifer, N., Ressl, C., Hollaus, M., Grafl, A. and Mors-dorf, F., 2013. A practical approach for extracting tree models in forest environments based on equirectangular projections of terrestrial laser scans.Remote Sensing5(11), pp. 5424–5448.
Fischler, M. A. and Bolles, R. C., 1981. Random sample consen-sus: a paradigm for model fitting with applications to image anal-ysis and automated cartography. Communications of the ACM
24(6), pp. 381–395.
Ghuffar, S., Sz´ekely, B., Roncat, A. and Pfeifer, N., 2013. Land-slide displacement monitoring using 3d range flow on airborne and terrestrial lidar data.Remote Sensing5(6), pp. 2720–2745.
Hollaus, M., Wagner, W., Schadauer, K., Maier, B. and Gabler, K., 2009. Growing stock estimation for alpine forests in austria: a robust lidar-based approach. Canadian Journal of Forest
Re-search39(7), pp. 1387–1400.
Kankare, V., Liang, X., Vastaranta, M., Yu, X., Holopainen, M. and Hyypp¨a, J., 2015. Diameter distribution estimation with laser scanning based multisource single tree inventory.ISPRS Journal
of Photogrammetry and Remote Sensing108, pp. 161–171.
Kelbe, D., van Aardt, J., Romanczyk, P., van Leeuwen, M. and Cawse-Nicholson, K., 2015. Single-scan stem reconstruction us-ing low-resolution terrestrial laser scanner data. Selected Topics in Applied Earth Observations and Remote Sensing, IEEE Jour-nal of 8(7), pp. 3414–3427.
Liang, X., Kankare, V., Yu, X., Hyypp¨a, J. and Holopainen, M., 2014. Automated stem curve measurement using terrestrial laser scanning. Geoscience and Remote Sensing, IEEE Transactions on52(3), pp. 1739–1748.
Liang, X., Litkey, P., Hyypp¨a, J., Kaartinen, H., Vastaranta, M. and Holopainen, M., 2012. Automatic stem mapping using single-scan terrestrial laser scanning. Geoscience and Remote
Sensing, IEEE Transactions on50(2), pp. 661–670.
Markku, k., Raumonen, P., Kaasalainen, M. and Casella, E., 2015. Analysis of geometric primitives in quantitative structure models of tree stems.Remote Sensing7(4), pp. 4581–4603.
Mart´ınez, J., Soria-Medina, A., Arias, P. and Buffara-Antunes, A. F., 2012. Automatic processing of terrestrial laser scan-ning data of building facades. Automation in Construction22, pp. 298–305.
Moskal, L. M. and Zheng, G., 2011. Retrieving forest inventory variables with terrestrial laser scanning (tls) in urban heteroge-neous forest.Remote Sensing4(1), pp. 1–20.
Olofsson, K., Holmgren, J. and Olsson, H., 2014. Tree stem and height measurements using terrestrial laser scanning and the ransac algorithm.Remote Sensing6(5), pp. 4323–4344.
Pfeifer, N. and Mandlburger, G., 2009. LiDAR data filtering and DTM generation. CRC/Taylor&Francis, pp. 307–333.
Plomion, C., Leprovost, G. and Stokes, A., 2001. Wood forma-tion in trees.Plant physiology127(4), pp. 1513–1523.
Puttonen, E., Lehtom¨aki, M., Kaartinen, H., Zhu, L., Kukko, A. and Jaakkola, A., 2013. Improved sampling for terrestrial and mobile laser scanner point cloud data. Remote Sensing 5(4), pp. 1754–1773.
Reid, T., Spencer, M., Huntley, B., Hancock, S., Essery, R., Carle, J., Holden, R., Baxter, R. and Rutter, N., 2014. Spatial quantifi-cation of leafless canopy structure in a boreal birch forest.
Agri-cultural and Forest Meteorology188, pp. 1–12.
Rutzinger, M., Pratihast, A., Oude Elberink, S. and Vosselman, G., 2010. Detection and modelling of 3d trees from mobile laser scanning data. Int. Arch. Photogramm. Remote Sens. Spat. Inf. Sci38, pp. 520–525.
Wezyk, P., Koziol, K., Glista, M. and Pierzchalski, M., 2007. Terrestrial laser scanning versus traditional forest inventory: First results from the polish forests. In: ISPRS workshop on laser scanning, pp. 12–14.09.
Zogg, H. and Ingensand, H., 2008. Terrestrial laser scanning for deformation monitoringload tests on the felsenau viaduct (ch).
International Archives of Photogrammetry and Remote Sensing
37, pp. 555–562.