Intensified production systems on western Brazilian Amazon
settlement farms: could they save the forest?
q
C. Line Carpentier
a,∗, Stephen A. Vosti
b, Julie Witcover
baWallace Center for Agricultural and Environmental Policy at Winrock International,
9200 Edmonston Road, Suite 117, Greenbelt, MD 20770, USA
bDepartment of Agricultural and Resource Economics, U.C. Davis, Davis, CA 95616, USA
Abstract
Annual land-use decisions of settlement farmers, estimated to approach half a million in the Amazon, can have significant impacts on forest conversion of the largest tropical moist forests. Given the biodiversity and climate change consequences of the disappearance of this forest, it is pivotal to understand these farmers’ reactions to combinations of technologies, policies, and institutional arrangements to predict their deforestation implications. This study aims to find whether settlement farmers in the western Brazilian Amazon will adopt more intensive production systems, and if they do, what the impact of this adoption would be on deforestation and farm incomes. Adoption of four types of intensification and their economic and environmental impacts were predicted using a farm level bioeconomic linear programming model. The four intensification types were: no intensification, intensification of non-livestock activities on cleared land, intensification on all cleared land, and intensification on both cleared and forested land. Intensified land uses on either the cleared or forested lands generate higher returns to labor and land, and thus will likely be adopted by settlement farmers. Also, intensification of non-livestock activities on cleared land resulted in the largest deforestation rates. Despite its lower deforestation rate, intensification on all cleared land (including pasture) resulted in the least amount of preserved forest after 25 years. More precisely it decimated the forest. Intensification on forested land — low-impact forest management — slowed the deforestation rate, but did not stop it unless timber prices
were increased to R$550 m−3(a R$435 increase over 1994 prices). Even with intensified activities on forested land, pasture
still dominated the landscape. In the long run, there is a trade-off between farm income and forest preserved, which results from intensification of land uses on the cleared land. Under the current socioeconomic and political setting existing intensification systems on the cleared land will not save the forest. Intensification systems on forested lands provide better hope because they increase the value of the standing forest, thus counteracting the pressure to deforest. © 2000 Elsevier Science B.V. All rights reserved.
Keywords: Bioeconomic model; Settlement farmers; Intensification; Amazon forest; Low-impact forest management; Forest margins; Brazil
q
Authors’ names appear in alphabetical order; no senior author-ship is ascribed.
∗Corresponding author. Present address: CEC 393, rue St-Jacques
Ouest, Bureau 200 Montreal (Quebec), Canada H2Y 1N9. Tel.:
+1-514-350-4336; fax:+1-514-350-4314.
E-mail address: [email protected] (C. Line Carpentier).
1. Introduction
Deforestation in the largest tropical moist forests has consequences for biodiversity and climate change, of both national and international concern. This study uses a farm level bioeconomic model (FaleBEM) to simulate the effects of four types of intensification on deforestation and farm incomes. Three levels of
sification on cleared land are simulated: no intensifi-cation, intensification of non-livestock activities, and intensification on all cleared land. In addition, intensi-fication on forested land modeled as low-impact forest management is also simulated.
The study focuses on what researchers and poli-cymakers might do to design and manage intensi-fication technologies that slow deforestation while maintaining or increasing farmers’ income. If halting deforestation is the goal, it is found that sustainable intensification requires a redesign of the type of agri-cultural technology being developed and made avail-able to farmers, and that agricultural intensification is necessary but not sufficient to slow deforestation. Po-tential impacts on deforestation should be taken into account at the onset of technology research. Intensifi-cation in forested areas, modeled as low-impact forest management, is promising because it increases the value of the standing forest and thus should be further researched.
The geographical focus of this study in the western Brazilian Amazon is the settlement project of Pedro Peixoto in the state of Acre. This site was chosen be-cause of its biophysical and socioeconomic diversity, and because, when this research was initiated, the area was relatively under-studied in comparison to the east-ern Amazon. This site is also similar agroclimatically to much of the Amazon basin and to other tropical ar-eas outside Latin America (Gillison, 1999). For these reasons, the settlement was selected as one of the sites for the alternatives to slash-and-burn (ASB) pro-gram — a long-term collaborative, interdisciplinary research effort — under which the model presented here was developed. The focus on farm-level analysis is useful to capture the heterogeneity in biophysical conditions, market access, market imperfections, or market failure these farms face and the impact of this heterogeneity on land-use decisions.
This study aims to find whether settlement farmers in the western Brazilian Amazon will adopt more in-tensive production systems and, if they do, the impact of this adoption on deforestation and incomes. The next section reviews the intensification–extensification debate. Section 2.3 describes what it means to inten-sify on settlement farms in the state of Acre. Section 3 describes how intensification–extensification de-cisions are modeled. Section 4 simulates whether farmers adopt these intensification strategies and, if
they do, reports the income and deforestation impacts of this adoption. Section 5 concludes the study and presents policy implications.
2. Intensification and deforestation in the forest margin
This section reviews the drivers of deforestation and the debate over the impact of agricultural intensifica-tion on forests in tropical areas, and defines what it means to intensify for settlement farmers in the state of Acre.
2.1. External and internal drivers of deforestation
Over time, deforestation has been attributed to both external (macro-level) and internal (meso-level) drivers. This study focuses on the internal factors because past efforts to turn off the “external drivers” (distorted macro-economic policies encouraging movements of people and capital to the forest margins, such as directed colonization projects and subsidies for investments in the Amazon) have largely failed to effectively slow deforestation.
For Brazil, the following internal drivers have been put forward: poverty, property rights, poor soils, mar-ket access, and undervaluation of the forest (Hecht, 1984; Dale et al., 1993; Vosti and Reardon, 1997). Poverty, property rights, and poor soils are believed to drive deforestation because farmers must deforest to eat, to secure land title, or to continuously bring new land into cultivation to keep the same level of production. Better market access and undervaluation of forest products and of the standing forest create incentive to clear the land to produce more and in-crease income (for details, see Vosti et al., 2001 or Carpentier et al., 2000a).
2.2. The intensification–deforestation debate
Two views still prevail on the impact of agricultural intensification on forests in tropical agriculture. One states that food requirements can be met by increased production from existing agricultural land, thereby removing pressure from forested areas (marginal ar-eas). The other maintains that increased profitability associated with technological progress in frontier agriculture will stimulate deforestation (Angelsen et al., 1999).
Since permanent agriculture has existed, the ex-panding populations’ food demand has been met through deforestation — expansion of agricultural land into forested and marginal lands (Bilsborrow and Geores, 1994). With food demand expected to grow steadily over the next decades and most of the pro-ductive land already in production, many argue that technological progress and intensification of agricul-ture are necessary to reduce the pressure on tropical forests and marginal lands.
However, Kaimowitz and Angelsen (1998) found that empirical evidence of the deforestation effect of agricultural intensification are ambiguous. The history of tropical agriculture also provides a multitude of examples in which the adoption of new technolo-gies, in combination with the expansion of market access for crops such as bananas, cocoa, coffee, oil palm, rubber and sugar cane, led to widespread de-forestation (Barraclough and Ghimire, 1996). In these cases, technological progress induced more deforesta-tion by making conversion of forests to agricultural land more profitable; it did not take the pressure off the forest.
2.3. Current land uses in the Acre settlement
What does it means to intensify for settlement farmers in the western Brazilian Amazon? This ques-tion is answered by first presenting farmers’ current practices. In 1994, some 160 households in the col-onization projects of Pedro Peixoto, Acre, and Theo-broma, Rondônia, were selected for interviews (Theo-broma was the other ASB site). Sample selection was based on variation in access to markets (prox-ied by quality of infrastructure in each season), soil type and production potential, and years since initial
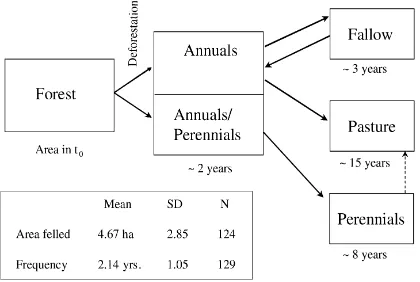
Fig. 1. Land-use systems on settlement farms in the western Brazilian Amazon.
settlement of lots in the subdivision of the project. The sample included some medium-sized operational holdings on which farmers are now expanding their livestock activities (up to approximately 200 ha), but not large-scale ranchers. Of the farms visited in 1994, approximately 140 were re-surveyed in 1996, along with an additional 86 farms representing more recent arrivals and squatters previously under-represented (see Witcover and Vosti, 1996; Vosti and Witcover, 1996; Vosti et al., 2001, for details). Fig. 1 sets out the predominant paths through which forested land (mostly logged over forest) is converted to other uses, and the amount of time (in agricultural years) par-ticular parcels tend to spend in specific uses for the 1994 sample. The predominant path appears in the middle; the land is deforested, cultivated for a couple of years and planted to pasture. Sometimes the land goes through fallow cycles, with land staying in fal-low for an average of 3 years before ending in pasture or remains in fallow and becomes secondary forest (secondary forest is included in the fallow category). This predominant path is confirmed by Fig. 2 show-ing 1996 land-use patterns for farms of different ages, where age is determined by the number of years since initial settlement of the lot. Clearly the trend is one of falling forest and rising pasture as the farm ages (Vosti et al., 2001).
Fig. 2. Proportion of 1996 farms in each land use by age of farm settlement.
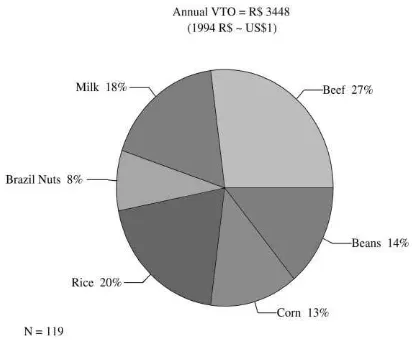
value of total output in 1994 was extracted from pas-ture and livestock activities (milk and beef), while only 8% of farmers’ value of total output derived from the forest (mainly Brazil nuts since timber extraction is limited by administrative requirements making timber extraction practically impossible).
Against this backdrop of land-use systems and income-generating activities, what does it mean to intensify? Intensification can mean (1) increasing the amounts of purchased inputs dedicated to a particular activity (indicated by a box in Fig. 1), (2) increas-ing the amount of labor dedicated to the activity, (3) increasing output per unit of land, (4) combining some of the above, (5) extending the useful life of a
Fig. 3. Settlement of farmers’ on-farm income sources (value of total output).
particular land use, or (6) increasing the number of ‘arrows’ linking activities, thereby providing farmers with more options.
In this study and in the model used for the analysis, intensification is viewed in an activity-specific way — products can be produced using different levels of intensities. Higher levels of intensity usually (but not always) mean increased returns to land and labor, ad-ditional purchased inputs, and increased sustainability in the sense that the land use ‘lasts longer’. Given scarce labor and limited access to credit but relatively abundant land in the area, it is not clear a priori whether these intensive systems will be adopted.
3. Analytical tool: a farm-level bioeconomic model
To understand the factors driving land use and deforestation at the meso-level, actors at the micro-level making decisions that result in the observed meso-level land uses and the reasons behind their decisions must be understood. Once those are under-stood, specific actions policymakers and technology designers might take to alter farmers’ decisions can be identified.
3.1. FaleBEM — the bioeconomic model
The biophysical and socioeconomic complexities faced by settlers were integrated in a farm-level bioeconomic (FaleBEM) linear programming (LP) model using survey data supplemented by techni-cal coefficients collected via farmers and experts. FaleBEM is discretely dynamic in the sense that each year’s activities result in a new stock of financial and natural resources that become the initial conditions for the next year. Nutrients, cash, livestock, pasture, and fallow of different ages and technology levels, for instance, can be carried forward to the next season, used, or sold in any season. The optimal solution is the one that maximizes the discounted value of the family’s consumption stream over a 25-year time horizon by producing a combination of products for home consumption and sale, selling labor off-farm, or extracting products from the forest subject to an array of socioeconomic, policy, and biophysical con-straints. Although FaleBEM maximizes consumption resulting from the intertemporal allocation of in-comes and savings, the term “income” is used in the text because it is a more familiar concept than con-sumption. Socioeconomic constraints reflect prices and input and output market imperfections in the settlement. For example, quotas are imposed on milk sales to reflect the decreasing price schedule offered by milk processors, monthly labor available to hire is limited to 15 man-days to reflect the scarcity of labor, wages vary monthly to reflect peaks in labor demand, and expenses are limited to the seasonal amount of cash in hand to reflect the difficulty in obtaining credit. Markets and policies are reflected in prices and the set of activities permitted in the simulation. For example, the 50% rule mandating that no more than half of any farm be cleared for agricultural purposes is not enforced in the simula-tions to indicate that the law has not been enforced on settlement farms so far. FaleBEM includes all of the common crops and crop rotations (intercropped or grown in succession) at various levels of intensi-fication found in the settlement. Crops include rice, beans, maize, coffee, bananas, manioc, and grass and legume pasture. Technologies had to be packaged because of data limitation, thus preventing piece-meal adoption of intensification technologies in the simulations.
Biophysical factors constrain activity choices over time. More specifically, biophysical constraints re-quire that enough nutrients are available to cultivate, or else yields decrease through a linearized nutrient response function. Also, agronomic constraints limit possible land-use sequences. For instance, annual crops cannot be planted after pasture (because tillage is not used on settlement farms). Soil fertility is man-aged either by adding commercial fertilizer, changing the product mix, letting land go fallow, or expanding into new areas (deforesting).
3.2. Model data
Three types of data were needed to build FaleBEM: (1) price, cost, and market data, (2) biophysical data (yield, nutrient demands, nutrient accumulation in the fallow, etc.), and (3) data about farmers’ initial con-ditions. Price, cost, and market data were collected from public sources and completed through interviews with farmers, transporters, and buyers. Biophysical data were gathered through the ASB program (Munoz Braz et al., 1998; Palm et al., 1996), focus groups, in-terviews with experts in the area, and published data (e.g., Valentim Ferreira, 1990).
Because the model is dynamic it must be initiated with initial conditions about the household and the farm being modeled. Each farm in the sample de-scribed in Section 2.3 can be modeled by changing the model’s initial conditions. However, the task was simplified by clustering the 1994 data based on char-acteristics exogenous to farmers’ decisions, such as
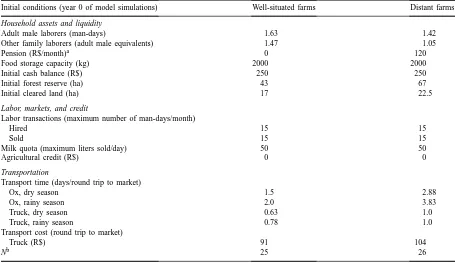
Table 1
Farm and farm household initial conditions in 1994 for two farm types
Initial conditions (year 0 of model simulations) Well-situated farms Distant farms
Household assets and liquidity
Adult male laborers (man-days) 1.63 1.42
Other family laborers (adult male equivalents) 1.47 1.05
Pension (R$/month)a 0 120
Food storage capacity (kg) 2000 2000
Initial cash balance (R$) 250 250
Initial forest reserve (ha) 43 67
Initial cleared land (ha) 17 22.5
Labor, markets, and credit
Labor transactions (maximum number of man-days/month)
Hired 15 15
Sold 15 15
Milk quota (maximum liters sold/day) 50 50
Agricultural credit (R$) 0 0
Transportation
Transport time (days/round trip to market)
Ox, dry season 1.5 2.88
Ox, rainy season 2.0 3.83
Truck, dry season 0.63 1.0
Truck, rainy season 0.78 1.0
Transport cost (round trip to market)
Truck (R$) 91 104
Nb 25 26
aAll prices are reported in terms of 1996 Brazilian reais.
bThe sample size is smaller because it includes Acre farms only and only those farms falling within the two clusters are presented in
the table.
soil type, distance to market, and age of the farm. Sev-eral clusters of farmers with similar patterns emerged, each of which can be thought to represent a farm type. The set of initial conditions used in this study represents well-situated farms (in terms of market access) with predominant medium-quality soil types (those with some fertility problems and/or mild slope or rockiness). Well-situated farmers were emphasized here because they will become more prevalent in the future as technology spreads, infrastructure improves, and unsuccessful farmers give up and are replaced by more successful ones. The initial conditions for that farm type and distant farms are presented in Table 1. Initial land-use conditions are also captured at year “zero” along the horizontal axis of Figs. 4–7, which depicts that in 1994 a majority of the lot was forested (43 ha) and the lot size was 60 ha.
Fig. 4. Land uses when no technological intensification is available.
Fig. 5. Land uses when intensification is available for non-livestock activities on cleared land.
Fig. 7. Land uses when intensification is available for all activities on cleared and forested land.
monthly labor requirements) and output levels (see Carpentier et al., 2000a, for details). The model was validated using the panel data collected for 1994 and 1996 and by modeling the various farms from the ini-tial settlement when the lot was completely forested to the present and by determining if the modeled land uses and land-use paths resemble those currently ob-served in the field. Sensitivity analyses — how stable or robust is the solution to factors varied one at a time — were conducted on six factors: soil quality, labor, prices, discount rate, distance to market, and access to market. Labor availability, distance to market, and access to market (especially to milk processors) were found to affect deforestation rate, but none of the other factors did. Prices and market access greatly affect uses of the cleared land and income, as expected. All factors except discount rates affect income. Discount rate had little effects on results because investments with returns in later years, such as perennial crops, were not selected under 1994 conditions. Though the magnitude of the effect varied by farm type, the sign of the changes was the same for all farm types.
This validated baseline reflecting 1994 policy, socioeconomic, technological, and biophysical con-ditions can be used to predict what would happen if one or a combination of these conditions were al-tered. Before presenting these simulations, however, more information is presented on the intensification alternatives present in the model.
3.3. Modeled intensified systems
Currently, intensification strategies are mainly avail-able for cleared land: for annual crops, perennial crops,
and pasture. However, a pilot study conducted by EM-BRAPA (Brazilian Agriculture Research Corporation) provides the information necessary to model intensifi-cation in the forested area, represented by low-impact forest management.
3.3.1. Cleared land
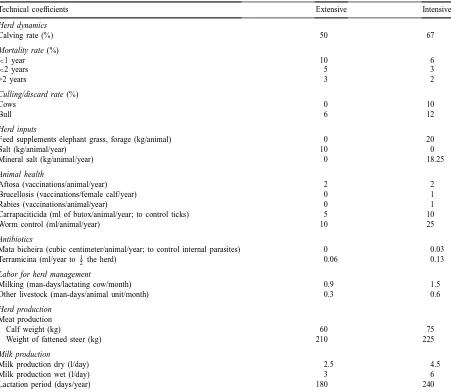
Our research effort and collaboration with EM-BRAPA uncovered sets of intensification strategies for annual and perennial crop production, as well as pasture for livestock production. For example, Table 2 presents the extensive low-production pas-ture system and an intensified system recommended by EMBRAPA. Intensified pastures are seeded using improved purchased seeds and demand more labor to build more fences, thus improving pastures’ carrying capacity. These practices increase the yearly carrying capacity and increase the useful life of the pasture by slowing the decay in carrying capacity. Increasing the intensity of the livestock operations in this context means increasing labor (to improve management) and capital inputs (to provide more veterinary and supple-mental feeds), yielding higher calving rates, higher milk production and duration of the lactation period, and lower mortality rates (Table 3). Similar technol-ogy tables are available for annuals, perennials, and deforestation.
3.3.2. Forested land
Table 2
Technical coefficients for settlement farms1 pasture production systems in Acre, by pasture type and level of technology
Technical coefficients Grass Grass/legume intensive
Extensive Intensive
Pasture establishment and management
Seeds (kg/ha)
Brizantao 15 15 15
Kudzu 1
Labor (man-days/year)
Seeding (year 1) 3 3 3
Weeding (year 1) 2 3 3
Weeding (years 2–4) 2 3 3
Weeding (years 5–11) 2 3 3
Fencing
Length (m of fence/ha of pasture) 63 106 106
Oxen time (man-days/km of fence) 4 4 4
Own chainsaw (man-days/km of fence) 4.5 1 1
Labor (man-days/km of fence) 59 56 56
Total costs (R$/km of fence)a 302 347 347
Pasture productivity
Carrying capacity (animal units/ha, rainy season)
Year 2–3 1 1 1.5
Year 4 1 1 1.5
Year 5 0.88 0.99 1.5
Year 6 0.79 0.97 1.5
Year 8 0.49 0.9 1.5
Year 9 0.39 0.85 1.5
Year 10 0.29 0.8 1.5
Year 11 0.3 0.85 1.48
Year 15 0 0.65 1.4
Year 20 0 0 0.9
aAll values are in 1996 Brazilian reais, labeled R$; one R$ was roughly equivalent to one US$.
forest of little value to farmers. Allowing farmers to extract timber in a sustainable way would increase the value of the standing forest and remove incentives farmers have otherwise (as will be demonstrated in the following section) to clear the forest completely despite the 50% rule. The rule is not effective because the Brazilian authorities have not had the administra-tive capacity to enforce this law on the half-million settlement farms found in the Amazon.
EMBRAPA obtained permission from the environ-mental ministry (IBAMA) to train 10 selected farmers to practice low-impact forest management on their on-farm forest reserves. Together, the farmers could afford the initial investments necessary to start extract-ing timber while minimizextract-ing environmental impacts. Each farmer had on an average 40 ha of legal reserve, thus the total extraction area was 400 ha. The common
Table 3
Technological coefficients for settlement farms cattle production systems in Acre, by level of technology
Technical coefficients Extensive Intensive
Herd dynamics
Calving rate (%) 50 67
Mortality rate (%)
<1 year 10 6
<2 years 5 3
>2 years 3 2
Culling/discard rate (%)
Cows 0 10
Bull 6 12
Herd inputs
Feed supplements elephant grass, forage (kg/animal) 0 20
Salt (kg/animal/year) 10 0
Mineral salt (kg/animal/year) 0 18.25
Animal health
Aftosa (vaccinations/animal/year) 2 2
Brucellosis (vaccinations/female calf/year) 0 1
Rabies (vaccinations/animal/year) 0 1
Carrapaciticida (ml of butox/animal/year; to control ticks) 5 10
Worm control (ml/animal/year) 10 25
Antibiotics
Mata bicheira (cubic centimeter/animal/year; to control internal parasites) 0 0.03 Terramicina (ml/year to 1
2 the herd) 0.06 0.13
Labor for herd management
Milking (man-days/lactating cow/month) 0.9 1.5
Other livestock (man-days/animal unit/month) 0.3 0.6
Herd production
Meat production
Calf weight (kg) 60 75
Weight of fattened steer (kg) 210 225
Milk production
Milk production dry (l/day) 2.5 4.5
Milk production wet (l/day) 3 6
Lactation period (days/year) 180 240
man-days requires a chain saw and 0.2 man-days re-quires an ox. The remaining is just labor. Returns per cubic meter or per hectare, excluding labor and equip-ment costs but including transportation costs, is R$95.
4. Simulations and results
This section presents four simulations represent-ing different types of intensification along with their resulting land uses and incomes.
4.1. Simulations
Intensification has typically been viewed as inten-sifying activities on cultivated or cleared land. Types of intensification on cleared land are added one at a time to generate the first three simulations for the well-situated farmer described in Section 3.2. Extrac-tion of timber is not allowed for these simulaExtrac-tions. First, the model is constrained to use only the ex-tensive low-productivity activities; all intensification types are turned off. Second, all types of intensifica-tion are available to choose for non-livestock (annuals and perennials) activities on cleared land. Then in-tensification is available on all cleared land activities (annuals, perennials, pasture and cattle production). For the fourth simulation, all intensification types on the cleared land are turned on, in addition to the low-impact forest management on forested land. In all simulations with intensification technologies turned on, the farmer is free to choose extensive or intensive systems for some or all of the activities. Adoption of particular land uses and technology levels indicates that given the model constraints, these activities are the most profitable over the 25-year period.
4.2. Land-use results
4.2.1. No intensification available
This simulation reflects the situation of farmers that do not have access to intensification information because of inadequate extension services, lack of edu-cation (making farmers unable to comprehend avail-able information), or farm remoteness. This would not typically be the case for the well-situated farmer modeled here. Under this technological starvation de-forestation begins slowly, accelerates somewhat from about year 3 to year 15, and then slows substantially (but does not stop). Fig. 4 shows how land uses change from the initial land-use conditions to replace forest with pasture and fallow. The area in pasture expands dramatically between year 3 and about year 10, and remains constant thereafter, though the composition of this pasture changes as older pastures are put into fallow rehabilitation cycles and new pastures are es-tablished. Extensive pasture has a useful life of only 11 years, thus pasture starts being rehabilitated in year 14 and cycles in and out as batches of a pasture’s use-ful life expires. At year 25 pasture reaches 31 ha and forest 9 ha. Annual crops increase slightly and then stay constant at 5 ha throughout the planning horizon.
Manioc for consumption is the only perennial crop grown here. The initial fallow disappears at the be-ginning of the simulation and then reappears in year 12, to reach 11 ha at year 25. This “no intensification” simulation thus retains a fair amount of biomass in the forest and fallow land uses, although the lot is dominated by pasture at year 25. This simulation has farmers sell on an average 130 man-days off the farm, although about 40 man-days are hired-in during the peak months of February, April, and May. Therefore, even with extensive low-productivity technologies, activities on cultivated land generate greater revenues than Brazil nut extraction. Revenues average R$1800 per year and are generated mostly from sales of annual crops, milk, and labor.
4.2.2. Intensification available on non-livestock activities on cleared land
after the first 4 years. Two-thirds of the income is generated from livestock activities and 20% from annuals.
4.2.3. Intensification available on all activities on cleared land
This simulation could be considered the baseline for the well-situated farmers modeled here because (1) farmers are not currently allowed to extract timber from their forest reserves, (2) the low-impact forest management technology is still at the pilot level, and (3) well-situated farmers are likely to have access to intensification information on all technologies. Other farm types more distant from the market or with less farmer education may not have such access, so there baselines may lie somewhere between the first three simulations.
When allowed to choose the intensity level of all activities on cleared land including pasture and cat-tle production, the modeled farmer overwhelmingly selects the intensified technologies on all activities. Intensified pasture and livestock activities are more profitable than intensified annuals or perennials and 85% of the farm is in pasture at year 25. Fig. 6 depicts the land-use patterns associated with this sim-ulation. Although more cash is available to hire labor to slash and burn the forest, and the larger stream of revenues from the cleared land should provide incen-tive for higher deforestation rates, the deforestation rate is slower than under the limited intensification simulations on cleared land because labor demand for pasture establishment and maintenance limits the rate at which the forest can be cleared. However, that rate is maintained throughout the simulation and the forest disappears completely at year 25. Extended out to 35 years, the simulation suggests that fallow continues to increase at approximately 0.20 ha ev-ery 2 years and plateaus at 5.5 ha in year 35. The only brake on deforestation under this simulation is the labor constraint; without constraint on labor, the forest disappears within 19 years (Carpentier et al., 2000a).
Not all activities and land uses are homogeneous. Mainly because of differences in labor demand and the months in which this labor is needed, the same activities are practiced at different levels of intensity. For example, in almost any year, some annuals are grown with the extensive and intensified technologies
(Fig. 6). Also, some extensive pasture is maintained throughout for the bull and the ox. Finally, fallow ap-pears between years 5 and 12, disapap-pears completely, and reappears in year 18, after which it keeps on in-creasing to provide the nutrients to support annual crop production. Even after the forest has completely dis-appeared, it is still cheaper to grow the family’s basic food (rice, corn, beans, and manioc), which requires fallowing some land for a few years, than to buy the food at market prices plus transportation costs.
Taken together, financial flows from on-farm agri-cultural and extractive activities and off-farm sales of adult male labor are substantial. Savings during the first few years allow for subsequent investments that boost production (and consumption) in later years. Large investments (negative savings) are required in years 5, 9, and 11 to expand intensified pasture areas and purchase higher-quality cattle. Farm profits peak at about year 13, at a level of approximately R$9000 per year, and appear to begin to decline or stabilize af-ter the end of the 25-year time horizon presented here. Sold labor averages approximately 125 man-days and hired labor about 48 man-days after the first 3 years.
4.2.4. Intensification allowed on all activities on cleared and forested land
This simulation makes available an intensive ac-tivity on the forested land in addition to the intensi-fication technologies of the previous simulation. This intensification technology is the pilot low-impact forest management conducted by EMBRAPA. As mentioned earlier, before this technology is available to farmers three obstacles have to be surmounted: (1) the technology must be perfected and passed on to farmers, (2) farmers must be willing to manage their forests as common property, and (3) the law must be changed to legalize the activity.
and perennials. Thus, compared to intensification on cleared land, the annual area is reduced and fallow is eliminated completely, reflecting the higher opportu-nity cost of the land under this simulation. Intensified pasture is still the dominant land use. Intensifying on both sides of the farm, at least for the type of inten-sification presented here, takes some pressure off the forest but does not stop deforestation. The average rate of deforestation for intensification on cleared land only is 1.72, compared to 1.38 for intensification on both cleared and forested land. The rate of defor-estation decreases over time for all simulations, but it decreases more quickly for the simulation with intensi-fication on all land. The average deforestation rate for the last 5 years is 1.5 for the intensification on cleared land and 0.8 for the simulation with intensification on all land. At that rate, the forest would not disappear for another 10.5 years, or in 35.5 years instead of 25 years. The hired and sold labor patterns vary more drastically under this simulation. Hired labor is ap-proximately 28 man-days after 3 years, increases to 40 man-days between years 4 and 9, and drops back down to 20 man-days starting in year 10. Sold labor is 140 man-days the first 3 years, drops to 90 man-days from year 4 to 13, and increase to 125 thereafter. Large investments are made in years 5, 9, and 11. The average income approximates $9500, composed of dairy activities (85%), annuals (9%), extraction activi-ties (4%), and labor (2%). The difference between the simulation with intensification on all cleared land is
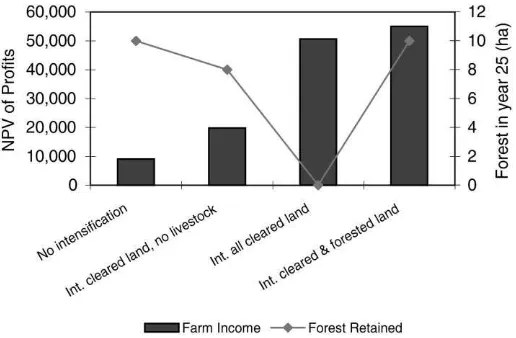
Fig. 8. Income and forest preserved at year 25 by level and type of intensification.
that its deforestation rate is maintained until all forest is gone, while the deforestation rate of the other simu-lations slow down earlier on. The main difference with the no and limited intensification on cleared land simulations is not how much forest is preserved, but rather the elimination of fallow and degraded pasture, lower annuals, and more pasture. For instance, the no and limited intensification on cleared land have 14 and 17 ha of fallow and degraded land, respectively. These hectares constitute additional pasture under the simu-lation with intensification on all land. In addition, this simulation has half as much annuals as the no and lim-ited intensification on cleared land. Sensitivity analy-sis with 1996 prices reveals that 20 ha of forest would be preserved with the higher timber and coffee prices farmers were offered in 1996. Even in 1996, however, income from the cleared land is larger than from the forested land since the forest keeps going down.
4.3. Farm income results
technological starvation, R$19 813 for intensifica-tion on non-livestock cleared land, and R$50 635 for intensification on all cleared land simulations. The corresponding hectares of forest preserved at year 25 for these simulations are 9, 8, and 0 ha, respectively.
Intensification on the forested land, on the other hand, provides a gain in both income and forest pre-served in year 25. The NPV of the income stream over the 25-year period is R$55 000, and 9 ha of forest re-main in year 25. Sensitivity analysis with 1996 prices increases this income further to R$90 000. Thus high coffee and timber prices provide a win-win situation in which both farmers’ income and amount of forest preserved increase.
The average number of man-days hired-in and sold off-farm over the years (sum over the months in each year) under each simulation indicate the cyclical nature of labor demand, the profitability of on-farm activity compared to on-going wages, and relative re-turns to labor. The simulation with intensification on all cleared land hired-in the most man-days, approxi-mately 50, while the simulation with intensification on both cleared and forested land hired-in the least, approximately 30 man-days. More labor was needed under the simulation with intensification on all cleared land to support the sustained deforestation rate and the intensive pasture system. Under the last simula-tion, more labor was needed during the early years to extract timber, deforest, and establish pasture, but declined once less timber remained to be extracted, the pasture was established, and deforestation slowed down. Of the total 180 man-days that could have been sold off-farm, the well-situated farm sold the least under the intensification on non-livestock activities on cleared land simulation and the most under the no in-tensification simulation. That is returns to labor under no intensification were generally lower than on going wages. Moreover, intensive annual production selected under the intensification on non-livestock activities simulation generated large enough returns to main-tain labor on-farm and is more labor intensive than pasture production or pasture and timber extraction.
5. Conclusion and policy implications
This study simulates intensified production sys-tems that are or could be made available to settlement
farmers in the western Brazilian Amazon. These sys-tems are profitable, raising farmers’ incomes, and would thus likely be adopted if made available to the well-situated farmers modeled in this study. Sen-sitivity analysis on farmers distant from the market indicates that they would also adopt those intensified systems, although the income generated would be less. Under 1994 and 1996 prices and market condi-tions, no-intensification schemes saved the forest. It was further found that the type of intensification sys-tem affects whether or not its adoption will increase or decrease the rate of deforestation. However, inten-sification on both the cleared and the forested land re-sulted in the slowest deforestation rate and the largest amount of preserved forest over a 25-year period.
In the long run, there is a trade-off between farm income and forest preserved, which results from intensification on the cleared land (Fig. 8). More specifically, the private benefits from intensifying production with the currently available technologies are at odds with the social costs in terms of forest loss they provide. Model results indicate that in the short run, not providing pasture and cattle intensifica-tion systems to farmers could increase deforestaintensifica-tion. Either way, under the current socioeconomic and po-litical setting, existing intensification systems on the cleared land will not save the forest; instead, it cre-ates an impetus for deforestation through the increase income stream that can be captured by deforesting and planting to intensive production systems. Intensi-fication systems on forested land provide better hope because it increases the value of the standing forest, thus counteracting the pressure to deforest.
Three policy implications arise from these results. First, new legislation or institutional arrangements are needed. Under the existing cleared land intensification technologies, new policies and institutional arrange-ments are needed to protect the forest, otherwise it will disappear. In the case of the forest management, administration procedures must be simplified to allow the activity. Before doing so, however, the Brazil-ian government will have to find (1) institutions and arrangements (probably from the contract theory liter-ature) that induce farmers to extract at the low-impact level that make the system sustainable, and (2) ways to monitor or have farmers monitor themselves. Oth-erwise the same incentives that make farmers deforest their farms will lead them to increase off-take, which may make the forest management system unsustain-able and short-lived. Taking away or restricting ex-traction rights can be better justified when something else is given in return. Investment in technologies and delivery systems that increase farmers’ income from the forest and the cleared land is one such justification. Second, researchers must return to the drawing board to design intensification technologies that in-crease farmers’ incomes as well as protect natural resources in the area. For example, if deforestation is a regional concern, EMBRAPA should use the potential impact of a particular line of research on deforestation as a criterion to decide whether or not to invest resources in it. Activities either on the cleared or forested lands demanding large amounts
of labor (especially during the felling season) and yet providing high return to labor should have a better chance to achieve this dual benefit (see Carpentier et al., 2000a,b, for examples with coffee and carbon sequestration activities).
Third, lending institutions such as The World Bank and other donors should fund only research and projects that can predict positive effects on both income and forest (instead of assuming that intensifi-cation will take pressure off the forest). They should also give priority to research leading to technologies that increase the value of the standing forest, such as the forest management simulation presented here.
Future work should incorporate general equilibrium and risk effects in the model to improve the domain under which the model results are valid. Also, other land-use decision-makers in the region, the large farm enterprises and the extractivists should be studied.
Acknowledgements
An earlier version of this paper was presented at the GCTE Focus 3 Conference at the Univer-sity of Reading, Reading, UK, 20–23 September 1999. This study was supported financially by the Inter-American Development Bank and the World Bank. The study also benefited greatly from techni-cal field data provided by Tamara Gomes, Claudenor Sa, Merle Faminow, and Samuel Oliveira, and from comments provided by participants in the Center for International Forestry Research workshop in agricul-tural intensification–deforestation links, by colleagues in the ASB program, and by participants at semi-nars held at the International Food Policy Research Institute, A. Henry, Wallace Institute for Alterna-tive Agriculture, EMBRAPA (at Headquarters, Acre, and Rondônia), and Department of Agricultural and Resource Economics, University of Maryland.
References
Angelsen, A., Kaimowitz, D., Holden, S., Smith, J., Vosti, S., 1999. Technological change and deforestation: definitions, theories, hypotheses and critical issues. Introductory Paper for the CIFOR Workshop on Technological Change in Tropical Agriculture and Deforestation. CATIE, Costa Rica, March 11–13, 1999. Barraclough, S.L., Ghimire, K.B., 1996. Forests and Livelihoods:
Countries. Co-produced with UN Research Institute for Social Development (Geneva). Macmillan, London.
Bilsborrow, R., Geores, M., 1994. Population, land-use, and the environment in developing countries: what can we learn from cross-national data? In: Pearce, D., Brown, K. (Eds.), The Causes of Tropical Deforestation: The Economic and Statistical Analysis of Factors Giving Rise to the Loss of Tropical Forests. University College London Press, London, pp. 106–133.
Bouman, B.A.M., Schipper, R.A., Nieuwenhuyse, A., Hengsdijk, H., Jansen, H.G.P., 1998. Quantifying economic and biophysical sustainability trade-offs in land-use exploration at the regional level: a case study for the Northern Atlantic Zone of Costa Rica. Ecol. Model. 114, 95–109.
Carpentier, C.L., Vosti, S.A., Witcover, J., 2000a. BrasilBEM: a household-farm bioeconomic model for the western Brazilian Amazonian forest margin. Discussion Paper. International Food Policy Research Institute, Environment and Production Technology Division, Washington, DC, in press.
Carpentier, C.L., Vosti, S.A., Witcover, J., 2000b. Small-scale farms in the western Brazilian Amazon: Can they benefit from carbon trade. Washington, DC: International Food Policy Research Institute. EPTD Discussion Paper No. 67, pp. 42.
Dale, V.H., O’Neill, R.V., Pedlowski, M., Southworth, F., 1993. Causes and effects of land-use change in central Rondônia, Brazil. Photogrammetry Eng. Remote Sensing 59 (6), 997– 1005.
de Araujo Borges, H.J., de Oliveira, L.C., 1996. Manejo florestal sustentado em areas de reserva legal de pequenas propriedades rurais do projeto de colonizacao Pedro Peixoto — Acre. Pesquisa em Andamento No. 89. EMBRAPA/Agroflorestal Acre, Rio Branco, Acre, Brazil.
de Oliveira Neves, M.V., Borges de Araujo, H.J., de Oliveira, L.C., 1996. Plano de manejo florestal em regime de rendimento sustentado. para 11. Lotes do Projeto de Colonizacao Pedro Peixoto. Ramais Nabor Junior e Granada. EMBRAPA/Agro-florestal Acre, Rio Branco, Acre, Brazil.
Faminow, M.D., Pinho de Sa, C., de Magalhaes Oliveira, S.J., 1996. Development of an investment model for the smallholder cattle sector in the western Amazon. MP-8 Mimeo. International Food Policy Research Institute, Washington, DC.
Gillison, A., 1999. Increasing the extrapolative power of ASB using DOMAIN. Presented at 91st Annual Meeting of American
Society of Agronomy, October 31–November 4, Salt Lake City, UT.
Hecht, S.B., 1984. Cattle ranching in Amazonia: political and ecological considerations. In: Schmink, M., Wood, C.H. (Eds.), Frontier Expansion in Amazonia. University of Florida Press, Gainesville, FL.
Kaimowitz, D., Angelsen, A., 1998. Economic models of tropical deforestation: a review. Center for International Forestry Research, Bogor, Indonesia.
Munoz Braz, E., de Magalhães de Oliveira, S.J., Carvalho dos Santos, J., Gonçalves Cordeiro, D., Franke, I.L., de Araújo Gomes, T.C., Correia da Costa, R.S., Mansur Mendes, Â., Borges de Araujo, H.J., Rodrigues, V., Rossi, L.M., Ferreira Valentim, J., Barros, E., Feigl, B., Pin Huang, S., Pinho de Sá, C., de Souza Moreira, F.M., Neves d’Oliveira, M.V., do Amaral, E., Carneiro, J., Vosti, S.A., Witcover, J., Carpentier, C.L., 1998. Relatório do Projeto Alternativas para a Agricultura de Derruba e Queima — ASB/Brasil-Fase II, Rio Branco, Acre, Brazil. Oliveira, M.A.G., Franco, C.B., Lima, F.S.C., 1999. Projeito Leite:
Diagnostico da Industria de Laticiniosdo Acre. SEBRAE, Rio Branco, Acre, Brazil.
Palm, C.A., Swift, M.J., Woomer, P.L., 1996. Soil biological dyna-mics in slash-and-burn agriculture. Agric. Ecosyst. Environ. 58, 61–74.
Valentim Ferreira, J., 1990. Impacto Ambiental da Pecuaria no Acre. Folio 2203. Documento base do Curso de Avaliacao do Impacto Ambiental da Pecuaria no Acre, 4 a 8 de dezembre 1989. EMBRAPA-UEPAE, Rio Branco, Acre, Brazil. Vosti, S.A., Reardon, T., 1997. Agricultural Sustainability, Growth,
and Poverty Alleviation: A Policy and Agroecological Pers-pective. Johns Hopkins University Press, Baltimore, MD. Vosti, S.A., Witcover, J., 1996. Slash-and-burn agriculture, a
household perspective. Agric. Ecosyst. Environ. 58, 23–38. Vosti, S.A., Witcover, J., Carpentier, C.L., 2001. Agricultural
inten-sification by smallholders in the western Brazilian Amazon: from deforestation to sustainable land use. Research Report. International Food Policy Research Institute, Environment and Production Technology Division, Washington, DC, in press. Witcover, J., Vosti, S.A., 1996. Alternatives to slash-and-burn