INTEGRATION OF GEO-SENSOR FEEDS AND EVENT CONSUMER SERVICES FOR
REAL-TIME REPRESENTATION OF IOT NODES
U.Isikdaga,*M.Piloukb
a Mimar Sinan Fine Arts University, Dept. of Informatics, Istanbul Turkey – [email protected] b ESRI,[email protected]
Commission IV WG IV/6
KEY WORDS: IoT, Sensor, GeoEvent, Real-Time, GIS
ABSTRACT:
More and more devices are starting to be connected to the Internet every day. Internet-of-Things (IoT) is known as an architecture where online devices have the ability to communicate and interact with each other in real-time. On the other hand, with the development of IoT related technologies information about devices (i.e. Things) can be acquired in real-time by the humans. The implementation of IoT related technologies requires new approaches to be investigated for novel system architectures. These architectures need to have 3 main abilities. The first one is the ability is to store and query information coming from millions of devices in real-time. The second one is the ability to interact with large number of devices seamlessly regardless of their hardware and their software platforms. The final one is the ability to visualise and present information coming from millions of sensors in real time. The paper provides an architectural approach and implementation tests for storage, exposition and presentation of large amounts of real-time geo-information coming from multiple IoT nodes (and sensors).
1. INTRODUCTION
Internet of Things (IoT) research has been a key priority for many domains in last 2-3 years. As stated in Moser et al (2014); Coetzee and Eksteen (2011) the concept behind IoT is not new and has been around for almost 25 years now, but wasn’t officially introduced in a proposal form until 1999. At those years although the concept of IoT was proposed, the internet was only accessible through the computers. Moser et al (2014) argued that when the population of Internet users started to grow and social media sites burst into popularity, it became an era of the Internet of People. The Internet of People has been supported by the social web, sites such as Twitter and Facebook enabled a huge number of humans to get notified about other’s states. In this approach a human became subscriber of other people who broadcast messages (to their subscribers). In the first phase, the Internet enabled computers to broadcast their current states to their subscribers, following this, in the second phase Internet enabled People to broadcast their current state. The third phase of the Internet is the era of the Internet of Things. In this era, similar to the previous phases the physical Things that are connected to the Internet broadcast their current states, to its subscribers who can be computers, individual persons or other physical Things. According to Zanella et al. (2014), Weber (2010), and Elkhodr et al. (2015) a primary aim of the Internet of Things (IoT) is to bring connectivity to every physical object.
It is argued that the Things to Things communications will change many processes ranging from supply chain management to e-health. It is indicated that currently, research on the IoT is aimed at facilitating and enabling the anticipated ubiquitous communications between things with minimal human interventions. In the very near future, societies and businesses
will shift from being interested in the IoT technologies to becoming more dependent on the IoT. The IoT applications are not only concerned with acquiring the information through sensors but also with actuating the physical things over the Internet. The combination of sensors and actuators with the ability of controlling them over the internet provides unique opportunities for automation of many tasks in Smart Cities. Rathore et al. (2016) and Zeng et al. (2011) stated that IoT empowers object’s capabilities of hearing, seeing, listening and communication. In turn, IoT transforms all objects from being traditional objects towards being smart objects by incorporating ubiquitous and pervasive computing. In the context of IoT embedded devices, communication technologies, sensor networks, Internet Protocols and applications revolutionize the way human beings communicate and manage the environment surrounding them. In the near future billions of smart devices will be communicating with each other and also will be responding to request coming from other devices.
Two buzzwords of this new era is IoT and Smart, which are usually pronounced together. Internet of Things will help people in making their world smarter. The IoT paradigm will be realized by the integration of sensor and actuators to everyday objects. These sensors will be able to provide information about the objects, while the actuators will be used for taking actions. For example, the information acquired from the sensors can range from temperature to sound level, while actuators can control limitless number of objects where they can help a car drive by itself or help a gate door become open or shut. The IoT architecture will form the backbone of the Smart Cities and Smart Buildings and Smart Living Style. In addition, information that would be collected from the connected
“Things” will form the core of the Big Data. The analysis of this
Big Data also provides limitless opportunities.
On the other hand, in the context of Smart Cities and Smart Buildings the role of Geoinformation and Location Based Services is also unique. In other words, information with a
“Geo” dimension will have a key importance for many Location
Based Processes and Services.
The research elaborated in this paper proposes an architecture for facilitating real-time information acquisition from IoT Nodes Geo-Sensor Feeds and presentation of this information using web services. The architecture is unique as it makes use of Graph Databases for storage and dissemination of Geoinformation. The backbone of the architecture is formed by RESTful web services which are interacting with graph databases, while the presentation layer is formed by Event Consumer Services (which also act as the mash-up tool). The database layer of the architecture is formed by the Neo4J graph database and Neo4J Spatial, the RESTful web services are Geoinformation and IoT architectures in enabling smart cities and buildings. The paper later provides the details of the integration architecture proposed and tested for the integration of geo-sensor feeds and event consumer web services for provision of real time sensor information over the web.
2. BACKGROUND
The realization of the IoT paradigm has dramatically changed the research trends related to Smart Cities and Smart Buildings. In addition, methods for acquisition of real time Geoinformation are also affected from the IoT paradigm. Zhou and Zhang (2011) stated that Internet of Things perceive and collect attribute and spatial information of geographic environment through sensors equipped into power grid, railways, bridges, tunnels and other objects. In this integrated network, a computer cluster will have ability to manage and control personnel, machinery, equipment, and infrastructure in real time. Zhou and Zhang (2011) also mentioned that Internet of Things make physical world ‘talk’ to people initiatively, so human ability of perceiving environment enhance greatly and
‘interactive’ features between behaviour and the environment is prominent. For example, in Internet of Things era, visitors of a city can choose and design route in scenic spot by obtaining information from Internet of Things. In addition, authors express that Internet of Things brings a new round of changes in urban space. Urban transport, housing, work and leisure functions, the interaction of urban space, location freedom, and urban renewal will be significantly affected by the implementation of IoT elements in cities. It is already accepted by many researchers that the IoT architecture would have a key role in helping Smart Cities become a reality. Cuff et al (2008) and Zanella et al. (2014) indicated that although there is not yet a formal and widely accepted definition of “Smart City,” the final aim in the Smart City approach is to make a better use of the public resources, increasing the quality of the services offered to the citizens, while reducing the operational costs of the public administrations. This objective can be pursued by the deployment of an urban IoT unleashing potential synergies and increasing transparency to the citizens. An urban IoT, indeed,
may bring a number of benefits in the management and optimization of traditional public services, such as transport and parking, lighting, surveillance and maintenance of public areas, preservation of cultural heritage, and so on. The authors suggest that the availability of different types of data may also be exploited to increase the transparency and promote the actions of the local government toward the citizens, enhance the awareness of people about the status of their city, stimulate the active participation of the citizens in the management of public administration. Cenedese et al. (2014) stated that the aim of the Smart City paradigm is to make a better use of the public resources, increase the quality of the services offered to the citizens and, in turn, the quality of life in the urban areas, while reducing the operational costs of the public administrations. The concept covers Smart Governance, Smart Mobility, Smart Utilities, Smart Buildings, and Smart Environment concepts. The authors mentioned that public administrators can take pioneer roles in adoption of these concepts, with the vision of seamless integration. Their view of IoT is towards realization of a unified urban-scale ICT platform, thus unleashing the potential of the Smart City vision. In this vision IoT can enable easy access and interaction with a wide variety of devices such as, for instance, home appliances, surveillance cameras, monitoring sensors, actuators, displays, vehicles, and so on. The enormous amount of data generated by IoT elements will then foster the development of new services. Zanella et al. (2014) provided a classification of services in different domains when combined will form the infrastructure of a Smart City. The services in the classification of Zanella et al.(2014) are as follows:
Structural Health of Buildings: The urban IoT may provide a distributed database of building structural integrity measurements, collected by suitable sensors located in the buildings, such as vibration and deformation sensors to monitor the building stress, atmospheric agent sensors in the surrounding areas to monitor pollution levels, and temperature and humidity sensors
Waste Management: The use of intelligent waste containers, which detect the level of load and allow for an optimization of the collector trucks route, can reduce the cost of waste collection and improve the quality of recycling
Air Quality: IoT can provide means to monitor the quality of the air in crowded areas, parks, or fitness trails.
Noise Monitoring: IoT can offer a noise monitoring service to measure the amount of noise produced at any given hour in the places that adopt the service
Traffic Congestion: Traffic monitoring may be realized by using the sensing capabilities and GPS installed on modern vehicles and also adopting a combination of air quality and acoustic sensors along a given road.
City Energy Consumption: IoT may provide a service to monitor the energy consumption of the whole city, thus enabling authorities and citizens to get a clear and detailed view of the amount of energy required.
Smart Parking: This service is based on road sensors and intelligent displays that direct motorists along the best path for parking in the city.
Smart Lighting: The service can optimize the street lamp intensity according to the time of the day, the weather condition, and the presence of people.
Automation and Salubrity of Public Buildings: This service is responsible for the monitoring of the energy consumption and the salubrity of the environment in public buildings by means of different types of sensors and actuators that control lights, temperature, and humidity.
Burange and Mislalkar (2015) provided another classification for smart city elements as: Smart Parking, Structural health, Noise Urban Maps, Traffic overcrowding, Smart Illumination, Squander Management, and Intelligent Transportation Systems Several research projects have worked on for realization of the Smart City idea. As explained by Gyrard and Serrano (2015) the READY4SmartCities4 project aimed at reducing energy consumption and CO2 emission in smart cities exploiting ontologies and linked data. The STAR-CITY project is deployed in four cities: Dublin, Bologna, Miami and Rio. Project uses semantic web technologies to diagnose and predict road traffic congestions. The CityPulse project defines 101 scenarios such as public parking space availability prediction, real time travel planner, air pollution countermeasures, what is my route and efficient public transport. The SmartSantander project deployed 20,000 sensors in six cities (Santander, Melbourne, Lubeck, Guildford, Belgrade and Arhus) for measuring temperature, humidity, particle, CO, NO2 or for monitoring parks and gardens irrigation, for outdoor parking area management and traffic intensity monitoring. Jin et al. (2014) reports a noise mapping IoT architecture based on SmartSantander. The IoT architecture contained both fixed and mobile infrastructure IoT elements. Fixed infrastructure was a realization of WSN in urban sensing. The mobile infrastructure included the scope for sensors mounted on vehicles, mobile phones, and other handheld devices. Bonino et al. (2015) mentioned that the ALMANAC project, funded by the European Commission, aimed at designing and developing an innovative service delivery platform, with corresponding technology solutions, that integrates typical Internet of Things (IoT) edge networks (termed as capillary networks) with metropolitan networks thus enabling an integrated Smart City Information System for green and sustainable applications. The IoT architecture implemented included Cloud Based (APIs) including WebSocket and RESTful APIs, Virtualization Layer, Data Management Framework, Transport Layer (HTTP-MQTT), and finally a SmartCity Resources Adaptation layer (REST APIs, Drivers to Low Level Device Interfaces). Suciu et al (2013) indicated that a Smart City scenario requires integrating an open sensor network and decentralized cloud-based platform with the following characteristics: i.) Ability to virtualize location dependent entities, such as sensors and IoT services. ii.) Privacy friendliness on the basis of inherence capabilities for handling and transferring private data. iii.) Support for real-time interactions. iv.) Real-time visualization of IoT services on the basis of models that will enable ambient multimodal interactivity between end-users, IoT services the devices that the latter comprise. v.) Self-optimization of the cloud infrastructure not only in terms of the cloud computing resources, but also in terms of the IoT resources (sensor streams, sensor I/O cycles, distributed multi-sensor queries) that it comprises.
Smart Buildings and Smart Home are the concepts that focuses on the realization of IoT paradigm in micro urban spaces. The research related to Smart Buildings and Smart Home concentrate on taking the traditional home automation efforts to the next level with main focus of enabling energy efficiency in living spaces. Makinen (2014) explained that home automation in general is the working together of various appliances in houses and influencing air conditioning, light, several safety features and other house conditions. The home automation itself started to rapidly develop during the 1980’s. The variety of sectors and their improvements make the home automation as an innovation discontinuous in nature which is dependent to all the sectors and their improvements which are driven by both market demand and technological evolution. Soliman et al.
(2013) proposed a smart home architecture consists of i.) Microcontroller-enabled sensors to measure home conditions; the microcontroller interprets and processes the instrumented data. ii.) Microcontroller-enabled actuators: receives commands transferred by the microcontroller for performing certain actions. The commands are issued based on the interaction between the microcontroller and Cloud services. iii.) Database/Data Store: stores data from microcontroller-enabled sensors and Cloud services for data analysis and visualization, and serves as command queue being sent to actuators as well. iv.) Server/API layer between the back end and the front end: facilitates processing the data received from the sensors and storing the data in database. It also receives commands from the web application client to control the actuators and stores the commands in database. The actuators make requests to consume the commands in the database through the serer. v.) Web application serving as Cloud services: enable to measure and visualize sensor data, and control devices using a mobile device (e.g., smart phone). Pan et al. (2015) mentioned that the research related to Smart Homes can be categorized into 3 key aspects as i.) Energy monitoring: Through communication networks, the consumption and generation of energy are monitored and logged in different granularities including the whole building, floors, departments, labs, rooms, and even occupants. ii.) Energy modeling and evaluation: Through offline modeling and evaluation, the energy consumption patterns and factors that may influence the consumption and the extent of their impact are identified. iii.) IoT system to apply practical changes and strategy adjustments: The modeling and evaluation results are used to identify the key energy components of the building, to apply adjustments, and to devise strategies to reduce energy consumption. IoT-based networking system is designed and prototyped to realize the strategies and achieve the goal. The researcher also worked on facilitating the interoperability at Smart Homes in semantic level. For example, Sezer et al. (2015) focused on defining a semantic sensor network ontology for smart homes and the implementation of a semantic sensor network simulator for home automation. As mentioned by Jung et al. (2012), once building automation devices become accessible in the Internet the doors to several, previously not realizable, use case scenarios are opened. The following list provides some example scenarios:
Device Maintenance: In an interconnected IoT it becomes possible that the devices themselves notify the device supplier, send a spare part order to the ERP system of the vendor or even arrange a service appointment with a technician.
Smart Grids and Energy Efficiency: IoT architecture can function as an enabler for solutions that allow to realize the smart grid. In an example scenario, when all persons leave a room, many devices can be switched off automatically. Likewise, if the online calendar indicates a two week vacation the whole building can enter a kind of sleep mode, which means that all devices are switched off instead of residing in standby mode.
Buildings integrated into business processes: For example, in the case of a conference centre, the building itself is a vital part of the business process. One idea to achieve better control of it is to determine an exact occupancy of people in real-time and adjust the control parameters accordingly. This can be achieved, for example, by persons identifying themselves with access cards containing RFID chips. It is possible to save considerable amounts of cooling or heating energy in any room that will not be occupied within the next hours in such buildings. Smart energy meters will also help in monitoring the energy consumption in Smart Homes. For example, Ożadowicz and Grela (2015) proposed a universal energy meter as an IoT The International Archives of the Photogrammetry, Remote Sensing and Spatial Information Sciences, Volume XLI-B4, 2016
platform module with logical device interface. Functionality of the energy meter has been implemented by a universal Energy Meter functional profile that was developed. The meter supports two main functions: energy meter and data logger. Microlocation (i.e. the process of locating moving objects in micro spaces such as buildings) together with IoT architecture implementations will facilitate several processes in Smart Buildings. Zafari et al. (2016) explained that microlocation is the process of locating any entity with a very high accuracy (possibly in centimetres), whereas geofencing is the process of creating a virtual fence around a point of interest (PoI). The authors argued that microlocation-based location aware solutions will enable the smart building control system through minimal actions performed by the tenants. Bing et al (2011) indicated that there exist some drawbacks for the current smart home systems. First of all, the comfort, leisure, healthcare or monitoring functions of smart homes are implemented by different independent sub systems which are very difficult or impossible to be integrated as a whole. Secondly, once the requirements of users are changed, the design of a smart home system must be changed accordingly. Therefore, the capability of portability of current smart home systems is poor. Furthermore, the current smart home systems are high dependent on personal computers, because they use the home personal computer as gateway for connection between home network and the remote management platform. So it is inconvenient for updating and maintenance. The authors state that the rapid development of IoT related technologies will provide solutions to these problems by integration of information, telecommunication, entertainment, and living systems for supporting centralized control by communication between the home network and Internet (3G or Ethernet).
3. INTEGRATION ARCHITECTURE
Smart Cities and Smart Homes will benefit from integration of IoT Nodes with other information systems through the web services. In this paper we propose an architecture for facilitating real-time information acquisition from IoT Nodes Geo-Sensor Feeds and presentation of this information using web services. This section will focus on the details of the architecture of the integration.
3.1 Enabling Technologies
The service based architecture developed for the integration of geo-sensor feeds with event consumer services is composed of several different software components. A graph database forms the data storage environment, while data stored in the graph database is presented through a RESTful interface in the form of a GeoJSON feed. The information provided by the RESTful services (i.e. the GeoJSON feed) is then consumed by ESRI GeoEvent Extension. The technologies that enable this integration will be elaborated in the following sections.
3.2 Graph Databases and Neo4J
Graph Databases has many advantages when compared with standard SQL and NoSQL databases. Robinson et al. (2015) indicated that a graph database management system (i.e. a graph database) is an online database management system with Create, Read, Update, and Delete (CRUD) methods that expose a graph data model. Robinson et al. (2015) mentions following characteristics of graph databases provide several advantages as:
Performance: One compelling reason for choosing a graph database is the sheer performance increase when dealing with connected data versus relational databases and NOSQL stores. Flexibility: As developers and data architects, we want to connect data as the domain dictates, thereby allowing structure and schema to emerge in tandem with our growing understanding of the problem space, rather than being imposed upfront, when we know least about the real shape and intricacies of the data. Graph databases address this issue directly.
Agility: The schema-free nature of the graph data model, coupled with the testable nature of a graph database’s application programming interface (API) and query language, empower us to evolve an application in a controlled manner. Neo4J is the most commonly known and implemented graph database. Neo4J is a highly scalable native graph database which leverages data relationships as first-class entities, helping in building up intelligent applications.
3.3 RESTFul Services
The terms REST and RESTful web services have been coined after the PhD dissertation of Roy Fielding (Fielding, 2000). As explained by Pautasso (2008), REST was originally introduced as an architectural style for building large-scale distributed hypermedia systems. According to REST style, a web service can be built upon resources (i.e. anything that is available digitally over the web), their names (identified by uniform indicators, i.e. URIs) representations (i.e. metadata/data on the current state of the resource) and links between the representations. As mentioned by the Techtarget (2015), REST is often preferred over the more heavyweight SOAP (Simple Object Access Protocol) style because REST does not leverage as much bandwidth. REST is often used in mobile applications, social networking Web sites, mash up tools, and automated business processes.
In a RESTful architecture RESOURCES, REPRESENTATIONS and IDENTIFIERS can be described as below
• A RESOURCE can have multiple representations but a single IDENTIFIER which can only point to a single REPRESENTATION of a RESOURCE at a single point in time.
Once a RESOURCE is created in a RESTful architecture it is constant until it has got DELETEd. The variability is on the REPRESENTATION, as the REPRESENTATION can be UPDATEd using the HTTP protocol methods. The acronym REST stands for REpresentational State Transfer. In a RESTful architecture a REPRESENTATION existent in one STATE of a RESOURCE is TRANSFERRED to a web client and this causes the change of the STATE of the web client.
3.4 GeoJSON
As stated in GeoJSON Format Specification (2016) GeoJSON is a format for encoding a variety of geographic data structures in form of JSON (JavaScript Object Notation) objects. The GeoJSON format is a widely used format to represent The International Archives of the Photogrammetry, Remote Sensing and Spatial Information Sciences, Volume XLI-B4, 2016
geoinformation over the web. A GeoJSON object may represent a geometry, a feature, or a collection of features. GeoJSON supports the representation of the following geometry types: Point, LineString, Polygon, MultiPoint, MultiLineString, MultiPolygon, and GeometryCollection. Features in GeoJSON contain a geometry object and additional properties, and a feature collection represents a list of features. Figure 1 below provides a code excerpt from a GeoJSON representation. A point, line and a polygon feature is represented in this code excerpt.
Figure 1: Sample GeoJSON Code
3.5 ESRI GeoEvent Extension
As mentioned by ESRI Web Site (2016) ArcGIS GeoEvent Extension for Server can be used to connect with virtually any type of streaming data feed. GeoEvent Extension includes connectors for common data streams including in-vehicle GPS devices, mobile devices, and social media providers. The aim of the GeoEvent services is to detect and focus on the most important events, locations, and thresholds for operations. GeoEvent Extension accommodates multiple streams of data flowing continuously through filters and processing steps that one can define. The extension can be used to track assets on an online map. GeoEvent Extension can be used to track dynamic assets that are constantly changing location (such as vehicles, aircraft, or vessels), or stationary assets, such as weather and environmental monitoring stations. GeoEvent services can be used to automatically and simultaneously send alerts to key personnel, update the map, append the database, and interact with other enterprise systems when locations of objects change or specified criteria are met. Alerts can be sent across multiple channels, such as e-mails, texts, and instant messages.
3.6 Integration Architecture
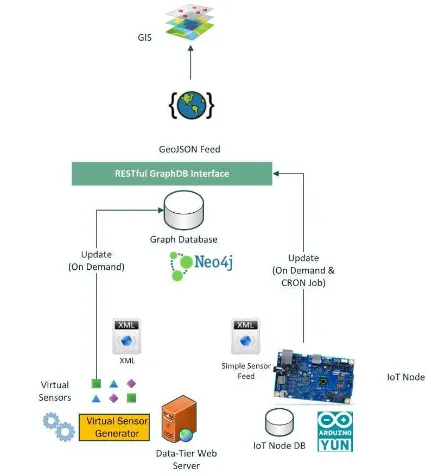
The integration architecture is composed of 4 layers (Fig.2).
Figure 2. Integration Architecture Components
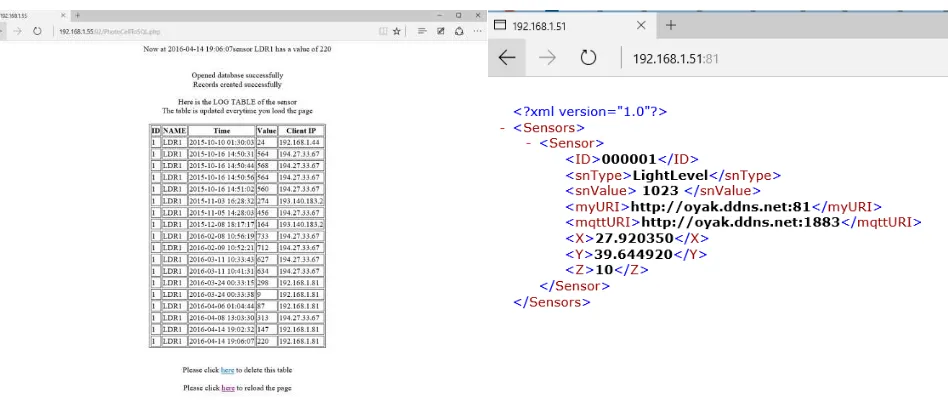
The first layer of the architecture is the IoT Node Layer. The IoT Node Layer is composed of hard and soft IoT Nodes. The hard IoT nodes are formed by Arduino Yun Hardware which contains a Linux based OpenWRT operating system. This IoT node contains sensors to measure light levels within the environment. In the first stage, Arduino Level code is developed and implemented and stored in the microcontroller which presents a web page where the light value is displayed in real-time (Fig. 3)
Figure 3. Web Page Showing the Light Value (Arduino YUN)
In the second stage the OpenWRT Web Server uHTTPd, PHP Language Components and SQLite Database (IoT Node DB) is deployed on the IoT node. In the next phase a component is developed in PHP language when invoked (or called) reads the light value from the web page produced by the Yun microcontroller and stores it in the SQLite database in Yun, and then presents the results on a web page at stored at Yun. The web page showing the light values stored in SQLite DB in Yun is shown in Figure 4.
{ "type": "FeatureCollection", "features": [
{ "type": "Feature",
"geometry": {"type": "Point", "coordinates": [102.0, 0.5]},
"properties": {"prop0": "value0"} },
{ "type": "Feature", "geometry": { "type": "LineString", "coordinates": [
[102.0, 0.0], [103.0, 1.0], [104.0, 0.0], [105.0, 1.0] ]
},
"properties": { "prop0": "value0", "prop1": 0.0 }
},
{ "type": "Feature", "geometry": { "type": "Polygon", "coordinates": [
[ [100.0, 0.0], [101.0, 0.0], [101.0, 1.0], [100.0, 1.0], [100.0, 0.0] ]
] },
"properties": { "prop0": "value0", "prop1": {"this": "that"} }
} ] }
Figure 4. SQLite Query Result showing Light Levels (at Arduino Yun).
In the next stage another component is developed in PHP and implemented at the Arduino (Genuino) Yun Hardware to update the Neo4J Graph Database when invoked. In order to invoke this (updater) component and in order to empty the Neo4J database on certain intervals a Linux CRON job is created and implemented in OpenWRT system of Arduino Yun. The updater component makes use of RESTful GraphDB (Neo4J) RESTful interface to update the database which resides in the cloud. The list below provides the code for this CRON job working in Arduino Yun.
#min hour day month dayofweek command
#*/1 * * * * /mnt/sda1/www/neo_live_from_arduino.php
#Work at every 20 minutes
*/20 * * * * /usr/bin/curl http://localhost:82/neo_live_from_arduino.php
#Work at 11:10 every day
10 11 * * * /usr/bin/curl http://umitwin.ddns.net/tests/php/sensorsvirtual/neo_deleteAll.php
The hard nodes of the architecture also contain Arduino (Genuino) UNO components. In these components Arduino Level code is developed and implemented and stored in the microcontroller which presents an XML page, where the light level is displayed in form of a XML Simple Sensor Feed (see. Fig. 5). This feed also provides a pre-determined geo-location of the IoT Node (X value showing the Northing in WGS 84 while Y value is showing the Easting in WGS W84).
Figure 5: Simple Sensor Feed from Arduino (Genuino) UNO
The soft components of the sensor layer are the virtual IoT nodes and values of virtual sensors which are generated synthetically. In order to generate these virtual IoTnodes an Amazon Cloud AWS machine is deployed and acted as a web server. The web server software that is deployed is a WAMP (Windows-Apache-MySQL-PHP) package. A series of PHP components were developed and implemented in order to generate the virtual IoT Nodes (i.e. virtual boards) and virtual sensor values. The generator components are able to generate any number of virtual IoT nodes in a given bounding box (which is defined with Lat/Lon values). A sample call to the virtual IoT node generator component is as follows:
http://..../sensorsvirtual/generate.php?latmin=39.55&latmax=41 &lonmin=28.58&lonmax=32.50
The sensor values in these virtual boards are then stored in form of XML files. In this implementation the authors limited the number of boards to be generated as 100, and number of virtual sensors to be generated for each board as 100. The types and values of sensors on these boards are randomly generated. Figure 6 presents an excerpt from the XML representation of virtual sensor values for a selected virtual IoT Node (i.e. virtual sensor board).
Figure 6. XML Representation of Sensors in Virtual Nodes The International Archives of the Photogrammetry, Remote Sensing and Spatial Information Sciences, Volume XLI-B4, 2016
The second layer of the architecture is formed by the Neo4J Graph Database. The Neo4J graph database is deployed on an Amazon Cloud AWS machine. In order to store spatial data on the Neo4J database “Spatial” component of the Neo4J are deployed following the deployment of the database. Once the database and the spatial DB component is deployed, the (Yun based) CRON job mentioned earlier is used to generate the graph database entities (i.e. features in the database). The Figure 7 below presents the visualisation of entities (i.e. geodata) residing in Neo4J, with the native visualisation environment of the graph database.
Figure 7: Representation of information stored in Neo4J
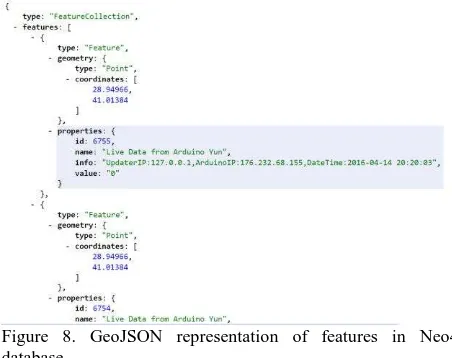
The third layer of the integration architecture consists of components developed to generate GeoJSON representation of features residing in the Neo4J Graph database. These components query the database on demand and generate GeoJSON representation of the features in order present real time information regarding the states and the values of the sensors. An excerpt from this GeoJSON representation is provided in Figure 8.
Figure 8. GeoJSON representation of features in Neo4J database
The fourth layer of the integration architecture is formed by ESRI ArcGIS Server GeoEvent Extension. The extension is deployed as a part of an ArcGIS Server deployment in a cloud environment. In order to test the capabilities of the integrated architecture, the GeoJSON representation of the features is provided to the ESRI ArcGIS Server GeoEvent Extension, which was successful in acquiring this information in form of GeoJSON and represent this information in an ArcGIS Webmap. The final results of this integration experiment is provided in Figure 9, where real-time information coming from real and virtual IoT nodes is acquired with event consumer services and represented in the form of a WebMap.
Figure 9: Representation of real-time information acquired from IoT Nodes in ArcGIS WebMap.
4. CONCLUSIONS
The paper presented an architecture for facilitating real-time information acquisition from geo-Sensor Feeds and acquisition / presentation of this information using web services. The use of Graph Databases for storage and dissemination of Geoinformation makes it a unique architecture. The presentation layer is formed by GeoEvent Services which are used to acquire information from XML and GeoJSON documents and publish them in web maps. The architecture described is tested with a few real-life and many virtual sensors. The integration experiment is designed and realised in 4 layers. The first layer consisted of real and virtual IoT nodes, the second layer is formed by a well-known graph database i.e. Neo4J. In the third layer of the architecture the soft components developed helped the acquisition of information from the graph database and representation of this information in form of GeoJSON. The fourth layer of the architecture is formed by GeoEvent service which is capable of consuming GeoJSON feeds and representing the information provided by IoT nodes in real-time. The experiment proved the concepts of i.) use of graph databases to store geo-sensor feeds and ii.) representation of information acquired from graph databases in form of GeoJSON feeds and iii.) representation of real-time information acquired from IoT nodes in web maps by utilizing multi-layer integration architectures. The future research will focus on implementing the architecture in a larger scale environment.
REFERENCES
Bing,K., Fu,L., Zhuo,Y.,Yanlei,L. (2011) Design of an Internet of Things-based Smart Home System, IEEE 2nd International Conference on Intelligent Control and Information Processing
Bonino,D., Alizo, M. T. D., Alapetite, A. Gilbert,T., Axling,M., Udsen,H., Soto, J.A.C, Spirito,M. (2015) ALMANAC: Internet of Things for Smart Cities, IEEE 3rd International Conference on Future Internet of Things and Cloud
Burange A.W, Misalkar, H.D. (2015) Review of Internet of Things in Development of Smart Cities with Data Management & Privacy, International Conference on Advances in Computer Engineering and Application (ICACEA), IMS Engineering College Ghaziabad, India
Cenedese, A., Zanella, A., Vangelista, L., Zorzi, M. (2014) Padova Smart City: an Urban Internet of Things Experimentation, IEEE World of Wireless, Mobile and Multimedia Networks Conference (WoWMoM)
Coetzee L., Eksteen,J. (2011) “The internet of things-promise
for the future? ”, IEEE IST-Africa Conference Proceedings, pp. 1–9.
Cuff, D., Hansen, M., Kang, J. (2008) Urban sensing: Out of the woods, Communications of ACM, Vol. 51, No. 3, pp. 24–33.
Elkhodr, M., Shahrestani,S. Cheung,H. (2015) A Smart Home Application based on the Internet of Things Management Platform, IEEE International Conference on Data Science and Data Intensive Systems
ESRI Web Site (2016) Geo Event Extension, Available online at:http://www.esri.com/software/arcgis/arcgisserver/extensions/ geoevent-extension
Fielding, R. T. (2000). “Architectural styles and the design of
network-based software architectures.” PhD Thesis. Dept. of Information and Computer Science, University of California, Irvine.
GeoJson Format Specification (2016) Available online at http://geojson.org/geojson-spec.html
Gyrard, A., Serrano, M. (2015) A Unified Semantic Engine for Internet of Things and Smart Cities: From Sensor Data to End-Users Applications, IEEE International Conference on Data Science and Data Intensive Systems
Jung, M., Reinisch, C., Kastner, W. (2012) Integrating Building Automation Systems and IPv6 in the Internet of Things, Sixth International Conference on Innovative Mobile and Internet Services in Ubiquitous Computing
Makinen,S.J. (2014) Internet-of-things Disrupting Business Ecosystems: A Case in Home Automation, IEEE International Conference on Industrial Engineering and Engineering Management (IEEM)
Moser, K, Harder,J, Koo,S.G.M.(2014) Internet of Things in Home Automation and Energy Efficient Smart Home Technologies, IEEE International Conference on Systems, Man, and Cybernetics, October 5-8, 2014, San Diego, CA, USA
Ożadowicz, A., Grela, J. (2015) Control Application for Internet of Things Energy Meter - a Key Part of Integrated Building Energy Management System, IEEE 20th Conference on Emerging Technologies & Factory Automation (ETFA)
Pan,J. Jain,R.., Paul,S.,Vu,T., Saifullah,A., Sha,M.(2015) An Internet of Things Framework for Smart Energy in Buildings: Designs, Prototype, and Experiments, IEEE Internet of Things Journal, Vol.2, No.6, p. 527
Pautasso,C., Zimmermann,O. and Leymann,F. (2008) “Restful web services vs. "big"' web services: making the right
architectural decision” WWW '08: Proceeding of the 17th
international conference on World Wide Web, pp.805-814
Rathore, M.M., Paul, A., Ahmad, A., Rho, S. (2016) Urban planning and building smart cities based on the Internet of
Things using Big Data analytics, Computer Networks, Article in Press, doi:10.1016/j.comnet.2015.12.023
Robinson, I., Webber, J., Eifrem E. (2015) Graph Databases
2nd Edition, O’Reilly Press, 2015
Sezer,O.B., Can,S.Z., Dogdu,E.(2015) Development of a Smart Home Ontology andThe Implementation of A Semantic Sensor Network Simulator: An Internet of Things Approach, IEEE International Conference on Collaboration Technologies and Systems (CTS)
Soliman, M.,Abiodun,T.,Hamouda,T., Zhou,J., Lung,C-H. (2013) Smart Home: Integrating Internet of Things with Web Services and Cloud Computing, IEEE International Conference on Cloud Computing Technology and Science
Suciu,G., Vulpe,A., Halunga,S.,Fratu,O., Todoran,G., SuciuV. (2013) Smart Cities Built on Resilient Cloud Computing and Secure Internet of Things, IEEE 19th International Conference on Control Systems and Computer Science
Techtarget (2015) Definition of REST available at : http://searchsoa.techtarget.com /definition/REST
Weber, R. H. (2010) Internet of Things–New security and privacy challenges, Computer Law & Security Review, Vol. 26, pp.23-30
Zafari, F., Papapanagiotou, I., Christidis, K. (2016) Microlocation for Internet-of-Things-Equipped Smart Buildings, IEEE Internet of Things Journal, Vol.3., No.1
Zanella, A. Bui, N. Castellani, A. P. Vangelista, L. Zorzi, M., (2014) Internet of things for smart cities, IEEE Internet of Things Journal, Vol. 1, pp. 22-32, 2014.
Zeng, D., Guo, S. Cheng, Z. (2011) The web of things: A survey, Journal of Communications, Vol.6 No.6 pp. 424–438.
Zhou, Q., Zhang, J. (2011) Research Prospect of Internet of Things Geography, IEEE 19th International Conference on Geoinformatics