R
R
URAL
URAL
E
E
C O NO MY
C O NO MY
The Effect of Choice Environment and Task Demands on Consumer Behavior: Discriminating Between Contribution and Confusion
Joffre Swait and Wiktor Adamowicz
Staff Paper 96-09
Sta ff Pa p e r
Department of Rural Economy
Faculty of Agriculture & Forestry,
and Home Economics
The Effect of Choice Environment and Task Demands on Consumer Behavior: Discriminating Between Contribution and Confusion
Joffre Swait and Wiktor Adamowicz
Staff Paper 96-09
The authors are, respectively, Assistant Professor, Department of Marketing, University of Florida and Professor, Department of Rural Economy, University of Alberta.
The Effect of Choice Environment and Task Demands on Consumer Behavior: Discriminating Between Contribution and Confusion
1. INTRODUCTION
Choices, whether they are made in actual markets (revealed preference or RP) or in surveys (stated
preference or SP), provide information about the preferences of individuals. These choices also contain
what researchers interpret as “noise” or unexplained variation; a variety of techniques (e.g. statistical
design theory, econometric specifications, and the combination of stated and revealed preference data) have
been used to understand preferences and separate the signal from noise. However, in applying these tools
we have tended to focus on the information provided by the choices themselves, to the detriment of
understanding the effect of the choice environment or the task demands on the observed choice behavior,
the quality of the information provided, and noise levels.
Task demands (or the choice environment)1 can be characterized by such factors as choice set size (the number of alternatives the individual is choosing from), the number of attributes under consideration
within alternatives in a choice set, the correlation structure of the attributes of the alternatives in the choice
set, the number of and sequence of choices the individual is asked to make during the “task”, as well as a
variety of other factors. While the definition of the choice set, and the implications of choice set definitions
on empirical results (Swait and Ben-Akiva, 1987a,b), has received some attention in the literature, there
has been little attention paid to the characterization of the choice set or other dimensions of task demands.
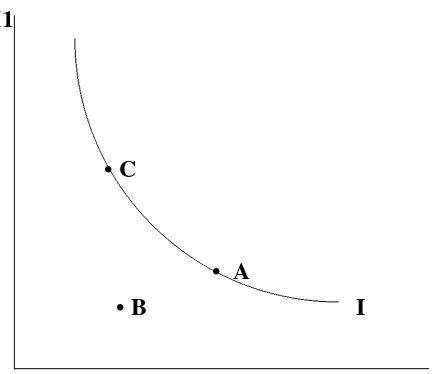
Task complexity is illustrated by Figure 1, in which an individual is presented with alternatives
(A,B, and C) in attribute space (X1,X2). One of the individual’s indifference curves is depicted as I. If
1
the individual is asked to choose between A and B it is clear that A dominates B and the demands on the
individual, in terms of choice complexity, are relatively low. Situations that force consumers to make
tradeoffs, like choosing between A and C, are more challenging and reveal more information about
preferences, albeit imposing greater cognitive demands on the individual. Will the variance or noise
associated with choice be increased in this case? Will the respondent use different strategies when choosing
from the set {A,B} versus the set {A,C}?
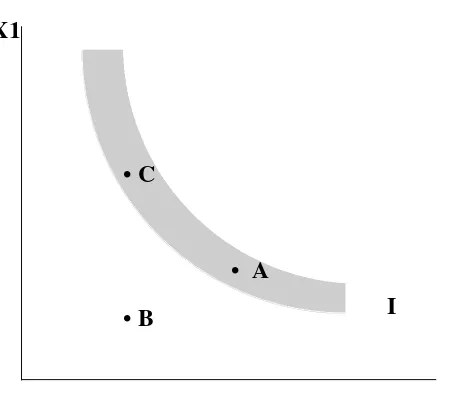
Consider the case illustrated in Figure 2 in which preferences, illustrated as the shaded indifference
area, are depicted as being “uncertain.” In this case the impact of task demands may be even greater. The
uncertainty about preferences can be exacerbated by task demands and may result in less consistency in
choice, leading to higher variance in statistical models. Characterizing complexity or task demand and
incorporating it into statistical models may aid in our understanding of choice and help us design tasks that
provide more information and less noise.
This paper presents an analysis of context effects on choice in the same tradition as Heiner (1983),
who investigated the processing capacity of consumers. We characterize task demands and incorporate
them into random utility models of choice. We describe task demands using entropy, a well-known
information theoretic measure which provides a summary measure of the uncertainty inherent in the choice
environment. We model choice as a function of attributes in a traditional compensatory model but include
our summary measure of task complexity in the variance term of the model. Both entropy and cumulative
entropy are included in the model to account for the fact that task demands are partly defined by the current
choice set, and partly by prior effort expended (which we term “cumulative cognitive burden”). We use this
model to examine choice data from a number of contexts. It is worth noting that in such a model
elasticities are now made up of two components: a direct effect through the impact on utility and an indirect
effect through the impact on complexity.
Our results indicate that task complexity significantly affects the variance of choice in a fashion
that is consistent with notions of limited consumer processing capacity and cognitive budgets. Employing
six case studies that examine choice within very different product classes, we find that complexity affects
choice behavior. Furthermore, we find that pooling across the six cases, we cannot reject the null
hypothesis that complexity affects these very different choice processes in a similar fashion. This is an
interesting finding suggesting a generalizability of our formulation over a variety of product classes. We
also find some evidence of fatigue and learning effects in the different case studies, although the cumulative
effects are not as systematic as the direct impacts of complexity on choice.
We begin the paper with a brief review of the literature on task complexity and choice, then outline
several possible measures of complexity. We next expound on our chosen measure of complexity, entropy,
as a form of characterizing task demands. A statistical modeling approach, that includes entropy in the
variance function, is presented in Section 3. Examples using choice data from different situations are then
examined in Section 4. The paper concludes with a discussion of the implications of our findings and
future research topics.
2. COMPLEXITY AND CHOICE
2.1 Task Environment, Respondent Processing Ability and Choice Outcomes
A variety of authors in the economics literature have discussed the limitations of an individual’s
ability to process information and the implications of these limitations on choice behavior. Much of this
literature relates to choices under uncertainty (e.g. difficulty in evaluating risks, ambiguity or lack of
information about the risks, and difficulty in decision making under risk). Uncertainty about the attributes
of options often plays a role in explaining limitations of human processing capability. For example, Heiner
(1983) argues that agents cannot decipher the complexity of the situations they face and thus make
decisions that appear to be sub-optimal. He argues that the complexity and uncertainty surrounding a
choice situation often leads consumers to adopt simplified strategies. Heiner suggests that more effort
should be expended to understand the role that complexity plays in choice behavior.
A more formal examination of the processing limitation argument is presented by de Palma et al
(1994). They model consumers with different abilities to choose such that an individual with lower ability
to choose will make more errors in comparisons of marginal utilities. They outline the implications of
sample of individuals produces widely different choices, even if in all other aspects the individuals are
identical. In our context, we suggest that the complexity of the decision problem will affect the ability to
choose, and thus for any given individual, ability to choose will differ depending on the task demands.
Similar conclusions arise from the literature on “bounded rationality” (March, 1978; Simon, 1955).
There are relatively few empirical applications of the literature on processing limitations. A
notable exception is Mazzotta and Opaluch (1995), whose objective is to empirically test the validity of
Heiner’s (1983) hypothesis concerning complexity and choice behavior. Mazzota and Opaluch relate
complexity in a contingent behavior choice task to variance in an econometric choice model, which is a
restricted form of the model we shall present later. They find support for the hypothesis of imperfect
cognitive ability and for the notion that increasing complexity increases the “noise” associated with choice.
Literature in Human Decision Theory examines the notion that individuals change their decision
making “heuristics” as task complexity changes. The selection of choice strategy is hypothesized to depend
on the trade off between costs of effort in making the attribute comparisons versus the benefits of making
an accurate choice (essentially, it is assumed that respondents make a cognitive effort versus outcome
accuracy tradeoff). Shugan (1980), for example, suggests that the costs of decision making to the
individual are associated with his or her limited processing capability, the complexity of the choice, time
pressure and other factors. He constructs a conceptual “confusion index” which attempts to measure the
effort required by the individual to make the choice. In a similar vein, Bettman et al. (1993) examine the
impact of task complexity, measured as the degree of negative correlation between attributes, on the
decision making strategy chosen by the consumer. These researchers suggest that providing more difficult
choices may lead to richer information on preferences as respondent processing effort increases with
complexity.
However, alternatives to the effort-accuracy tradeoff have also been advanced. It has been
suggested that individuals may attempt to avoid conflict in situations where choices are complex, leading to
the use of simpler choice heuristics when attributes are negatively correlated. For example, Keller and
Staelin (1987) suggest that complexity may have an inverted U-shaped relationship with decision
and become more effective, until a point is reached where their effectiveness begins to deteriorate. Tversky
and Shafir (1992) show that when the choice environment is made complex (by adding alternatives or
making the choice alternatives similar, but not identical), some individuals opt to delay choice, seek new
alternatives, or even revert to a default (or status quo) option. Similar findings by Olshavsky (1979),
Payne (1976), Payne et al. (1988) and Simonson and Tversky (1992) suggest that the context and
complexity of the decision, as described by the number of attributes, correlation between attributes, number
of alternatives, time pressure and various other factors, significantly influence decisions.
The concept of complexity affecting choice also applies to repeated choice situations, wherein
additional choices may increase the cumulative cognitive burden. In SP choice tasks, individuals are
generally asked to face repeated choice decisions (say, R≥1 replications) to decrease data collection costs.
There is some evidence of fatigue effects in SP choice experiments (Bradley and Daly, 1994) although there
is also some counterevidence suggesting this fatigue effect may be minimal (Brazell et al. 1995). In some
cases respondents may actually become more proficient at the choice task as they are exposed to more
replications (i.e. learning occurs).
The notion that complexity affects decision making conflicts with the traditional notion of value
maximization used in economics: individuals are assumed to be able to assign values to alternatives, and
choose the alternatives with the highest value, independent of context. To address this issue, we design a
mechanism that reflects the degree of complexity associated with a task. We incorporate this measure into
statistical models of choice in a fashion consistent with the notion of context-based decision making. We
assume that the basic mechanism whereby choice complexity affects our ability to infer taste parameters in
a sample of respondents is through the distributions of choice alternative utilities; specifically, we assume
that complexity impacts the variance of the utility distributions.2
Given the research previously reviewed, we present and discuss two hypotheses for subsequent
investigation.
2
H1: The variances of the latent utilities will be convex in the level of complexity.
As individuals face increasing complexity they will respond with increasing information about their
tradeoffs (decreasing variance) but, beyond some point of complexity, greater inconsistency across
individuals will be found, and so variance increases. This hypothesis is based on a blend of the literature
described above in which increasing complexity has been shown to result in improved performance up to a
point. After this point individuals may avoid conflict or use simple heuristics to make choices.
H2: The variance of utility is a convex function of cumulative cognitive burden.
A common sequence of events for a respondent in an SP choice task may be: (1) learning for some
number of replications, followed by (2) the application of the learned behavior during another number of
replications, and finally, (3) fatigue sets in, leading to less consistent choice behavior. This would lead us
in general to expect a U-shaped (convex) relationship between variance and cumulative cognitive burden.
However, the dominance of the fatigue or learning effect in any given task (perhaps due to the number of
replications, the number of attributes, or lack of familiarity with the choice) may produce a strictly
increasing or decreasing relationship between cognitive burden and variance in any given empirical data
set.
2.2 Representing The Effect of Complexity and Cumulative Cognitive Burden in Choice Models
In this section the objective is to characterize the complexity of choice environments through a
measure that can capture its various dimensions. Some dimensions of such a measure have already been
discussed above (the number of attributes, the number of alternatives, negative correlation of attributes,
etc.). Note, however, that each of these quantities is a component of complexity rather than an overall
measure.
Distance between alternatives in attribute space, which is related to the correlation structure of the
attributes, is a candidate for capturing the degree of overall complexity involved in a choice context.
alternative A over B. If two alternatives were very similar, these metrics would produce a small value.
While such measures would reflect the distance between alternatives in attribute space, they may not
capture the number of alternatives in the measure of complexity. These measures also require that all
attributes be commensurable, a requirement that usually cannot be met.
In order to design a more complete, and a more formally defined, measure of complexity, we turn
to information theory to provide a measure of information or uncertainty. Information theory refers to an
approach taken to characterize or quantify the amount of information contained in an experiment or
phenomenon3 (Soofi, 1994; Shannon, 1948). Given a set of outcomes (or alternatives, in our context)
{
x
j,
j
=
1
,... , }
J
that are described by a probability distribution( )
x
, the entropy (or uncertainty) of the choice situation is defined asH X
H
xx
jx
jj
(
)
=
(
)
= −
∑
(
) log (
)
≥
0
. (1)In a case with J alternatives in a choice set, entropy reaches its maximum if each of the J are equally likely.
If the number of equally likely alternatives increases, entropy also increases. Thus, the number of
alternatives in the choice set directly affects the level of complexity, making this measure a useful
mechanism for testing hypotheses regarding the impact of the number of alternatives on choice variance.
Entropy is minimized if there is one dominant alternative in the choice set. For example, if one alternative
has a probability of one and the others have probabilities of zero, entropy achieves its minimum of zero.
The degree of attribute correlation and number of attributes also play a role since these elements will affect
the assignments of probabilities.
An additional aspect associated with the use of entropy as a measure of task complexity is the fact
that cumulative entropy can be used to assess the impact of cumulative complexity of multiple choice tasks
(i.e. cumulative cognitive burden). Cumulative entropy provides a measure of the amount of uncertainty
faced by individuals as they make sequences of choices.4
3
Information theory and entropy are used in other contexts in economics but these typically involve the use of the maximum entropy principle as an estimator in a statistical context (see Sengupta, 1993).
4
Our measure of task complexity is incorporated into a discrete choice econometric model as a
parametrization of the variance (or scale) of the stochastic error term of the utility function. Details on the
econometric model and the incorporation of the complexity factor in the variance term are described below.
3.0 THE STATISTICAL MODEL 3.1 Model Derivation
Suppose that certain task demands or environmental conditions
E
n apply to all the alternatives of the n-th choice setC
n(where n is the index of an individual decision-maker, in the case of RP data, or the index of a decision-maker/replication combination in the case of SP data). Suppose further that the utilityfunction for the i-th alternative in
C
n is additive, as below:U
in=
V
in+ ε
in , (2)where
V
in is the systematic component andε
in is the stochastic component. As postulated in the previous section, we assume thatE
n affects the utilities only through the stochastic component. More precisely, we shall assume that differences in environments generate differential consistency levels in observed behavioracross individuals, which will be reflected in (2) by affecting the variances of the assumed distribution for
the disturbances.
The probability that individual n chooses alternative
i
∈
C
n is given byP
U
U
j
i i j
C
V
V
j
i i j
C
in in jn n
in in jn jn n
=
>
∀ ≠
∈
=
+
>
+
∀ ≠
∈
Pr{
,
, ,
}
Pr{
ε
ε
,
, ,
}
(3)If we were to assume that the
ε
in’s are IID Gumbel with a common scale factorµ
, we would derive thevery familiar Multinomial Logit (MNL) model from (3) (see Ben-Akiva and Lerman, 1985, chapter 5).
We shall suppose, however, that the
ε
in’s are Gumbel distributed, independent across n andi
∈
C
n, with scale factorsµ
in=
µ
n(
E
n),
∀ ∈
i
C
n, where it is required thatµ
in>
0
. That is to say, the error terms are independent, but not identically distributed. The density functions for the individual errorterms are given by (see, e.g., Ben-Akiva and Lerman, 1985)
so that the variances are
σ
in2=
π
2/
6
µ
n2(
E
n)
. Our derivation is somewhat, but not unduly, complicated by the assumption that the scale factors vary by individual observation, specifically, as a function of theindividual’s environmental or task conditions
E
n. Multiply (1) by the scale factorµ
n(
E
n)
to obtainµ
n(
E
n)
⋅
U
in=
µ
n(
E
n)
⋅
V
in+
µ
n(
E
n)
⋅
ε
in . (5)Say that the random variable
η
is Gumbel distributed with scale factorµ
. Then it is a property ofthe Gumbel distribution (see Ben-Akiva and Lerman 1985, 105) that, for any scalar
α >
0
,αη
is also Gumbel distributed, but with scale factorµ α
/
. Therefore in (5) the random variablesµ
n(
E
n)
ε
in, all n andi
∈
C
n, are IID Gumbel with unit scale factors. Thus, if we multiply both sides of the probabilistic event in (3) byµ
n(
E
n)
>
0
, we leave the probability statement unchanged:where we have made explicit the role of parameter vectors
β
andθ
, andX
in is a K-vector of attributes for alternative i and person n. Ben-Akiva and Lerman (1985, 204-207) make mention of this model for thepurpose of treating heteroscedasticity within the context of the MNL model.5,6
The Heteroscedastic MNL model has basically the same properties as the MNL model, notably
Independence of Irrelevant Alternatives (IIA) and uniform cross-elasticities. However, when a variable is
common to the mean of the utility and its variance, the elasticity contains two components: a direct effect
5
The parallel between this derivation and that used to derive heteroscedasticity corrections for the general linear model should be apparent.
6
arising from changes in the means and an indirect effect from changes in variance. For example, if price is
in the utility function and also is a component of a complexity index in the variance, a price increase for
one alternative will have a direct effect reducing the attractiveness of this alternative. However, if this
price increase makes the products more similar, it will increase the difficulty associated with choice in the
marketplace. This may increase variance and could lead to an additional loss. If the attribute change leads
to complexity reductions the indirect effect could offset the direct effect. Thus, market share elasticity
depends not only the attributes of the alternatives but also on market conditions or the positioning of
available alternatives.
3.2 Incorporating the Effect of Choice Complexity in a Choice Model
As stated in Section 2, we propose to summarize the effects of the complexity of the decision
environment on choice via the information theoretic measure entropy, defined as
H
nP
inP
inA measure of the probability of selection of the alternatives is required to operationalize entropy as
a complexity measure. Obviously, if we knew the true values of the choice probabilities the entire choice
modeling exercise (including all this complexity!) would be unnecessary. However, we do not know the true
choice probabilities, so we must construct an a priori estimate that will sufficiently characterize the choice
context to allow us to better separate information from “noise” in the choice data. In this paper we
construct a measure of the probability of choice based on a “flat prior” over attribute levels. That is, we
assign equal weights within a normalized attribute space to the main effects of all attributes in the choice
set. This provides us with a measure of probability of choice as derived from an assumed MNL model:
~ (
)
exp[
]
Here, is the set of flat prior weights (a vector of ±1’s, perhaps scaled to account for differences in
of alternatives, where similarity is based on an attractiveness metric calculated using a set of equal prior
weights. The resulting approximate entropy measure is, thus,
~
~ (
Based on this entropy approximation, we also define our proxy for cumulative cognitive burden, namely,
cumulative entropy:
where r refers to replication index, R is the total number of replications seen by each respondent and
H
~
n ris
the entropy of the r-th replication (given by equation 10) for individual n.
The definition of the prior and the use of main effects only (rather than main effects and interaction
effects) may be modified based upon available information. For example, if information is available from
another choice task, or if demographic characteristics provide information on the preferences of the
individual, this information could be used to construct an informed prior. Our use of the flat prior can be
considered an approximation to the true level of information since we have not included interaction effects
and we have not constructed individual-specific priors. However, it is important to note that we do not
wish to make behavioral assumptions about the consumer. Rather, we are constructing an index that
characterizes the task demands on the respondent. More accurate information about the consumer should
help us construct a more accurate measure of the task demands or complexity the consumer faces, but it
may be that the benefit of such additional refinement is marginal.7
Note that for any given choice set
C
n, entropy is constant across alternatives. Hence, it can beused to parametrize the scale of the error terms in model (7). In our empirical research, we assume that the
scale factor for the r-th replication of the n-th respondent is given by
7
While we employ a simple prior in our empirical analysis, we have done some limited exploration of the
µ
nθ
θ
θ
θ ψ
θ ψ
which guarantees that the scale factor is always nonnegative. Other functional forms for the argument ofthe exponentiation operator could be adopted that would permit testing hypotheses H1 and H2. However,
(12) has the appeal of simplicity, and so was adopted for our work.
4.0 CASE STUDIES
We have arranged our empirical work into two sections: first, we shall examine the evidence from
several SP choice studies indicating that accounting for choice complexity and cognitive burden impacts
inferences about taste parameters; next, we shall examine a case that contains both RP and SP data sources
and determine the extent to which differences in choice complexity impact the individual and pooled
estimates of these choice data.
4.1 Evidence of the Impact of Choice Complexity and Cumulative Cognitive Burden in SP Data
Table 1 presents a summary description of six SP choice studies in which we have individually or
jointly been involved in the past three years.8 The first four studies involve choices that are more familiar to environmental and resource economists: (1) campground site choice, (2) Caribou passive use
(Adamowicz et al. 1995), (3) moose hunting site selection (Adamowicz et al. 1996) and (4) mode choice at
a tourist recreation location. The remaining two studies, however, are quite different: (5) choice of frozen
concentrate orange juice and (6) provider selection for a certain consumer loan product. The latter were
included to enlarge the scope of applicability of our empirical findings.
To interpret the results to be presented later on, it is important that we understand how the SP
choice data were collected. These studies have a number of features in common:
1. The choice task was presented in the form of a paper and pencil exercise, with the choice alternatives
presented as columns in a table, the first column of which named the attributes. The values of the
attributes were provided in the cells of the table itself. The full task faced by a respondent had from 8
8
to 16 choice sets, depending upon the study; these were arrayed sequentially for the respondent,
generally one to a page.
2. Within each study, all choice tasks had fixed choice set size.
3. A glossary of attributes and their levels, as well as instructions on how to perform the task (including a
sample choice situation), preceded each choice task..
Essentially, the task display and choice collection format was the same in all the studies. Five of the studies
were conducted in North America. In almost all studies respondents were either pre-recruited or recruited
by random digit dial. With the exception of the moose hunting site selection (Study 3), respondents received
a questionnaire in the mail; Study 3 brought respondents to a central facility.
The studies do differ, however, in a number of factors (again, see Table 1): each involves a
different product or service, individual choice sets have 3 to 6 alternatives, product/service descriptions
involve anywhere from 5 to 14 attributes, and respondents were exposed to 8 to 16 replications.
Table 1 makes it clear that the experimental designs underlying each study resulted in different
entropy levels (calculated as per expression 10). Entropy, our proxy for choice complexity, can vary
between 0 and the natural logarithm of the choice set size. An examination of Table 1 will show that the
designs of five out of the six studies basically filled their entire theoretical entropy range. The exception to
this was Study 6 (consumer loan provider), which had a truncated lower limit for the entropy range: the
design’s entropy levels ranged from 0.710 to 1.379, whereas the theoretical range is 0 to 1.386. For the
moment, note that none of these experimental designs were originally drawn up with the intent of achieving
any specific levels of entropy; instead, the design criterion was the achievement of orthogonality between
attributes.
4.1.1 Individual SP Case Analysis
Table 2 presents an overview of the estimation results for these six SP studies. We present the log
likelihood values for both the (homoscedastic) MNL and the Heteroscedastic MNL models. The final
column of the table presents the likelihood ratio statistic for the hypothesis that there is no effect of choice
complexity or cumulative cognitive burden on respondents’ choice behavior. This statistic jointly tests
scale function (12). In four of the six studies (namely, studies 1, 3, 4 and 5), the hypothesis that θ=0 cannot
be rejected for α≤0.05. In study 2, this hypothesis cannot be rejected for α≤0.16. Only in study 6 is the
hypothesis soundly rejected. (We shall subsequently discuss a possible explanation for this result in study
6.) The effect of entropy is strongest in study 1, which also happens to be the task with the greatest number
of attributes (14) and the largest choice sets (6 alternatives). Thus, we find overall support for the notion
that choice complexity and its cumulative effect impact the information that we receive from these SP
choice tasks, conducted in the form we described above.
Let us now examine Table 2 for support for hypothesis H1 in the individual studies. To remind the
reader, that hypothesis states that the variances (scales) of utilities should have a convex (concave)
relationship with choice complexity. In terms of the parametrized scale function (12), under H1 we would
expect parameter
θ
1 to be positive andθ
2 negative. This occurs very clearly in two of the studies (1 and4), for which the asymptotic t-statistics for these parameters are above 2.0 in absolute value. In the
remaining studies the two parameters are not individually significantly different from zero. However, in
most of the studies the two parameters nonetheless have the expected signs. Thus, we are led to conclude
that in the studies examined there is some strong evidence that choice complexity impacts the inferences
that can be drawn from respondents’ choice behavior. (See also Section 4.1.2 below.)
Hypothesis H2 states that the cumulative cognitive burden imposed on the respondent will in
general have a convex (concave) relationship with the variance (scale) of the utility functions. The
reasoning behind this hypothesis is that respondents are assumed to go through a “learning-performance
plateau-fatigue” sequence during the course of the task (see prior discussion in Section 2.1). The
completion of the entire sequence will depend upon whether the task is long and complex enough, relative to
some total effort level deemed acceptable by the respondent (perhaps akin to some “task effort” budget
defined by him/her prior to undertaking the task). Under H2, and assuming that the sequence is completed,
we expect that parameter
θ
3 will be positive andθ
4 negative.Table 2 shows that only studies 2 and 5 display statistically significant estimates for
θ
3 andθ
4.In study 2 (Caribou passive use), we have the general concave form postulated in H2 between scale and
entropy. We have assumed, for display purposes, that an individual either receives a sequence of eight less
complex choice sets (each with entropy equal to 0.50) or eight more complex sets (entropy equal to 1.0).
Note that in study 2 the maximal entropy is about 1.1. In either case, the estimated scale function peaks at
a cumulative entropy of about one, which corresponds in the “easy” task to 2 choice sets and in the “hard”
task to only one choice set. After that, the scale rapidly deteriorates towards zero (i.e. variance increases
continuously).
A zero scale is a critical value because the corresponding choice behavior is essentially random,
hence completely uninformative with respect to the tradeoffs. In Study 2 the task is unfamiliar to
respondents (making tradeoffs between wilderness area sizes, forest industry employment, individual tax
payments, etc). Respondents were asked to review a considerable amount of descriptive material before
completing the task. The respondents appear to learn in the first few choice tasks as they engage in this
unfamiliar activity. However, they appear to learn quickly and fatigue sets in after 3-4 choice sets. It may
be that respondents learn to focus on key attributes to simplify the task and tire quickly once this heuristic
is established. The “overhead” associated with the descriptive material may also contribute to their fatigue.
As well, these choice sets included a status quo option. The cumulative cognitive burden may result in
respondents choosing the status quo option as a means of dealing with the uncertainty, as in the
experiments conducted by Tversky and Shafir (1992).
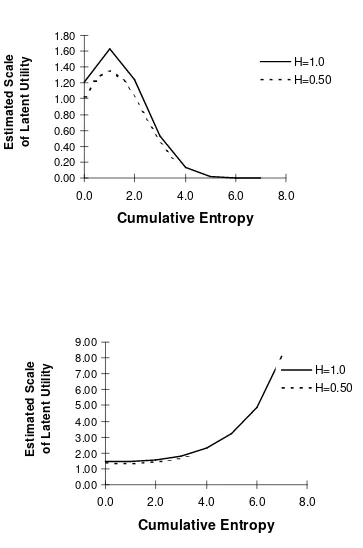
In study 5 (frozen concentrate orange juice choice), we have statistically significant evidence that
respondents remain in the “learning” phase of the sequence we mentioned above. Parameter
θ
3 isstatistically significant but negative in sign, while
θ
4 is positive in sign, though marginally significant.Figure 3 shows the learning pattern quite clearly, indicating that scale increases with replication of the
decisions. (The effect does not differ between the “easy” and “hard” choice set sequences.) A possible
reason for this result is that respondents (the main shoppers in the households) found the choice sets
somewhat unfamiliar at first, perhaps because orange juice choice may not be based on highly
compensatory evaluations. This led to less consistency in behavior across individuals in the earlier choice
sets to which they were exposed. However, as they progressed through the task, their preferences became
especially interesting when we consider that in this task respondents were exposed to 16 distinct choice
sets, the highest among the studies presented here.
4.1.2 Cross-Product Class SP Case Analysis
Viewing the results presented thus far in Table 2, we were motivated to conduct an additional test.
We posed ourselves the question: Could it be possible that the effect of choice task complexity is
commensurable across these six SP choice studies? If such a condition were to hold, it would lend strong
support to the generalizability of the study-by-study results discussed above.
Accordingly, we pooled the data for the six choice studies in such a fashion that taste parameters
and cumulative cognitive burden parameters (i.e. the β vectors and the corresponding θ3’s and θ4’s) were maintained specific to each study. However, the impact of current choice task complexity was constrained
to be equal across all six data sets. The resulting pooled model has 139 parameters and a log likelihood of
-38,372.3; the corresponding individual studies have 146 parameters and a log likelihood of -38367.6.
Hence, the hypothesis that the impact of choice task complexity is equal across the six studies can be tested
with a chi-squared statistic of 9.4 with 7 degrees of freedom. The hypothesis cannot be rejected at the 95%
confidence level.
To us, this is quite a surprising result. A priori, we would not have anticipated that the impact of
task complexity on the scale of the underlying utility functions would generalize across six very different
product classes. That they do may be the result of the degree of design and survey technique commonalities
among them (see discussion above); however, another, non-exclusive explanation is that the entropy
measure we proposed as an index of choice complexity adequately captures the impact of utility similarity
between alternatives on the variance of tradeoffs implicit in choices across a relatively wide variety of
product classes. As we shall subsequently note, this seeming generalizability encourages us to suggest
certain uses of the choice complexity concept in the design of choice tasks.
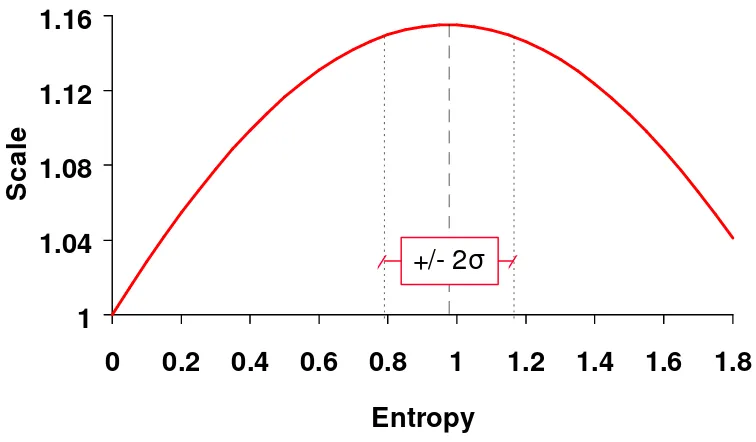
Using the joint model, we are able to calculate that the optimal entropy is approximately 1.0, with
a 95% confidence band of ±0.2 entropy units, across the six studies (see Figure 4)9. This means that the
9
choice scenarios with current entropies between about 0.8 and 1.2 yielded the highest scale (i.e. lowest
variance) of the unobserved utility component. This in turn implies that scenarios in this range most
contributed to the formation of the estimated taste parameters, and conversely, that scenarios with entropies
well below 0.8 and well above 1.2 contributed more “confusion” to the estimation process than those within
the confidence band.
It is interesting to compare this “optimal” band of [0.8,1.2] entropy to the design entropy values for
each study (see Table 1). It will be noted that only study 6 (consumer loan product) has an entropy design
range close to this “optimal” band. This may underlie the aforementioned result (see section 4.1.1) that only
in study 6 was there no discernible effect of current entropy. The other five studies in Table 1 have
scenarios with entropy values well outside this band, especially below the band. This may imply that the
corresponding designs (geared at generating design matrices orthogonal in attributes) contain runs that are
statistically uninformative with respect to tradeoff parameter inferences; that in fact, such scenarios
increase rather than decrease variance, thus contributing to the “noise” instead of the taste parameter
“signal” in the data.
4.2 Choice Complexity and the Combination of RP/SP Choice Data
The six SP case studies we examined in the previous section present quite clear evidence that
choice complexity and cumulative cognitive burden can affect the quality of the information obtained from
SP choice experiments. We now examine the impact of differential levels of complexity on the combination
of multiple choice data sources, specifically, RP and SP data.
The data we utilize involve the selection of recreational hunting sites in Alberta, Canada. As
described in greater detail in Adamowicz et al. (1996), RP choice data were collected from hunters in the
form of “trip logs” that elicited information on all their hunting trips in the 1992 season. Thus, the RP
choice data are actually frequencies of visitation to a number of different wildlife management units
(WMU’s). In addition, these hunters provided perceptions of quality attributes (moose populations, hunter
congestion, hunter access, forestry activity). Other attributes (road quality and distance to site) were
These same hunters were also submitted to an SP task with sixteen replications, each involving
choice between two generic WMU’s (described using the same six attributes stated above) or not going
moose hunting. The dependent discrete variable in this data source was the categorical choice indicator.
These data have already been used as one of the six SP studies examined in Section 4.1 (i.e. study 3).
In-depth discussion of these data are given in Adamowicz et al. (1996), to which the reader is
directed for further details. For the purposes of this exercise, we have utilized the entire RP sample
available (representing a total of approximately 930 hunting trips), but have sampled from the full SP
choice data available in such a way that both data sources have an equivalent number of trips represented.
This obviates the need to specify a weighting scheme for the data sources when pooling them (see the
discussion in Adamowicz et al. 1996), removing this as an issue in the combination process.
As we indicated previously in Table 1, the SP data (which involves trinomial choice sets) has an
entropy range from 0.117 to 1.088, versus a theoretical maximum of 1.099 for trinomial sets. In
comparison, the RP data has a much wider entropy range of 0.007 to 2.565. This difference is principally
due to the fact that some hunters are aware of a large number of WMU’s (a maximum RP choice set size of
13 different sites is observed in the data). The RP choice sets are based on the individual’s awareness of
sites and thus we would expect a correlation between individual’s experience and their choice set size. The
previously reported analysis of the Moose SP data (see Section 4.1) showed that choice complexity did not
significantly affect the variance/scale of the estimated utilities. A point of great interest is whether the much
wider entropy range in the RP data leads to a similar finding.
As described in note 1, there are often advantages associated with the joint estimation of SP and
RP data. For the purposes of combining these two data sources, we shall utilize the following definition for
the scale function of choice set n:
µ
α
α
if n is an RP observation
=
+
if n is the r th replication of an SP observation
Note that in RP observations there is no effect of cumulative entropy since there are no replications10. We have also added a parameter (
θ
5) that captures average scale differences between RP and SP data sources,all other factors being equal. This scale function parameter has traditionally been the only one considered in
combining RP and SP data sources (Adamowicz et al. 1994, Adamowicz et al. 1996, Ben-Akiva and
Morikawa 1990, Ben-Akiva et al. 1994, Hensher 1994, Swait et al. 1994).
The usual approach to combining RP and SP data is to control for average scale differences
between sources. In terms of scale function (13), only parameter
θ
5 is allowed to vary. Table 3 shows theestimation results for this model in column (3). (Only parameters from scale function 13 are presented. All
taste parameters are omitted for the sake of brevity and clarity.)11 The estimated value of
θ
5 is significant at the 95% confidence level, and the traditional view of combining the two data sources would compare thismodel with the models in columns (1) and (2). The likelihood ratio statistic for the “traditional pooling”
would then be 33.8 with 14 degrees of freedom. The corresponding chi-squared critical value at the 95%
confidence level is 23.7, so the hypothesis of equal taste parameters across data sources is rejected, despite
controlling for average scale factor differences between the data sets.
Table 3 also presents the estimation results for heteroscedastic MNL models of the Moose RP and
SP data in columns (4) and (5). Comparing first the heteroscedastic MNL RP model of column (4) with its
homoscedastic version in column (1), we note that the likelihood ratio statistic is 91.6 with 2 degrees of
freedom. This shows the very strong effect that choice environment has on the RP choice data by itself.
This stands in contrast to the SP data (columns 2 and 5 of Table 3), for which the equivalent statistic is 9.6
with 4 degrees of freedom. Thus, taken each by itself, the two data sources evince very different choice
environment effects: very strong in the RP data, exhibiting a concave relationship between scale and
complexity; and just significant at the 95% confidence level in the SP data, exhibiting the concave
relationship postulated by hypothesis H1. We believe that one of the reasons the effect of choice complexity
is so much stronger in the RP data than in the SP data is due to the former’s much wider entropy range.
10
If time series data were available we could model cumulative entropy in an RP setting, where it may be interpreted as a proxy for experience.
11
Now let us consider pooling the two data sets, considering the impact of choice complexity on both
RP and SP sources. Column (6) presents this combined model. It is immediately apparent that
θ
1 andθ
2,marginally significant in the SP entropy model in column (5), become well-defined and statistically
significant in the joint model of column (6). This may be due to the extended entropy range of the RP data.
In this combined model, the effect of cumulative cognitive burden on scale basically disappears, as
evidenced by the low t-ratios of
θ
3 andθ
4. Interestingly, parameterθ
5, which ceteris paribus measuresthe average scale difference between the two data sources, is not significantly different from zero in column
(6), whereas it was significantly different from zero in the “traditional pooling” model of column (3). As for
the parameters defining the impact of choice complexity on the RP data (
α
1 andα
2), these continue tohave a strong effect on the scale factor (though the quadratic effect is only significant at the 90%
confidence level), as in column (4).
We are interested in two questions involving the full model in column (6). First, does the pooling of
RP and SP data sources benefit from the consideration of choice complexity in both data sources vis-à-vis
the traditional method? To answer this question, we calculate the likelihood ratio statistic between models
(6) and (3) to be 78.4 with 6 degrees of freedom, which compared to the critical value of 12.6 (at the 95%
confidence level) leads us to conclude that the answer is a categorical “yes”! The second question is
motivated by the observation made above that the RP and SP data cannot be pooled by the “traditional”
method: does consideration of choice complexity in the pooling process enable one to pool these two data
sources? While one would also have liked the answer to this question to be “yes”, we must unfortunately
report that the answer is “no”. This is due to the large likelihood ratio statistic of 56.6 with 14 degrees of
freedom, based on the comparison of model (6) against models (4) and (5). Note that this hypothesis has an
even larger statistic than was the case in the “traditional” pooling process (models 1, 2 and 3), for which
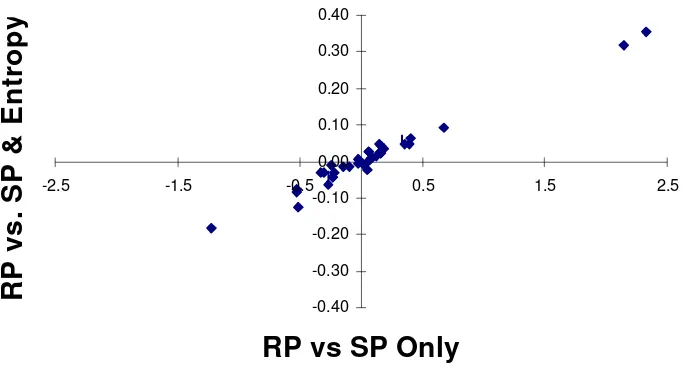
the value was 33.8 with 14 degrees of freedom. However, this likelihood ratio test is very rigorous and
seems to overstate the differences between the parameter vectors. The linear relationship between the two
vectors, which indicates that they are equal up to a positive scale, is clearly displayed in Figure 5.
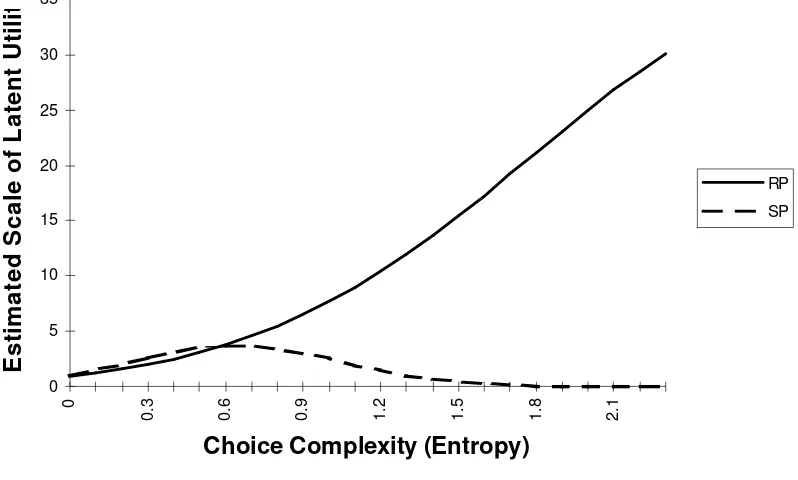
Taken together, the results in this section indicate two things to us. First, consideration of the
example. We surmise this result is generalizable. Second, pooling of multiple data sources is a
recognizably complicated affair, based on a myriad of assumptions. Examination of the parameters on
entropy in Table 3 for RP and SP choices reveals that the impact of entropy on these data types is quite
different. This is illustrated in Figure 6 where the scale function parameters from model (6) are used to
construct scale factor estimates by data source. Note that the RP scale rises with entropy while the SP
scale peaks at about 0.7. Higher entropy in the RP context may indicate individuals with more experience
(and thus larger choice set sizes). The design used in the SP task contains few complicated choices and
thus only parallels the RP context for low entropy choices (or inexperienced recreationists). This may be a
substantial component in explaining the rejection of the hypothesis of pooling. This raises the issue of
designing SP tasks to replicate environments of the application of interest. We return to this issue below.
5. DISCUSSION
Our study of six SP choice experiments has lent strong support to the idea that the decision
environment and choice task characteristics can influence the quality of the statistical information obtained
from the data. In the cases in which the effect of choice complexity was less important, it may well be due
to limitations in the experimental design (specifically, a limited entropy range) rather than an absence of
impact.
In our opinion, one of the results of great import for future work was our inability to reject the
hypothesis that the impact of choice complexity on latent utility scale was the same across the six SP
studies examined. This points to a possible generalizable use of the entropy measure to characterize choice
task difficulty across a range of product classes. This would permit use of the complexity concept to
formulate general SP choice task design principles (more about this in the following section). The
emergence of this somewhat general result across a variety of product types may be considered as evidence
for the notion that individuals do process alternatives on the basis of their attribute components, along the
As hypothesized by us (and supported by literature in the human decision making area), the
relationship between the variance of latent utilities and choice complexity has been found to be convex in
the cases examined. Thus, increasing complexity improves (i.e. decreases variance) choice modeling
estimation results to a point, but thereafter additional complexity increases “noise” levels in the data. This
corresponds to the Bettman et al. (1993) results on choice in situations with negatively correlated attributes,
which suggest that consumers “take on” SP choice tasks with more interest and commitment than in other
decision situations. At some point, however, increasing complexity leads to idiosyncratic behavior, which
increases variance (in analogy to Keller and Staelin’s 1987 decision-effectiveness hypothesis).
We have also found that cumulative effort (or cumulative cognitive burden) in an SP task can have
an effect on the quality of the information derived from the choice experiment. We have postulated that
consumers undergo a “learning-performance plateau-fatigue” sequence during the course of the choice task,
for which there is some support among the six data sets we examined. Figure 3 illustrates that the entire
sequence may or may not be played out in any particular study, but we certainly believe that cumulative
cognitive burden should be a factor in designing any SP choice task.
Though we developed our conceptual framework and approach based on our interest in choice
experiments and the application of SP models to real markets, we have also seen in Section 4.2 that the
analysis of RP choice data can benefit from modeling the impact of choice environment. In the single
example presented in Section 4.2, the effect of complexity on the RP model was very significant. In the
case of RP data, making the scale factor for each individual respondent a function of entropy (or some
other measure of choice set complexity) is a way to rank choice sets in terms of their contribution to
establishing taste parameters estimates. We believe the application of our concepts to RP data deserves
future research.
As we stated in closing Section 4.2, it would seem that modeling the effect of choice complexity on
the variance of utilities is helpful when pooling RP and SP data sources. However, our results with this one
application indicate that we may currently be taking too simplistic an approach to combining multiple data
sources. We are moving beyond modeling the average variance differences between data types and are
complexity in the combined scale function improves joint model fit by a large amount, but it may also serve
to differentiate RP and SP tasks more sharply. This should not discourage us, of course, but instead lead us
to seek further factors to consider that will eventually enable pooling of the data sources.
One such factor is the replication of application context entropy levels in the SP task. In our
RP/SP case study, for example, the SP entropy levels are noticeably lower than the RP context (see Figure
6). This may be a significant contributor to the rejection of the hypothesis of equal taste parameters. An
important question in designing SP tasks should be the degree to which its choice context matches the
application’s complexity level.
6. CONCLUSION AND EXTENSIONS
Some economists (e.g. Heiner 1983, de Palma et al. 1994), but generally psychologists and
consumer behavior researchers (e.g. Bettman et al. 1993, Keller and Staelin 1987, Tversky and Shafir
1992), have put forth the idea that consumer choice behavior can be affected by context and decision
environment complexity. We have developed a specific model form that enables us to test this idea
empirically. Our examination of several SP choice experiments and one RP data set lends strong support
that what we term “choice complexity” is an important factor to consider when modeling choice behavior,
both at the task design stage and during econometric model estimation. Complexity can also impact the
pooling of multiple choice data sources.
Individuals display a wide distribution of information processing capability. For example, level of
expertise should lead to different signal to noise ratios between individual respondents. Certain
socio-demographics may be correlated with respondents’ ability to process information. Thus, an interesting
avenue for research would be testing for the effect of different indicators of processing capabilities when
collecting and modeling SP choice data.
The results presented in this paper are very strongly dependent upon the operationalization of
choice complexity through the entropy measure. We have defined an approximate entropy index assuming
Limited testing on our part indicates, however, that sensitivity of the results to refinements of the prior
weights may be quite low.
An important caveat applies to our work, as well as that of almost all empirical choice modeling
work in the literature: we continue to assume that individuals behave in a compensatory fashion. Research
in psychology and consumer behavior has long suggested that individuals may adopt a number of different
decision strategies as a function of choice complexity. In fact, we have argued that one of the possible
reasons for the convexity of the relationship between variance and complexity is that at high complexity
levels choice behavior across a group of individuals becomes less consistent (i.e. variance increases). This
upturn in variance may be due to the employment of different strategies by different individuals in the
sample. Thus, a necessary avenue for future research is to investigate choice models that recognize this
heterogeneity in decision strategies as a means to utilize alternative model forms as a function of the choice
context.
Our results point to an exciting line of research in the design of SP choice tasks. Today, the
individual choice sets that an individual respondent will encounter are generally selected so as to meet
certain desirable statistical properties (e.g. attribute orthogonality) that will be especially useful during the
model estimation stage. This results in some number of choice sets that must be shown to respondents.
Then, generally on the basis of experience (or at most, on the basis of some pre-testing), some number of
replications per respondent is decided upon. Clearly, the experimental designs are defined completely
independently of respondents’ cognitive abilities and their willingness to expend some “cognitive budget”
during the task. This paper has shown that it is possible to account a posteriori for the effect of task
complexity and cumulative respondent effort. However, using the concepts developed in this paper, would
it not seem eminently possible to develop a SP choice task design principle that sought to maximize the
signal-to-noise ratio (i.e. information content) of the data to be collected, subject to constraints related to
respondents’ cognitive abilities and “cognitive budgets”? This new design principle would not simply be
applied to design the choice sets, such as current technologies do, but also to determine choice set
REFERENCES
Adamowicz, W., P. Boxall, M. Williams and J. Louviere. 1995. Stated Preference Approaches for Measuring Passive Use Values: Choice Experiments versus Contingent Valuation. Department of Rural Economy Staff Paper 95-03. 31pp.
Adamowicz, W., J. Louviere and M. Williams. 1994. Combining Stated and Revealed Preference Methods for Valuing Environmental Amenities. Journal of Environmental Economics and Management. 26:271-292.
Adamowicz, W., J. Swait, P. Boxall, J. Louviere and M. Williams. 1996. Perceptions versus Objective Measures of Environmental Quality in Combined Revealed and Stated Preference Models of Environmental Valuation. Journal of Environmental Economics and Management. Forthcoming.
Ben-Akiva, M. and T. Morikawa. 1990. Estimation of Switching Models from Revealed Preferences and Stated Intentions. Transportation Research. 24A (6):485-495.
Ben-Akiva, M. M. Bradley, T. Morikawa, J. Benjamin, T. Novak, H. Oppewal and V. Rao. 1994. Combining Revealed and Stated Preferences Data. Marketing Letters. 5(4).
Ben-Akiva, M. and S. Lerman. 1985. Discrete Choice Analysis: Theory and Application to Travel Demand. MIT Press: Cambridge, MA.
Bradley, M. and A. Daly. 1994. Use of Logit Scaling Approach to Test for Rank-order and Fatigue Effects in Stated Preference Data, Transportation. 21:167-184.
Bettman, J.R., E.J. Johnson, M.F. Luce and J.W. Payne. 1993. Correlation, Choice and Conflict. Journal of Experimental Psychology: Learning, Memory and Cognition. 19:931-951.
Brazell, J., J. Gray-Lee, J. Louviere, B. Dallaert, M. Pullman. 1995. Nobody Will Do That! An Empirical Investigation of Survey Length Effects on Response Rate and Reliability in Choice Model
Experiments. Presented at the INFORMS 1995 Marketing Science Conference, July 2-5, 1995, Sydney, Australia.
Daly, A. 1987. Estimating ‘Tree’ Logit Models. Transportation Research B, 21B(4):251-267.
De Palma, A., G.M. Myers and Y.Y. Papageorgiou. 1994. Rational Choice Under an Imperfect Ability to Choose. American Economic Review. 84:419-440.
Heiner, R.A. 1983. The Origin of Predictable Behavior. American Economic Review. 73:560-595.
Hensher, D. 1994. Stated Preference Analysis of Travel Choices: The State of the Practice. Transportation 21:107-133.
Keller, K.L. and R. Staelin. 1987. Effects of Quality and Quantity of Information on Decision and Effectiveness. Journal of Consumer Research. 14:200-213.
March, J.G. 1978. Bounded Rationality, Ambiguity and the Engineering of Choice. Bell Journal of Economics. 9:587-608.
Mazzotta, M. and J. Opaluch 1995. Decision Making When Choices Are Complex: A Test of Heiner’s Hypothesis. Land Economics. 71(4):500-515.
McFadden, D. 1981. Econometric Models of Probabilistic Choice, in Structural Analysis of Discrete Data With Econometric Applications, D. McFadden and C. Manski, Editors. MIT Press, Cambridge, MA, 198-272.
Olshavsky, R.W. 1979. Task Complexity and Contingent Processing in Decision Making: A Replication and Extension. Organizational Behavior and Human Performance. 24:300-316.
Payne, J.W. 1976. Task Complexity and Contingent Processing in Decision Making: An Information Search and Protocol Analysis. Organizational Behavior and Human Performance. 16:366-387.
Payne, J.W., J.R. Bettman and E.J. Johnson. 1988. Adaptive Strategy and Selection in Decision Making. Journal of Experimental Psychology: Learning, Memory and Cognition. 14:534-552.
Sengupta, J.K. 1993. Econometrics of Information and Efficiency. Kluwer Academic Publishers, Dordrecht.
Shannon, C.E. 1948. A Mathematical Theory of Communication. Bell System Technical Journal. 27:379-423.
Simon, H.A. 1955. Behavioral Model of Rational Choice. Quarterly Journal of Economics. 69:99-118.
Simonson, I. and A. Tversky. 1992. Choice in Context: Tradeoff Contrast and Extremeness Aversion. Journal of Marketing Research. 29:281-295.
Shugan, S.M. 1980. The Cost of Thinking. Journal of Consumer Research. 7:99-111.
Soofi, E.S. 1994. Capturing the Intangible Concept of Information. Journal of the American Statistical Association. 89:1243-1254.
Swait, J. and M. Ben-Akiva. 1987a. Incorporating Random Constraints in Discrete Models of Choice Set Generation, Transportation Research B. 21(2):91-102.
Swait, J. and M. Ben-Akiva. 1987b. Empirical test of a constrained choice discrete model: mode choice in Sao Paulo, Brazil, Transportation Research B. 21(2):103-115.
Swait, J. and E.C. Stacey. 1996. Consumer Brand Assessment and Assessment Confidence in Models of Longitudinal Choice Behavior. Presented at the 1996 INFORMS Marketing Science Conference, March 7-10, 1996, Gainesville, FL,
Table 1 - SP Study Descriptions
Task Characteristics Design Entropy Characteristics
Study # Resp.
Choice Set
Size # Attributes # Repl.
Design Minimum
Design Maximum
Theoretical Maximum 1. Campground Choice 1,786 6 14 8 0.050 1.568 1.792 2. Caribou Passive Use 364 3 5 8 0.000 1.099 1.099 3. Moose Hunting Site
Selection
104 3 6 16 0.117 1.088 1.099
4. Tourism Site Mode Choice
425 3 5 10 0.040 1.099 1.099
5. Frozen Concentrate Orange Juice
280 4 5 16 0.107 1.229 1.386
6. Consumer Loan Product
Table 2 - Impact of Choice Complexity and Cumulative Cognitive Burden in Six SP Choice Studies
1. Campground Choice 19 -15590.9 23 -15583.5 0.295(2.6)
2. Caribou Passive Use 12 -2658.2 16 -2654.9 -0.159 (-0.7)
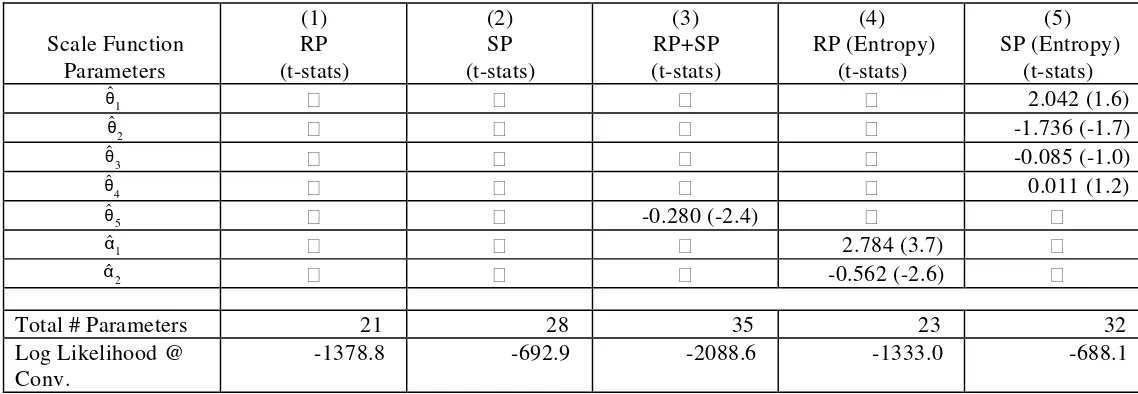
Table 3 - Estimation Results, Combination of Moose Hunting Site Selection RP and SP Data
Scale Function Parameters
(1) RP (t-stats)
(2) SP (t-stats)
(3) RP+SP (t-stats)
(4) RP (Entropy)
(t-stats)
(5) SP (Entropy)
(t-stats)
(6)
RP+SP (Entropy) (t-stats)
θ1 2.042 (1.6) 3.974 (3.2)
θ2 -1.736 (-1.7) -2.954 (-3.0)
θ3 -0.085 (-1.0) -0.049 (-0.6)
θ4 0.011 (1.2) 0.005 (0.6)
θ5 -0.280 (-2.4) 0.507 (0.8)
α1 2.784 (3.7) 1.849 (3.0)
α2 -0.562 (-2.6) -0.313 (-1.7)
Total # Parameters 21 28 35 23 32 41
Log Likelihood @ Conv.
Figure 1 - Preferences and Alternatives
X1
X2
•
C
•
B
•
A
Figure 2 - Uncertain Preferences and Alternatives
X1
X2
•
C
•
B
•
A
Figure 4 - Estimated Relationship Between Utility Scale and Choice
Complexity (Joint Model)
1
1.04
1.08
1.12
1.16
0
0.2
0.4
0.6
0.8
1
1.2
1.4
1.6
1.8
Entropy
S
c
a
le
Figure 5 - Proportionality of Pooled Coefficients with and without Entropy
-0.40 -0.30 -0.20 -0.10 0.00 0.10 0.20 0.30 0.40
-2.5 -1.5 -0.5 0.5 1.5 2.5