SPATIO-TEMPORAL TRENDS OF FIRE IN SLASH AND BURN AGRICULTURE
LANDSCAPE: A CASE STUDY FROM NAGALAND, INDIA
Hitendra Padaliaa Partho P. Mondalb
aForestry and Ecology Department, Indian Institute of Remote Sensing,ISRO, Dehradun 248001, India, Email: [email protected] bNorth-East Space Application Centre, Umiam, Shillong, Meghalaya 793 103, India, Email: [email protected]
Commission VIII WG VIII/7
KEYWORDS: Slash and Burn; MODIS; GIS; Time-Series Regression; Hotspot Analysis; North-East India.
ABSTRACT:
Increasing incidences of fire from land conversion and residue burning in tropics is the major concern in global warming. Spatial and temporal monitoring of trends of fire incidences is, therefore, significant in order to determine contribution of carbon emissions from slash and burn agriculture. In this study, we analyzed time-series Terra / Aqua MODIS satellite hotspot products from 2001 to 2013 to derive intra- and inter-annual trends in fire incidences in Nagaland state, located in the Indo-Burma biodiversity hotspot. Time-series regression was applied to MODIS fire products at variable spatial scales in GIS. Significance of change in fire frequency at each grid level was tested using t statistic. Spatial clustering of higher or lower fire incidences across study area was determined using Getis-OrdGi statistic. Maximum fire incidences were encountered in moist mixed deciduous forests (46%) followed by secondary moist bamboo brakes (30%). In most parts of the study area fire incidences peaked during March while in warmer parts (e.g. Mon district dominated by indigenous people) fire activity starts as early as during November and peaks in January. Regression trend analysis captured noticeable areas with statistically significant positive (e.g. Mokokchung, Wokha, Mon, Tuensang and Kiphire districts) and negative (e.g. Kohima and north-western part of Mokokchung district) inter-annual fire frequency trends based on area-based aggregation of fire occurrences at different grid sizes. Localization of spatial clusters of high fire incidences was observed in Mokokchung, Wokha, Mon,Tuensang and Kiphire districts.
1 INTRODUCTION
Fire is widely used in tropical land conversion and regrowth removal (Malingreau and Tucker, 1988, Eva and Lambin, 2000; Aragãoand et al., 2008). In past two decades, extensive forest clearing, agricultural intensification and recurrent drought have made the current level of fire incidence in the tropics a matter of international concern (Cochrane, 2003). Fire is a dominant man-made disturbance in slash and burn agriculture or “Jhum” areas in north-eastern region of India. Jhum represents a mixed cropping system with a fallow period of 3-10 years, traditionally practiced by the upland communities of north-east India. It accounts for largest spatial extent of biomass burning during the annual dry season (Badarinath et al., 2009). About 44,000 km2 of north-eastern region is affected by shifting cultivation with nearly 0.45 million families are dependent on it (Lele and Joshi, 2009). In recent times, the pattern of shifting cultivation has changed following decrease in fallow period (Ramakrishnan, 2001), increase in the area under settled agriculture and lengthening of dry season, which in turn has increased likelihood of spatial and temporal variations in fire frequency or rather increase in fire frequeny in the region. The use of fire has recently exacerbated due to increase in shifting cultivation in the moist deciduous forests (SFR, 2009).
The intensive fire activity results into increased emissions of greenhouse gases, reactive chemicals, and particles (Brasseur et al., 1999; Crutzen and Lelieveld, 2001), aerosol loading (Badrinath et al., 2004), leading to regional and global climate change (Harden, 2000), and affecting weather on much smaller scales (Andreae, 1991; Rosenfeld, 1999). Frequent fires may inhibit tree growth and the regeneration of successional vegetation into secondary forests, with potentially detrimental effects on soil fertility and above- and below-ground carbon sequestration (Muller et al., 2013). The information about the spatial and temporal trends in distribution of
forest fires is essential for sustainable land resources development, monitoring REDD+ activities (Muller et al., 2013), and assessment of contribution of forest fire emissions to global warming.
Satellite observations make detection and monitoring of forest fires possible in remote and inaccessible areas. The ability of remote sensing sensors to detect temperature analmoly from satellite platform coupled with high observation frequency has facilitated detection and monitoring of fire “hotspots” (Kaufman et al., 1998; Justice et al., 2006 ; GOFC-GOLD, 2009). Satellites can capture the time and location of actively burning fires at the time of the satellite overpass and thus provide an indication of the density of fire activity (Csiszar et al., 2006). The most effective sensors used for fire detection and charactersitaion from space have been NOAA-AVHRR (Martin, 1999), VAS/GOES (Prins, 1994), ERS and ENVISAT ATSR (Arino, 1998), TRMM-VIRS (Giglio et al., 2003), and MODIS on the EOS Terra and Aqua satellites (Giglio, 2003b). MODIS (Moderate Resolution Imaging Spectroradiometer) active fire detection (Csiszar et al., 2005) uses a contextual algorithm making use of the characterstics signature of the active fire at 400 nm and the brightness temperature difference between 400 and 1100 nm, looking for the pixels where these are substantially different from the background pixels. The data available from MODIS is now long enough (more than 13 years) to allow construction of the statistically significant trends with sufficient accuracy.
2 STUDY AREA
The study area is the Nagaland state (25°51´29´´- 26°45´40´´N and 94°09´25´´-95°14´48´´E)in the north-east India (Fig.1) covering an area of 16,579 km2. Administratively, Nagaland is divided into eleven districts namely Dimapur, Kohima, Mokokchung, Mon, Phek, Tuensang, Wokha, Zunheboto, Kiphire, Longleng, and Peren. Physiographically, it is characterized by small hill ranges running in north-south direction with intermediate valleys. Altitude ranges from 1,400 m to 3,840 m above msl.
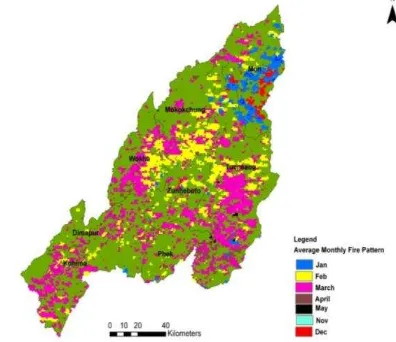
Fig.1. Study area location and forest types distribution in study area.
Climate is humid-tropical monsoon with pronounced dry season extending from December to April. Most of the rainfall (> 80%) occurs between June to September. Temperature in summer varies from 15° to 30°C and in winters <5° to 25°C. December is the coolest month of the year while May is warmest. Mean annual rainfall varies from 1,000 mm to 3,000 mm at different places. The forest cover constitutes 81.21% (13,464 km2) of the state total geographical area (SFR, 2009). The area is having Moist mixed deciduous, Sub-tropical wet hill, Subtropical pine, Wet temperate forests and Secondary moist bamboo brakes (Champion and Seth, 1968). Successional secondary forests in fragments constitute the larger chunk of forests, while some higher elevation ranges have primary forests. About 88.3% of the forests are owned by communities and individuals, and only 11.7% of the total recorded forests constitute government forests. Slash and burn agriculture continues to be the major type of agriculture practiced over ca. 9,17,087 ha in Nagaland employing an estimated 73% of the population (Census, 2011).The annually cultivated area (131,349 ha) comprises 58.95% of the total net cultivated area. In other areas, terraced rice cultivation or combined Jhum and terrace cultivation are practiced. Majority of fires are intentional and used for shifting cultivation, besides a small number of accidental fires, fire wood burning, agricultural residue burning etc. The state of Nagaland is part of Indo-Burma global biodiversity hotspot and is blessed with diverse species of flora and fauna.
3 MATERIALS AND METHODS
3.1 MODIS FIRE DATA
The active fire products (MOD14A2) derived from the terra/ Aqua MODIS satellite at 8-day intervals were downloaded from MODIS Data Processing System (MODAPS), National Aeronautics and
Space Administration (NASA) archive
(http://www.modaps.nascom.nasa.gov/services/). MODAPS generates pre-processed, quality-checked active fire data and is recommended by the FIRMS (Fire Information for Resource Management System (FIRMS) team for historical analysis (Muller and others 2013). A single tile covered the entire study area. A total of 1170 scenes of 8-day composite were downloaded for the periods 2001 to 2013. All scenes were ortho-rectified and 1 km2 spatial resolution.
MODIS fire detection algorithm automatically identifies pixels with one or more burning fires, known as fire pixels. MODIS can detect size of a fire much smaller than 1 km2 pixel size because the actively burning area is frequently below 1 km2 even in large fires (Muller et al., 2013).The size of detectable fires depends primarily on the fire temperature, fire area, vegetation cover and sensor viewing angle (Muller et al., 2013). The MODIS sensor can detect flaming fires (~1,000 Kelvin) as small as 100 m2 under ideal conditions with a 50% detection probability, and it can detect a 1,000-2,000 m2 smoldering fire (~600 Kelvin) (Kaufman et al., 1998; Gigolo et al., 2003; Hawbaker et al., 2008). The detection rates will be higher if the daily peak fire activity coincides with the time of satellite overpass (Schroeder et al., 2005).
3.2 ANCILLARY DATA
Variability in dry season rainfall can influence the intensity of slash and burn agriculture and consequently the number of fire incidences. Rainfall data is recoded at 15 meteorological stations by Soil and Water Conservation Department, Govt. of Nagaland. However, continuous rainfall records do not exists for most of the study years, therefore, rainfall data was primarily utilized to know drought conditions that prevailed in the years with extremes in fire occurrences. Distribution of active fire hotspots in different forest types was analyzed based on forest type map prepared by Forest Survey of India (FSI, 2011).
3.3 PREPROCESSING
Active fire products (MOD14A2) were changed from EOS-HDF to ERDAS Imagine native format (.img format). The original MOD14A2 images with sinusoidal projection were reprojected to UTM WGS 84/46N. We extracted the fire mask channels from MOD14A2 stacked product. From the extracted fire mask channels, fire pixels were extracted by applying conditional either if statement in ERDAS Imagine Model Maker.
3.4 INTRA-ANNUAL TRENDS OF FIRE OCCURRENCE
Monthly composite of active fire pixels were created by stacking the active fire pixels images of different months of all the thirteen years. Number of fire occurrences for each month-wise active fire pixel composite were calculated using cell statistics. Subsequently, monthly active fire pixels composite were superimposed to characterize inter-annual trends in fire occurrences across the study area.
3.5 INTER-ANNUAL TRENDS OF FIRE OCCURRENCE
labeled in the attribute fields. The vector look-up table was than subjected to time-series ordinary linear regression trend analysis to quantify trends in fire frequency for each grid size in ArcGIS software var. 10.10. The resulted map depicted the increase, decrease and no-change in fire frequency. The confidence level of the trends and significance levels attached with each grid cell was obtained according to the two-tailed student’s distribution. The significance levels were categorized into ±0.00, ±0.10, ±0.05, ±0.01, ±0.001 for better visualization and interpretation of trends in fire occurrence. Positive value of t statistic indicates the increase; zero no change while minus values represents decrease in forest fire incidences.
3.6 SPATIAL CLUSTERING OF FIRE OCCURRENCE
The spatial clustering of fire occurrences over the study area was analysed using the Getis-OrdGi statistic (pronounced G-i-star) using ArcGIS software var. 10.10. The resultant z-scores and p-values indicate where high or low fire occurrences cluster spatially. This analysis works by looking at each fire incidence within the context of neighboring fire incidences. A grid with a high value of fire incidence is interesting but may not be a statistically significant hot spot. To be a statistically significant hot spot, a grid will have a high fine incidence value and be surrounded by other grids with high fire incidences values as well. The local sum for a grid and its neighbors is compared proportionally to the sum of all grids; when the local sum is very different from the expected local sum, and that difference is too large to be the result of random chance, a statistically significant z-score results. High Z–score and small P-value for fire pixels indicates spatial clustering of high frequency fire incidences. Low Z-score and small p-value indicates spatial clustering of low frequency fire incidences. The higher (or lower) the Z-score, fire incidences form clustered patterns.
4 RESULTS
4.1 INTRA-ANNUAL TRENDS OF FIRE OCCURRENCE
Intra-annual fire frequency trends were studied using time series MODIS fire pixels over 13 years period in the study area. Fig. 1 shows the spatial distribution of fire pixels between years 2001-2013 in the study area. Most of fire pixels were encountered in Moist mixed deciduous forests (46%) followed by Secondary moist bamboo brakes (30%), Sub-tropical wet hill forest (11%) and less than 10 % combined in Subtropical pine and Wet temperate forests.
Fig. 2. Intra-annual trends of forest fires in Nagland (2001-2013). The total number of fire incidences during February and March (6,896) were 78% of the total of all the months of all the year i.e. 8,809.
Fig. 2 shows the intra-annual trends in forest fire in the study area. Number of fires counts plotted against months covering the entire year shows majority of fire pixels are distributed in the month of February and March.
Fig. 3 depicts the spatial distribution of monthly forest fire across different districts of Nagaland summed for 13 years. Early occurrence of fire was observed in Mon district where fire starts in December. Zunheboto district shows maximum fire occurrences in February whereas rest of the districts shows maximum fire occurrences in March. Fire incidences occurring in March are distributed over largest area, followed by February and January. Fire incidences during April and May were very few. Febrauary fire were widespread in the middle part of the state.
<Insert Fig. 3 here>
Fig. 3. Spatial distribution of monthly forest fires in Nagaland
(2001-2013).
The intra-annual trends in forest fire incidence indicate that fire activity in the study area starts from November month and last till the onset of the monsoon during April/May. Though February and March are the peak fire incidence months in the study area yet maximum fire incidences were counted in the March month in all the study years.
4.2 INTER-ANNUAL TRENDS OF FIRE OCCURRENCE
Fig.4 depicts the regression slopes in fire frequency across the study area during 2001-2013 at 3 km, 5km and 10 km grid sizes respectively. It was observed that choice of grid size affects the interpretation of trends in fire incidences.
Fig. 4. Regression slopes in fire incidencesat different grid sizes (a) 3 km, (b) 5 km, (c) 10 km. Color significance of trend regression slopes based on two-tailed student’s t distribution for changes in fire incidences over 2001-2013.
As evident from the fig. 4 and table 1, at all grid sizes, the number of grids showing positive trends in fire incidences were higher than grids with negative trends in fire incidences. Also at all grid sizes, the grids with significant positive fire incidences slopes ( p>0.10) were higher that significant negative fire incidences slopes, indicating that fire frequency have increased in most of the Nagaland from 2001 to 2013. Areas with zero negative slope primarily include major settlements, settled agriculture or remnant patches of primary forests. The areas with significant positive trends (p>0.10) were observed impart of Mokokchung,Wokha, Mon,Tuensang and Kiphire districts. The areas with significant negative trends (p>0.10) were observed in Kohima, north-western part of Mokokchung district. While fire trends in Dimapur, Zunheboto, Longleng and Peren were either constant or insignificant.
4.3 CLUSTERING OF FIRE OCCURRENCES
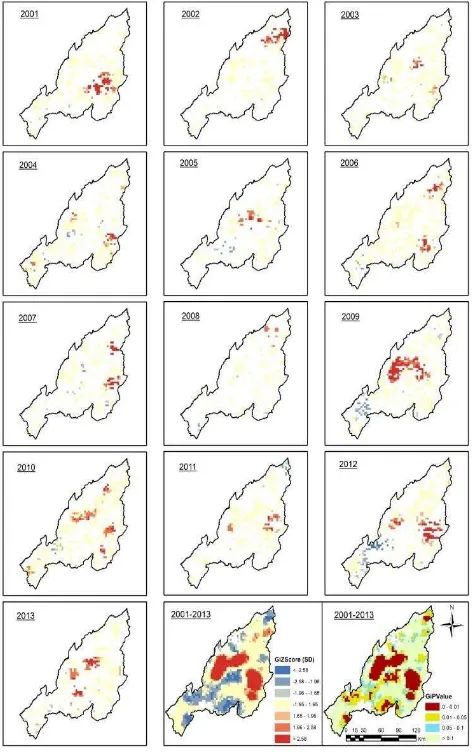
Fig. 5 shows estimated clustering probabilities of occurrence of fires in Nagaland state.
Fig. 5. Fire hotspots from 2001 to 2013 and level of confidence of clustering probabilities.
The fire incidences from 2001 to 2013 have exhibited a clustered spatial distribution noteworthy in moist deciduous forests. Clear pattern of fire aggregation (clusters) in Mokokchung,Wokha,
Mon,Tuensang and Kiphire districts may correspond to forest clearing for shifting cultivation. It is evident form Fig. 5 that year to year there is shift in high fire incidences hotspots in the study area however over the study period there is localization of higher fire incidence hotspots in the study area.
5 DISCUSSION
Majority of forest fire incidences in the tropics are attributed to the
practice of slash and burn agriculture. In south-east Asia trends in
fire incidences particularly in the slash and burn agriculture regions are not known. The slash and burn agriculture in India is mostly prevalent in the remote upland and tribal regions of the country. Ground-based inventories of fire occurrences and area burnt are not feasible in remote and inaccessible terrain. Therefore, use of time-series satellite remote sensing is probably the only way to get information about the clear cutting and fire activity in the forest areas. In this study the trends in fire seasonality in the slash and burn agriculture landscape of Nagaland state in north-east India between 2001 to 2013 were studied using MODIS active fire products.
From the results of time-series regression, it is revealed that increasing trends in fire frequency were mostly confined to the middle and northern part of the study area while decreasing trends were found towards the southern and western part of the study area. The increase in incidences of winter fire occurs in the northern districts e.g., Mon and Zuenheboto of Nagaland is largely due to reduced fallow cycle. Jhum is still the sole source of livelihood in Mon and Zuenheboto districts. Whereas, increase in fire frequency in the middle part of the study area could be due to shorter fallow cycle as well as increasing cases of accidental fires in recent years owing to prolonged drought years.
In recent years north-east India has witnessed increase in the frequency of deficient rainfall years. Nagaland, for example, in year 2010 and 2013 has witnessed delayed and less than normal rainy days. Intermittent dry seasons rains coupled with early monsoon reduces the probabilities of forest fires while delayed rainfall years observe higher fire incidences due to lengthening of shifting cultivation period.
Significant increase in the frequency of fire incidences were observed during the extreme drought years in tropical regions
(Araga˜oet al., 2007; Alencar, 2006; Langner and Siegert, 2009).
For example: fire-affected area was on average three times larger
than during normal weather conditions in Borneo (Langner and
Siegert, 2009). Decreased in deforestation rates while increased fire
frequency was observed for Amazon between 2000-2007 when deforestation and fire trends were related at 0.25° by 0.25° grid size
(Luiz and Shimabukuro, 2010). The study results that leakage of fires from farms adjacent to growing proportion of degraded forests is the reason for increase in number of fire incidences, has relevance for Nagaland as well which is also facing similar situation.
Year-wise analysis of spatial clusters of high or low fire incidences indicated shift in spatial clusters in different years. However, over the study period, localization of spatial clusters of high fire incidences was observed in Mokokchung, Wokha, Mon,Tuensang and Kiphire districts.
Several spatial clustering metrices e.g., semivariogram, kernel estimation, k-mean, spatial scan statistic (Vadrevu, 2008), Moran I index (Avila et al., 2010a) and Getis-Ord G-statistic (Pompa-García and Montiel-Antuna, 2012) have been used to quantify forest fire clustering both due to natural and anthropogenic causes. Among these, G-statistic has been found most effective in locating wildfire cluster in Durango, México and in monitoring local behavior of fire (Pompa-García and Montiel-Antuna, 2012) as it is more sensitive to high clusters of fire than low ones. Though in this study broad pattern of intensification of shifting cultivation based on fire activity data have been characterized, yet identification of plausible reasons for the positive and negative changes in fire frequency and underlying mechanism for the spatially cultured fires needs in-depth investigations on deforestation patterns, socio-economic changes and climatic variability.
Increasing incidences of forest fires have serious environmental and economic implications for slash and burn agriculture regions. North-east India is a biodiversity hotspot and increased risk of fire can make the region more vulnerable to climate change. Studies have found significant linkages between biomass burning in slash and burn areas of north-east India and atmospheric aerosol loading
(Badarinath et al., 2009). Increase in fire activity emits more
aerosols in atmosphere which can have implications for regional
weather systems (Rosenfeld, 1999). Significantly lower
concentration of nitrogen was observed in shorter fallow cycle as compared to longer one (Mishra and Ramakrishnan, 1983). It was suggested that severe burning of soil in shorter fallow cycle causes excessive degree of volatization of minerals and lead to decline in concentration of nutrient at the surface layers. Frequent fire activity arrest the natural course of vegetation succession, as results existing early colonizers species (e.g. bamboo spcecies, weeds) dominate the system under the influence of retrogressive succession which make the area prone to fires. Shortening of fallow cycle enhances fire recurrence and aggravate area under weed and lead to the loss of soil fertility following severe burning. Further, higher rate of biomass burning causes more emission of CO2 this might jeopardize the benefits accruing to the shifting cultivators from reducing emissions from deforestation and degradation under REDD plus. In such situation, unless the information on changes fire seasonality are considered under the Monitoring Review and Verification (MRV) process of REDD+ programs, their perceived outcomes would remain unrealized.
Most of the forest land in Nagaland is owned by the indigenous people. Although tribes practicing shifting cultivation had developed traditions of community-based fire management systems, yet in recent decades there had been changes in traditional use of fire because of changing demography, social values, resource competition and globalisation. The state government which so far have little role in regulating shifting cultivation activities, their intervention can improve the community-fire managements. Areas with reduced fallow period and other fire incidences, represents forests under various stages of degradation causing leakage of fire during summers, leading to incidences of accidental fires. Strengthening of community-based fire
management system, alternative livelihood oppurtunities and effective treatment of fuel loaded fire prone environment is important. Limiting the incidences of fires in clear-cut patches and checking their spread to adjacent areas is crucial. The shifting cultivators should be educated about the potential financial benefits of limiting fire incidences under REDD-Plus.
Present study has some limitations and uncertainties on the account of coarse resolution of MODIS fire products (1 km2 spatial resolution) and relatively shorter duration of time-series data. MODIS fire produts are prone to omission as well as false detection of fires. For example, cloud can obstructs fire detection causing omission of fire incidences, more profoundly in tropics. In Nagaland fire activity occurs primarily occur during the dry season (between December and April) therefore cloud effect is negligible. Omission of fire incidences may occur due to large revisit interval. Fires incidences which set after the overpass of satellite and extinguish before the next overpass are omitted. Shifting cultivation employ small extent fires, less than 1 km2 in size, therefore the fire pixels detected are lower than actual fires. False fire pixels may arise due to strong canopy surface temperature differences because of recent clearings and occurrence of homogeneous dark char patches from recent burnings (Schroeder et al., 2008). The same fire continuing for several days may accounts for more number of fire incidences as biomass burning may take time due the presence of moisture. Further, clustered pattern of fires in a shifting cultivation area represents the occurrence of many different smaller fires, contrary to areas where a single severe natural fire can spread over large geographical area and may last for several days.
Because of shorter duration (13 years) of time-series data, analysis was not carried out at the original resolution of time-series datasets rather we resorted to derivation of statistically significant positive and negative trends in fire frequency at a coarse scale following an area-based aggregation of fire occurrences over study area. Area-based aggregation at appropriate scale is a useful way for deciphering meaningful trends from time-series analysis (Luiz and Shimabukuro, 2010).
The question whether fire trends from MODIS products also indicate the deforestation trends in slash-burn landscape, Portillo-Quintero et al. (2013) have found no overall correlation between the frequency of fires reported by the MODIS Active Fire Mapping product and forest cover change in Neotropical dry forests. In this study, fire trends deduced from 3 km x 3 km grid size were most closely related with dynamics of shifting cultivation in the area. For example, increase in fire incidences in Mon districts is largely attributed to higher rate of deforestation (e.g., Mon district has 5-6 year hum cycle (Padalia et al., unpublished). It shows that a map
showing fire clusters may indicate ‘hotspots’ of deforestation at
regional scale. It was noticed that larger grid sizes (5 and 10 km) does lead to precentage increase in grids with significant positive and negative slopes, but it also causes erroneous negative trends due inclusion of increasing proportion of non-forest area and outside area into the boundary pixels.
6 CONCLUSION
changes taking places slash and burn agriculture in one the most affected states in north-east India. Time series regression in GIS has highlighted the trends in fire use patterns across space and time in Nagaland and identified areas subjected to increased or decreased use of fire primarily for shifting cultivation. An approach has been presented to identify fire frequency spatio-temporal patterns using time-series satellite data. Statistically significant positive fire frequency trends were observed in Mokokchung,Wokha, Mon,Tuensang and Kiphire districts while negative fire frequency trends were observed in Kohima, north-western part of Mokokchung district. Study reports increase in fire incidences in Nagaland due to prevalence of drought like conditions in recent years. Study would be useful for understanding the trends of fire use in slash and burn agriculture and taking up actions for arresting increasing incidences of fires. The methodology presented for deducing statistically significant spatial-temporal trends in fire incidences in the present study may be adopted by the Forest Survey of India, which utilizes MODIS hotspot products for monitoring forest fire vulnerability over India.
ACKNOWLEDGEMENT
We would like to thank Director, Indian Institute of Remote Sensing, Dean (Academics), and Head, Forestry and Ecology Department, IIRS Dehradun for continuous encouragement and support.
REFERENCES
Alencar, Ane, Daniel Nepstad, Mariadel Carmen Vera Diaz, 2006. Forest Understory Fire in the Brazilian Amazon in ENSO and Non-ENSO Years: Area Burned and Committed Carbon Emissions. Earth Interactions, 10, pp. 1–17.
Araga˜o, LEOC, Malhi, Y., Roman-Cuesta R.M., Saatchi, S., Anderson LO and Shimabukuro YE, 2007. Spatial patterns and fire response of recent Amazonian droughts. Geophysical Research Letter, 34, L07701.
Aragão LEOC, Malhi, Y., Barbier, N., Lima, A., Shimabukuro, Y., Anderson, L., and Saatchi, S., 2008. Interactions between rainfall, deforestation and fires during recent years in Brazilian Amazonia. Philosophical Transection of Royal Society of Britain,
363,pp.1779-1985
Arino, O.,1998. The Along track Scanning Radiometer (ATSR) Fire Product of Indonesia. Iffn, UNECE and FAO (eds).
Avila, F. D., Pompa, G. M. and Vargas, P. E., 2010. Spatial analysis of fire occurrence in the Durango State. Revista Chapingo. Serie Ciencias Forestales, 16(2), pp. 253–260.
Andreae, M.O., 1991. Biomass burning: its history, use and distribution and its impact on the environmental quality and global climate. Levine J S (Ed.), Global Biomass Burning, pp 3-21, MIT Press, Cambridge, Mass.
Badarinath, K.V.S., Latha, K. M., Chand, T.R.K., Gupta, P.K., Ghosh, A.B., Jain, S.L., Gera, B.S., Singh, R., Sarkar, A.K., Singh, N., Parmar, R.S., Koul, S., Kohli, R., Nath Shambhu,Ojha V.K., and Singh, Gurvir, 2004. Characterization of aerosols from
biomass burning––a case study from Mizoram (Northeast), India.
Chemosphere, 54,pp.167–175.
Badarinath, K.V.S., Latha, M.K., Kiran Chand, T.R.K., and Gupta, P.K., 2009. Impact of biomass burning on aerosol properties over tropical wet evergreen forests of Arunachal Pradesh, India.
Atmospheric Research, 91,pp. 87–93.
Brasseur, G.P., Orlando, J.J. and Tyndall, G.S., 1999. Atmospheric Chemistry and Global Change, Oxford University Press, New York.
Census of India, 2001. District Census Hand Book Nagaland.
Champion, H.G., Seth, S.K., 1968. Revised survey of the forest types of India. Manager of Publications, New Delhi, India
Cochrane, M. A., 2003. Fire science for rainforests. Nature, 421,pp. 913-19.
Crutzen, P.J., Lelieveld, J., 2001. Human impacts on atmospheric chemistry. Annual Review Earth and Planetary Sciences, 29,pp. 17
– 45.
Csiszar, I., Denis, L., Giglio, L., Justice, C.O., Hewson, J., 2005. Global fire activity from two years of MODIS data.
International Journal of Wildland Fire, 14(2),pp.117-130.
Csiszar, I.A., Morisette, J.T., and Giglio, L., 2006. Validation of active fire detection from moderate-resolution satellite sensors: the MODIS example in northern Eurasia. IEEE Transections on Geosciences and Remote Sensing, 44, pp.1757-1764.
Eva, H. and Lambin, E. F., 2000. Fires and land-cover change in the tropics: a remote sensing analysis at the landscape scale. Journal of Biogeography, 27(3), pp.765–776.
FSI, 2011. Atlus forest types of India, Forest Survey of India, MoEF, Dehradun, India
Giglio, L., Descloitres, J., Justice, C.O., and Kaufman, Y.J., 2003. An Enhanced Contextual Fire Detection Algorithm for MODIS.Remote Sensing of Environment, 87,pp. 273–282.
Giglio, L., Kendall, J.D. and Mack, R., 2003. A multi-year active
fire data set for the tropics derived from the TRMM VIRS.
International Journal of Remote Sensing, 24,pp.4505–4525.
GOFC-GOLD, 2009. A Sourcebook of Methods and Procedures for Monitoring and Reporting Anthropogenic Greenhouse GasEmissions and Removals Caused by Deforestation, Gains and Losses of Carbon Stocks in Forests Remaining Forests, andForestation. Natural Resources Canada, Alberta, Canada.
Harden, J.W., Trumbore, S.E., Stocks, B.J., Hirsch, A., Gower, S.T., O'Neill, K.P. and Kasischke, E.S., 2000. The role of fire in the boreal carbon budget. Global Change Biology, 6,pp.174-184.
Hawbaker, T.J., Radeloff, V.C., Syphard, A.D., Zhu, Z., and Stewart, S.I., 2008. Detection Rates of the MODIS Active Fire Product in the United States. Remote Sensing of Environment,
Justice, C., Giglio, L., Boschetti, L., Roy, D., Csiszar, I., Morisette, J., Kaufman, Y., 2006. MODIS Fire Products AlgorithmTheoretical Background Document.http://modis-fire.umd.edu/ BA_usermanual.html , Accessed 10 May 2013
Kaufman, Y.J., Justice, C.O., Flynn, L.P., Kendall, J.D., Prins, E. M., Giglio, L., Ward, D.E., Menzel, W.P. and Setzer, A.W.,1998. Potential Global Fire Monitoring from EOS-MODIS. Journal of Geophysical Research, 103,pp. 32215–32238.
Langner, A., Siegert, F., 2009. Spatio-temporal fire occurrence in Borneo over a period of 10 years. Global Change Biology,
15,pp.48-62.
Lele, N., Joshi, P.K., 2009. Analyzing deforestation rates, spatial forest cover changes and identifying critical areas of forest cover changes in north-east India during 1972-1999. Environment Monitoring and Assessment, 156, pp.159-170.
Luiz, E.O., Aragão, C., Shimabukuro, Y.E., 2010. The Incidence of Fire in Amazonian Forests with Implications for REDD, Science,
328 (5983 ), pp.1275-1278.
Malingreau, J.P. and Tucker, C.J., 1988. Large-scale deforestation in the southeastern Amazon basin of Brazil. Ambio, 17,pp.49–55.
Martin, M.P., Ceccato, P., Flasse, S., Downey, I., 1999. Fire detection and fire growth monitoring using satellite data. In: Chuvieco E (ed) Remote sensing of large wildfires in the European Mediterranean Basin, Springer-Verlag, Berlin, pp 101 –122
Mishra, B.K., Ramakrishnan, P.S.,1983. Slash and burn agriculture at higher elevation of Northeastern India, II Soil fertility changes, Agri Ecosystem and Environ, 9-83-96. Cited by R.E. de la Cruz and N.J. Vergara Productive and ameliorative roles of agroforestry. An overview of agroforestry in Humid tropics, pp.18-19.
Müller, D., Suess, S., Hoffmann, A.A., and Buchholz, G., 2013. The Value of Satellite-Based Active Fire Data for Monitoring, Reporting and Verification of REDD+ in the Lao PDR. Human Ecology, 41,pp.7-20.
Pompa-García, M., and Montiel-Antuna, E., 2012. Fire Ignition Trends in Durango, México, In: Clement A. Okia (ed.), Global Perspectives on Sustainable Forest Management, 191-204. ISBN 978-953-51-0569-5
Portillo-Quintero, C., Sanchez-Azofeifa, A., Espirito-Santo, MMdo, 2013. Monitoring deforestation with MODIS Active Fires in Neotropical dry forests: An analysis of local-scale assessments in Mexico, Brazil and Bolivia. Journal of Arid Environment 97, pp.150-159.
Prins, E.M. and Menzel, W.P., 1994. Trends in South American biomass burning detected with the GOES visible infrared spin scan radiometer atmospheric sounder from 1983 to 1991. Journal of Geophysical Research, 99, pp.16719-16735.
Ramakrishnan, P.S., 2001. Ecology and Sustainable Development, National Book Trust, New Delhi, India.
Rosenfeld, D.,1999. TRMM observed first directevidence of smoke from forest fires inhibiting rainfall. Geophysical Research Letters, 26 (20),pp. 3105-3108.
Schroeder, W., Morisette, J.T., Csiszar, I., Giglio, L., Morton, D., and Justice, C.O., 2005. Characterizing Vegetation Fire Dynamics in Brazil through Multisatellite Data: Common Trends and Practical Issues. Earth Interactions, 9,pp.1–26.
Schroeder, W., Prins, E., Giglio, L., Csiszar, I., Schmidt, C., Morisette, J., and Morton, D., 2008. Validation of GOES and MODIS Active Fire Detection Products using ASTER and ETM+ Data. Remote Sensing of Environment, 112 : 2711–2726.
State of Forest Report, 2009. Forest Survey of India, Ministry of Environment and Forest, Dehradun, India
Vadrevu, K. P., 2008. Analysis of fire events and controlling factors in eastern india using spatial scan and multivariate statistics.