SPATIAL DYNAMICS OF DEFORESTATION AND FOREST
FRAGMENTATION (1930-2013) IN EASTERN GHATS, INDIA
C. Sudhakar Reddy*, C. S. Jha, V. K. Dadhwal
National Remote Sensing Centre, Indian Space Research Organisation, Balanagar, Hyderabad - 500037, India
([email protected], [email protected], [email protected])
Commission VIII, WG VIII/7
KEY WORDS: Deforestation, Fragmentation, Conservation, Remote sensing, GIS, Eastern Ghats, India
ABSTRACT
The tropical forests are the most unique ecosystems for their potential economic value. Eastern Ghats, a
phytogeographical region of India has rugged hilly terrain distributed in parts of five states, viz. Odisha, Andhra
Pradesh, Telangana, Karnataka and Tamil Nadu. The present study is mainly aimed to analyse the trends in
deforestation and its role in forest fragmentation of Eastern Ghats. The long term changes in forest cover with its spatial
pattern over time has been assessed by analyzing a set of topographical maps and satellite remote sensing datasets. The
multi-source and multi-date mapping has been carried out using survey of India topographical maps (1930’s), Landsat
MSS (1975 and 1985), IRS 1B LISS-I (1995), IRS P6 AWiFS (2005) and Resourcesat-2 AWiFS (2013) satellite
images. The classified spatial data for 1930, 1975, 1985, 1995, 2005 and 2013 showed that the forest cover for the
mentioned years are 102213 km2 (45.6%), 76630 (34.2%), 73416 km2 (32.7%), 71730 km2 (32%), 71305 km2 (31.8%) and 71186 km2 (31.7%) of the geographical area of Eastern Ghats respectively. A spatial statistical analysis of the deforestation rates and forest cover change were carried out based on distinctive time phases, i.e. 1930-1975,
1975-1985, 1985-1995, 1995-2005 and 2005-2013. The spatial analysis was carried out first by segmenting the study area
into grid cells of 5 km x 5 km for time series assessment and determining spatial changes in forests. The distribution of
loss and gain of forest was calculated across six classes i.e. <1 km2, 1-5 km2, 5-10 km2, 10-15 km2, 15-20 km2 and >20 km2. Landscape metrics were used to quantify spatial variability of landscape structure and composition. The results of study on net rate of deforestation was found to be 0.64 during 1935 to 1975, 0.43 during 1975-1985, 0.23 during
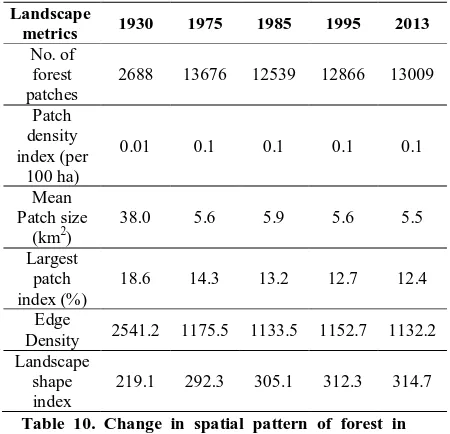
1985-1995, 0.06 during 1995-2005 and 0.02 during 2005-2013. The number of forest patches increased from 2688 (1930) to
13009 (2013). The largest forest patch in 1930 represents area of 41669 km2 that has reduced to 27800 km2 by 2013. Thus, it is evident that there is a substantial reduction in the size of the very large forest patches due to deforestation.
According to spatial analysis, among the different land use change drivers, agriculture occupies highest area, followed
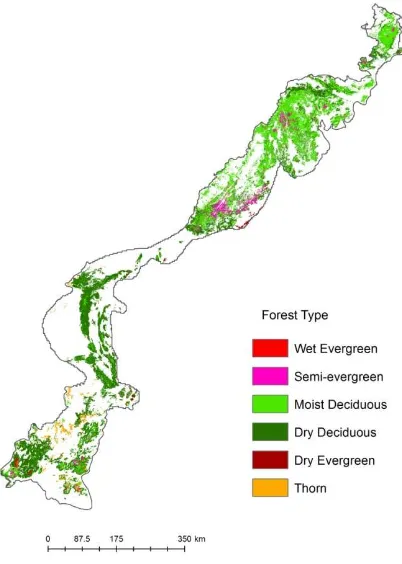
by degradation to scrub and conversion to orchards. The dominant forest type was dry deciduous which comprises
37192 km2 (52.2%) of the total forest area of Eastern Ghats, followed by moist deciduous forest (39.2%) and semi-evergreen forest (4.8%) in 2013. The change analysis showed that the large scale negative changes occurred in
deciduous forests and semi-evergreen forests compared to wet evergreen forests due to high economic potential and
accessibility. This study has quantified the deforestation that has taken place over the last eight decades in the Eastern
Ghats. The decline in overall rate of deforestation in recent years indicates increased measures of conservation. The
change analysis of deforestation and forest fragmentation provides a decisive component for conservation and helpful
1. INTRODUCTION
Changes in forest cover have impacts on biodiversity, carbon stock, soil, global climatic systems and livelihoods of dependent people. The tropical forests are the most unique ecosystems for their immense value for timber, fuel wood, food and medicine. Now, there is a consensus that most of the tropical forest ecosystems are experiencing threat due to disturbances driven by deforestation, forest degradation and fragmentation. The global gross forest cover loss was reported to be 0.6% per year during 2000 to 2005 (Hansen et al. 2010). The rate of deforestation was reported as 3 Mha per year between 1990 and 2000 and of 6 Mha per year between 2000 and 2005 (FAO, 2012).
Satellite remote sensing has established its use to study historical forest cover changes and relate such changes to environmental and human factors (Reddy et al. 2013a). The application of satellite imagery for forest cover mapping has increased greatly over the past decade for various purposes at local to global levels (Fearnside & Barbosa, 2004). The review analysed the gross and net deforestation rates and sum up the Government initiatives for conservation of forests in India (Reddy et al., 2013a). Reddy et al., and found large scale deforestation during 1930-1975 period. The study based on long term forest cover change analysis in Nilgiri biosphere reserve has indicated conservation effectiveness under the ongoing forest management practices (Satish et al. 2014). In contrast to short period forest change, long term datasets need to integrate data from large scale historical topographical maps and recent remote sensing datasets.
A recent study defined forests as tree cover and included plantations in the quantification of forest loss (Hansen et al. 2013). It is critically important to know the context of forest loss, whether of a natural forest or a plantation (Margano et al. 2014). The Forest Survey of India defines forest cover as ‘all lands more than one hectare in area, with a tree canopy density of more than 10%, irrespective of ownership and legal status’ (FSI, 2011). Thus forest cover as reported by FSI does not make any distinction between natural or manmade forests, thereby including all plantations and orchards. India could be potentially under-reporting deforestation by reporting only the gross forest changes at the national and state levels (Ravindranath et al. 2014). Thus, there is need for a new approach for monitoring and reporting of forest area, to meet the challenges of biodiversity and forest conservation. In the present study forest is a ‘land spanning more than 1 ha, dominated with natural tree vegetation with an overstorey canopy cover greater than 10%’. The
present study considers deforestation as replacement of natural forest by other land use and/or depletion of natural forest crown cover to less than 10%.
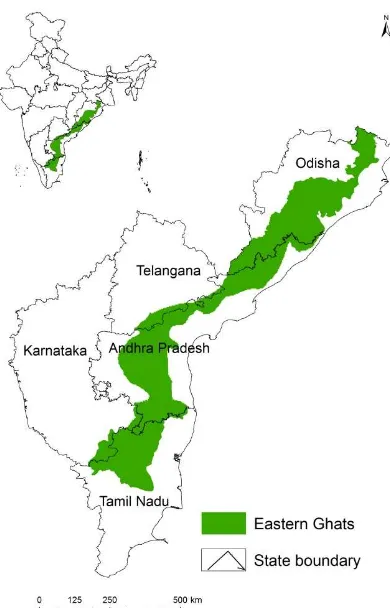
The main objective of this study is to map and analyse the deforestation in the Eastern Ghats of India. The India forming a chain of isolated hill ranges along the east coast harbour tropical forests. The Eastern Ghats extending over 1750 km with average width of about 100 km and extends from 1005’ to 2230’N latitude and 7623’ to 8650’E longitude. The physical feature of the Eastern Ghats, provided by the hills raising from almost 100 m mean seal level to about 1572 m altitude. The Eastern Ghats are geologically older than Himalayas and Western Ghats. Several large rivers like Mahanadi, Godavari, Krishna, Pennar and Kauveri cut the Eastern Ghats into discontinuous blocks of hills. It covers parts of five states, viz. Odisha, Andhra Pradesh, Telangana, Karnataka and Tamil Nadu (Figure 1).
Eastern Ghats of Odisha are found in Phulbani, Boudh, Gajapati, Rayagada, Malkangiri and parts of Mayurbhanj, Keonjhar, Balasore, Jajpur, Angul, Dhenkanal, Cuttack, Khurda, Nayagarh, Ganjam, Nawarangpur, Koraput and Kalahandi districts. The north region of the Mahanadi river covering Mayurbhanj (Similipal) and the adjoining territory with the Malayagiri peak (1277m) and Meghasani peak (1165m) forms the northern most section of Eastern Ghats (Meher-Homji, 2001).
Figure 1. Location map of Eastern Ghats, India
2.2. Spatial Data
In the study, we attempted to create spatial database of forest cover from the topographical map records and satellite remote sensing data. This will be achieved by conducting a time series analysis based on multi-source and multi-temporal data for 1930, 1975, 1985, 1995, 2005 and 2013. The IRS data have been acquired from NRSC Data Centre, Hyderabad, India. Data sources have been summarised in Table 1. Survey of India Topographical maps pertains to 1950-1960’s period was used in the gap areas of survey for the 1930’s period. Visual interpretation technique was used to map forest cover from topographical maps. The images were georeferenced to the WGS84 datum. The contrast enhancement and vegetation index techniques are being used in image processing. Hybrid classification technique was used in mapping of forest cover and forest types using remote sensing data of corresponding period. The main advantage of using this technique, rather than classifying all images independently, is to minimise the changes that are associated with sensor differences as well as with phenological, atmospheric and topographic variability.
Type Period Scale/
*Scale for topographical maps; spatial resolution for satellite datasets;
Table 1. Historical maps and satellite datasets used in the study
2.3. Rate of Deforestation
The annual rate of forest cover change was calculated using compound interest formula (Puyravaud, 2003).
= 1 covered by forest was estimated and the change (1930-1975, 1975-1985, 1985-1995, 1995-2005, 2005-2013) was evaluated. Spatial change in forest cover was quantified across the six classes i.e. <1 km2, 1-5 km2, 5-10 km2, 10-15 km2, 15-20 km2 and >20 km2.
2.5. Forest fragmentation
Forest patches were grouped under nine classes i.e. <1 km2, 1-10 km2, 10-50 km2, 50-100 km2, 100-500 km2, 500-1000 km2, 1000-2000 km2, 2000-5000 km2 and >5000 km2. Landscape metrics have been used to analyse spatial variation and pattern of landscape level fragmentation. For this purpose, six landscape metrics were selected and calculated using Fragstats, ArcGIS and Excel (McGarigal et al., 2002; Reddy et al. 2013c).
2.6. Accuracy assessment
1995, 2005 was done based on visual assessment and the temporal consistency of ground control points.
3. RESULTS AND DISCUSSION
The results provide quantitative account of spatial distribution of forest cover, rates of deforestation and trend of forest fragmentation in Eastern Ghats.
3.1 Major changes in forest cover
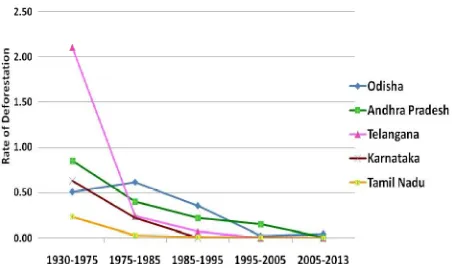
The spatial database for 1930, 1975, 1985, 1995, 2005 and 2013 showed that the forest cover for the mentioned years are 102213 km2 (45.6%), 76630 (34.2%), 73416 km2 (32.7%), 71730 km2 (32%), 71305 km2 (31.8%) and 71186 km2 (31.7%) of the geographical area of Eastern Ghats respectively. The net forest cover decline in Eastern Ghats was found to be 31027 km2 (30.4% of the total forest) during 1930 to 2013. The forest cover loss during 1930 to 1975 is estimated as 25584 km2 followed by 3213 km2 during 1975 to 1985 and 1686 km2 during 1985 to 1995. The area was very high in Eastern Ghats of Telangana with forest cover loss of 62.4% of area, followed by 36.9% in Eastern Ghats of Andhra Pradesh, 28.2% in Eastern Ghats of Odisha, 26.3% in Eastern Ghats of Karnataka and 10.3% in Eastern Ghats of Tamil Nadu. The Eastern Ghats of Odisha represents highest forest cover (44.1%), followed by Eastern Ghats of Andhra deforestation found to be 0.64 during 1935-1975, 0.43 during 1975-1985 and 0.23 during 1985-1995 and 0.06 during 1995-2005.The annual deforestation rate was very least (0.02) during recent period (2005-2013) indicate management intervention in protection of forests (Table 3). Analysis of rate of deforestation in different parts of Eastern Ghats indicates Telangana, Karnataka and Tamil Nadu are successful in protection of forests since 1995 (Figure 2). But, in the
past (1930-1975) rate of deforestation was very high in Eastern Ghats of Telangana (Table 4).
Period 1975 1985 1995 2005 2013
Period Odisha Andhra
Pradesh Telangana in different parts of Eastern Ghats
Figure 2. Annual net rate of deforestation in different parts of Eastern Ghats
Figure 3. Forest cover map of Eastern Ghats: 1930
Figure 4. Forest cover map of Eastern Ghats: 1975
Figure 5. Forest cover map of Eastern Ghats: 1995
Size class
(km2) 1930 1975 1985 1995 2005 2013
<1 521 763 765 767 770 772
1-5 875 895 944 964 971 971
5-10 848 840 863 874 877 881
10-15 937 787 813 840 849 850
15-20 1088 966 979 979 984 980
>20 2781 1846 1677 1581 1552 1549
Total 7050 6097 6041 6005 6003 6003
Table 5. Grid wise distribution of forest cover in Eastern Ghats
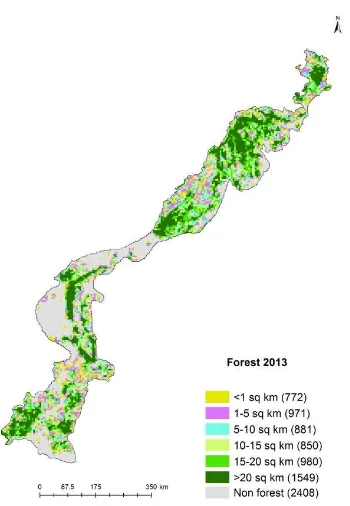
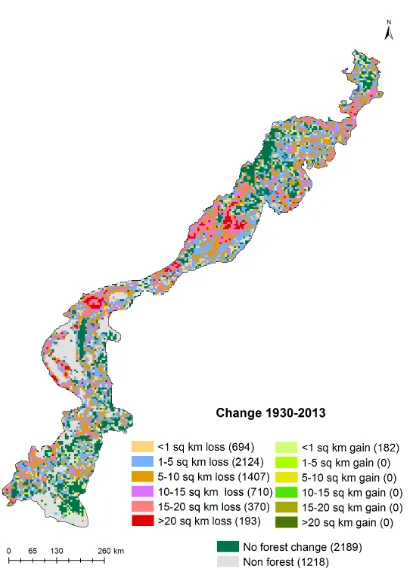
4.4. Grid wise analysis of forest cover change Spatial analysis indicates that highest number of grids has undergone negative changes during 1930-1975, 1975-1985 and 1985-1995 (Table 6). Forest cover change map of 1930-2013 is presented in Figure 7. Total 182 grids have shown gain of forest cover during 1930-2013. The unchanged grids increased from 1930-1975 to 2005-2013. About 5903 grids have not undergone any change in forest cover during 2005-2013, while only 1771 grids are showing indication of unchanged during 1930-1975. Overall 5215 grids have shown negative change during 1930-1975, 1720 grids during 1975-1985, 1396 grids during 1985-1995, 192 grids during 1995-2005 and 100 grids during 2005-2013.
Size class (km2)
1930-1975
1975-1985
1985-1995
1995-2005
2005-2013
<1 763 792 898 76 100
1-5 2160 779 471 95 0
5-10 1260 126 25 20 0
10-15 585 22 1 1 0
15-20 300 1 1 0 0
>20 147 0 0 0 0
Total 5215 1720 1396 192 100
Table 6. Analysis of grid-wise negative changes in Eastern Ghats
Figure 7. Forest cover change map of Eastern Ghats: 1930 to 2013
4.5. Major changes in forest types
Forest
Figure 8. Forest type map of Eastern Ghats: 2013
4.6. Land use in deforested areas
Agriculture occupies highest deforested area, followed by degradation to scrub and conversion to orchards. About 17443 km2 of agricultural area increased over a period of eight decades due to deforestation (Table 8). An area of 677 km2 of forest was submerged due to construction of dams during the study period.
Land use 1930-
Table 8. Land use in deforested areas (area in km2)
4.7. Variation in Forest patches
The number of forest patches increased from 2688 (1930) to 13009 (2013). The very largest forest patch in 1930 represents area of 41669 km2 has reduced to 27800 km2 by 2013. Thus it is evident that there is a substantial reduction in the size of the very large forest patches due to deforestation. The number of <1 km2 patches are 1856 in 1930, 12846 in 1975, 11628 in 1985, 11927 in 1995, 11989 in 2005 and 12066 in 2013. It was determining extinction of 1218 small forest fragments (<1 km2) during 1975 to 1985 due to severe anthropogenic pressure (Table 9).
Patch
Table 9. Size class distribution of forest patches
4.8. Spatial configuration of forest
Landscape 1930, 1960, 1975, 1985, 1995 and 2013
4.9. Accuracy assessment
Accuracy assessment was made for the classified map of 2013. The overall classification accuracy of the forest cover map of 2013 was 92.8% and kappa value was 0.89. The accuracy of previous years has been evaluated visually based on the temporal consistency of field sample points.
5. Conclusions
The results exhibit a large scale forest loss between 1930 to 1975 and 1975 to 1985 in the Eastern Ghats. The decline in overall rate of deforestation in recent years indicates increased measures of conservation. However, forest degradation and small-scale deforestation still continue for the need of fuel wood, fodder, timber products and shifting cultivation in parts of Eastern Ghats. The geospatial database generated will prove to be a comprehensive baseline for the long term conservation planning and management of natural resources of Eastern Ghats.
Acknowledgements
The present work has been carried out as part of ISRO's National Carbon Project. The authors are grateful to ISRO-DOS Geosphere Biosphere Programme for financial support.
References
Champion, H.G. and Seth, S.K., 1968. A revised survey of the forest types of India. Manager of Publications, Delhi.
FAO, 2012. State of the world’s forests. Rome.
Fearnside, P. M., and Barbosa, R. I. 2004. Accelerating deforestation in Brazilian Amazonia: towards answering open questions. Environ. Conserv., 31, 7-10.
FSI, 2011. India State of Forest Report, Forest Survey of India, Dehra Dun.
Hansen, M. C. et al. 2013. High-resolution global maps of 21st-century forest cover change. Science 342, 850-853.
Hansen, M.C., Stehman, S.V. and Potapov, P.V. 2010. Quantification of global gross forest cover loss. Proceedings of National Academy of Sciences, USA, 107, 8650-8655.
Harikrishna, P., Saranya, K.R.L., Reddy, C.S., Jha, C.S. and Dadhwal, V.K. 2014. Assessment and monitoring of deforestation from 1930’s to 2011 in Andhra Pradesh, India using remote sensing and collateral data. Curr. Sci., 107(5), 867-875.
Margono, B.A., Potapov, P.V., Turubanova, S., Stolle, F. and Hansen, M.C. 2014. Primary forest cover loss in Indonesia over 2000–2012. Nature Climate change, DOI: 10.1038/NCLIMATE2277.
McGarigal, K., Cushman, S.A., Neel, M.C. and Ene, E.2002.FRAGSTATS:www.umass.edu/landeco/resear ch/fragstats/.html.
Meher-Homji, V.M. 2001. Bioclimatology and Plant Geography of Peninsular India, Scientific Publishers. Jodhpur.
Puyravaud, J.P. 2003. Standardizing the calculation of the annual rate of deforestation. Forest Ecol. Manage., 177, 593-596.
Ravindranath, N. H., Murthy, I. K., Priya, J., Upgupta, S., Mehra, S. and Nalin, S. 2014. Forest area estimation and reporting: implications for conservation, management and REDD+. Curr. Sci., 106(9), 1201-1206.
Reddy, C.S., Dutta, K. and Jha, C.S. 2013a. Analysing the gross and net deforestation rates in India. Curr. Sci., 105(11), 1492-1500.
Reddy, C.S., Jha, C.S. and Dadhwal, V.K. 2013b. Assessment and Monitoring of long- term Forest cover changes in Odisha, India using Remote sensing and GIS. Environ. Monit. Assess., 185, 4399-4415.
Reddy, C.S., Sreelekshmi, S., Jha, C.S. and Dadhwal, V.K. 2013c. National Assessment of Forest Fragmentation in India: Landscape indices as measures of the effects of fragmentation and forest cover change. Ecol. Eng., 60, 453-464.