Summary To determine the effects of salinity on relative growth rate (RGR), net assimilation rate on a leaf weight basis (NARw), leaf weight ratio (LWR), and nutrient uptake and utilization of citrus, we grew four citrus rootstocks (sour or-ange, Cleopatra mandarin, Carrizo citrange and Citrus macro-phylla) in nutrient solutions containing 0, 10, 20, 40 or 80 mM NaCl for 20, 40 or 60 days. For each element analyzed, specific absorption rate (SAR) and specific utilization rate on a leaf basis (SURL) were calculated for the period between Days 40 and 60. Relative growth rate decreased with time for all treat-ments and rootstocks. Salt treatment significantly reduced both RGR and NARw, whereas LWR showed no definite trend. In all rootstocks, NARw, but not LWR, was significantly corre-lated with RGR, indicating that NARw was an important factor underlying the salinity-induced differences in RGR among the citrus rootstocks. At Day 60, salinity had a significant effect on leaf concentrations of Cl, Na, K, Ca, Mg, P, Fe, Mn and Zn and on the SAR and SURL of most elements. In general, RGR was correlated with SAR and SURL. Therefore, in addition to osmotic effects and the inhibitory effects of high concentra-tions of Cl− and Na+, an imbalance of essential nutrients may also contribute to the reduction in plant growth under saline conditions.
Keywords: growth analysis, NaCl, net assimilation rate, root-stock, specific absorption rate, specific utilization rate.
Introduction
Secondary salinization from irrigation sources is a growing problem in commercial agriculture. Citrus is grown preferen-tially in semiarid areas where irrigation is required to produce maximum yield. In these areas, many soils and waters contain amounts of salts that can inhibit the growth and yields of citrus crops. Although Citrus species are classified as salt-sensitive (Maas 1990, 1993), there is great variation in the ability of citrus trees to tolerate salinity depending on rootstock (Cerdá et al. 1977, Walker and Douglas 1983, Zekri and Parsons 1992) and scion (Lloyd et al. 1989, 1990, Nieves et al. 1991).
Most attempts to correlate growth of different citrus root-stocks or rootstock scion combinations with the physiological effects of salinity have been made on young seedlings at a single harvest date. These comparative studies can be mislead-ing because they do not consider the initial biomass of the plant, which can influence the rate of growth and the size at
harvest (Hunt 1982, Cramer et al. 1990). To take account of the initial biomass of the plant and thus provide a more realistic comparison of the growth rates of different citrus cultivars under similar saline conditions, we have expressed growth as a relative growth rate (RGR) (Poorter 1989). Few studies have employed plant growth analysis to determine the effects of salinity on the morphological, physiological and biochemical factors determining RGR (Curtis and Laüchli 1986, Shennan et al. 1987, Wickens and Cheeseman 1988, Schachtman et al. 1989, Cramer et al. 1990, Romero and Marañón 1994).
Plants acquire essential nutrients from their root system environment. In a saline habitat, the presence of NaCl alters the nutritional balance of plants, resulting in high ratios of Na+/Ca2+, Na+/K+, Na+/Mg2+, Cl−/NO
3
−, and Cl−/H
2PO4−
(Grat-tan and Grieve 1992), which may cause reductions in growth. Major saline ions can affect nutrient uptake through competi-tive interactions or by affecting the ion selectivity of mem-branes. Examples of these effects include Na+-induced Ca2+ or K+ deficiencies, or both, and Ca2+-induced Mg2+ deficiencies (Grattan and Grieve 1992).
The factors responsible for the effects of salinity on citrus are complex. The role of different rootstocks, the causes of salt injury and the interactions of soil salinity with other environ-mental stresses have been reviewed by Maas (1993). Although there are several studies showing the effects of salinity on macro and micronutrient concentrations (Nieves et al. 1990, Bañuls et al. 1990, Zekri 1993), little is known about how salinity interferes with nutrient uptake and translocation, or how these changes are related to plant growth.
We have examined salt-tolerance mechanisms operating at the whole-plant and cellular levels in four citrus rootstocks with different abilities to exclude Cl− or Na+, or both, to elucidate the mechanisms underlying such differences and to identify those characteristics that can be applied to a breeding program designed to enhance salt tolerance in citrus. In par-ticular, we examined the effects of salinity on ion uptake and its relation to growth. We also analyzed the effects of increas-ing salinity on the absorption rates and specific utilization rates of mineral elements in four citrus rootstocks.
Materials and methods
Four citrus rootstocks were studied: sour orange (Citrus aurantium (L.) (SO)), Cleopatra mandarin (C. reticulata
Citrus response to salinity: growth and nutrient uptake
DIONISIO RUIZ, VICENTE MARTÍNEZ and ANTONIO CERDÁ
Department of Plant Nutrition and Physiology, Centro de Edafologia y Biologia Aplicada del Segura, CSIC, Apdo 4195, 30080 Murcia, Spain
Received April 18, 1995
blanco (CM)), Carrizo citrange (C. sinensis (L.), Osbeck × P. trifoliata (L.) Ref. (CC)) and C. macrophylla wester (M). Seeds of all rootstocks were germinated in trays of sterilized vermiculite wetted with 0.5 mM CaSO4 in the dark at 29 °C. When the radicles were 3--4 cm in length, the seedlings were transferred to 15-liter containers filled with a continuously aerated nutrient solution (6 mM KNO3, 4 mM Ca(NO3)2, 2 mM KH2PO4, 2 mM MgSO4, 20 µM Fe3+ masquolate, 25 µM H3BO3, 2 µM MnSO4.H2O, 2 µM ZnSO4, 0.5 µM CuSO4, 0.4 µM (NH4)6Mo7O24
.
H2O). The solutions were renewed weekly and the pH was adjusted daily to 6.0--6.5. The plants were grown in a controlled environment chamber at a day/night temperature of 25/20 °C, a day/night relative humid-ity of 65/85% and a 16-h photoperiod. Photon flux denshumid-ity was 400 µmol m−2 s−2. Light was provided by a combination of fluorescent tubes (Philips TLD 36 W/83, Sylvania F36 W/GRO) and metal halide lamps (Osram HQI. T 400 W).Plants were grown in culture solution for 4 months before the salinity treatments were initiated. Groups of 18 uniform seedlings were selected for each rootstock per saline treatment. The salt treatment consisted of adding NaCl daily to the nutri-ent solution in 10 mM incremnutri-ents to give final NaCl concen-trations of 10, 20, 40 and 80 mM. Plants cultivated in the nutrient solution without the addition of NaCl were used as controls.
Plants were harvested after 20, 40 and 60 days of exposure to the salinity treatments. Fresh and dry weights of roots, shoots and leaves, the number of leaves and the root length of six plants of each rootstock per treatment were measured just before the addition of NaCl and after 20, 40 and 60 days. Plant material was dried at 65 °C to a constant weight. Root length was determined by the line intersect method (Tennant 1975).
Relative growth rate (RGR), net assimilation rate on a leaf weight basis (NARw) and leaf weight ratio (LWR) were calcu-lated from the dry weight values at the three harvests. Relative growth rate was defined as the increase in plant weight per unit of plant weight (W) per unit of time (t):
RGR = 1/W× dW/dt.
The NARw was defined according to Garnier (1991) as the increase in plant weight per unit of leaf weight (LW) per unit of time:
NARw= 1/LW × dW/dt,
and LWR was calculated as the ratio between total leaf dry weight and total plant dry weight. These parameters are related by the following expression:
RGR =NARw× LWR.
Leaf mineral nutrient analysis
Dried plant tissue was digested in a concentrated nitric/per-chloric acid (2/1, v/v) mixture, and Na, K, Ca, Mg, Fe, Mn, Cu and Zn contents were measured by atomic absorption spectro-photometry. Phosphorus was measured by the
molybdenum-blue method described by Dickman and Bray (1940). Chloride was extracted from 0.1 g of ground material with 50 ml of deionized water and measured by electrometric titration (Guil-liam 1971).
Specific absorption rate, SAR (mg g−1 day−1), an index of the element uptake efficiency of roots, was calculated using the formula SAR = 1/RDW ∂M/∂T, where RDW is the root dry weight (g), M is the element amount (mg) in the whole plant and T is the time of harvest in days. The specific utilization rate on a leaf basis, SURL (g mg−1 day−1), an index of the efficiency of the element in producing biomass, was calculated as the rate of plant biomass production per unit of element in the leaves (Hunt 1982, Romero et al. 1994). The relationships between relative growth rate and SAR and SURL for the three harvests were evaluated by regression equations. Because of the large amount of data produced, leaf and root mineral nutrient con-centrations, and SAR and SURL values are only presented for the period between Days 40 and 60.
Statistical analyses
All measured parameters were statistically analyzed with the STATGRAPHICS package (Manugistics, Inc., Rockville, MD) for calculation of the standard error and regression lines. Six replicates per salinity treatment per rootstock per harvest-ing date were used for analysis of the growth measurements. The ANOVAs were calculated for each harvest based on five salinity treatments and six replicates per treatment per root-stock with the SIGMASTAT package (Jandel Corporation, San Rafael, CA).
Results Growth analysis
Salinity resulted in decreased whole-plant biomass in all of the rootstocks tested (Table 1). Differences in growth response between salinized and unsalinized plants were evident after 40 days of treatment with 80 mM NaCl (data not shown). Although differences became apparent at lower salt concentra-tions with increasing time of treatment, only data for the period between Days 40 and 60 are presented. The organ that was reduced most in biomass by the salt treatments varied with rootstock. By the end of the experiment on Day 60, mean leaf, stem and root dry weights of the SO rootstock that was least affected by the 80 mM NaCl treatment were about 64, 49 and 33%, respectively, of the control values. For the CC rootstock, in which seedlings of the most affected plants were totally defoliated by the 80 mM NaCl treatment, stem and root dry weights were 29 and 26% of the control values, respectively. Reduced plant growth was associated with reductions in root length (Figure 1A), stem growth, and new leaf production (Figure 1B).
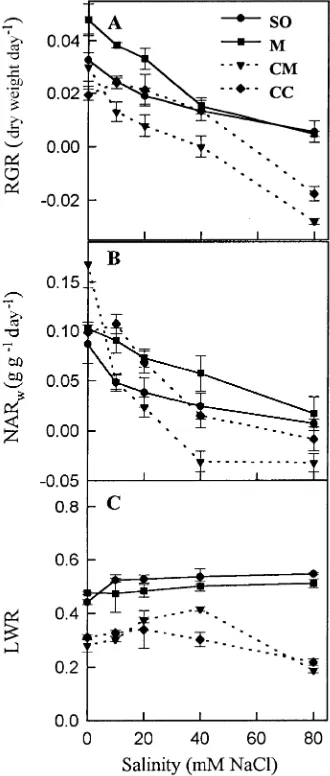
salinized plants varied between 0.0055 and −0.028 day−1 (Fig-ure 2A). In all rootstocks, the decline in RGR increased with increasing salinity and with the period of exposure. For in-stance, after 40 days of exposure to 20 mM NaCl, RGR values were 0.0205, 0.0142, 0.0359 and 0.0212 day−1 for the CM, CC, M and SO rootstocks, respectively, whereas the corresponding values at Day 60 were 0.0078, 0.0133, 0.0331, 0.0189 day−1. Similar trends were observed in the other salt treatments. Rootstocks showed differences in biomass accumulation over time as a result of differences in initial size or RGR, or both.
During the study, NARw declined in all rootstocks, particu-larly in the salt-treated plants (data not shown); the decline showed a similar trend to that of RGR, but was more intense (Figure 2B, Table 2). In contrast, LWR showed no definite trend with time (Figure 2C). Linear regessions of the relation-ships between RGR and NARw or LWR based on data from the three harvests showed that NARw was significantly correlated with RGR in all rootstocks. The determination coefficients, R2, ranged from 0.87 for M rootstock to 0.71 for CM rootstock (Figure 3). In contrast, LWR was not correlated with RGR, except in the CM rootstock, (R2 = 0.30, data not shown).
Mineral nutrient concentrations
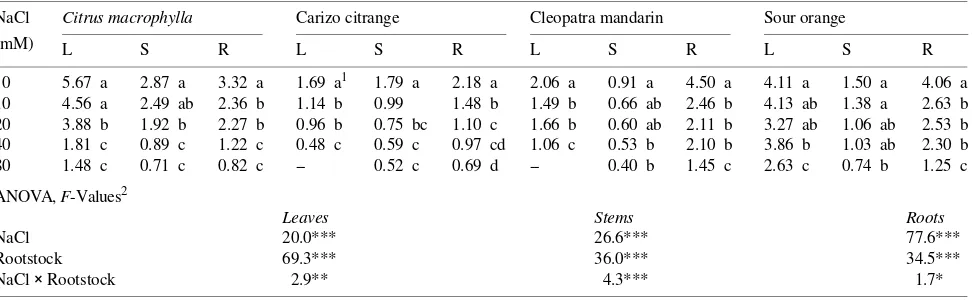
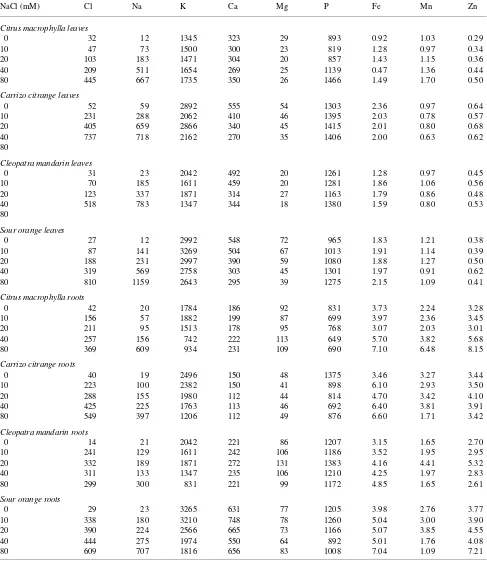
Tissue concentrations of Cl− and Na+ increased significantly in response to the salt treatments (Table 3). The concentrations of Cl− and Na+ increased in plants treated with ≤ 40 mM NaCl until Day 20, and then remained constant for the remainder of the study, whereas the concentrations of Cl− and Na+ in plants treated with 80 mM NaCl increased slightly between Days 20 and 60 (data not shown). Saline-induced changes in the con-centrations of the other elements analyzed varied with plant organ and element (Table 3). Salinity lowered K+ concentra-tions in roots of all rootstocks and in leaves of the CM, SO and CC rootstocks, whereas K+ concentrations increased in leaves and roots of M rootstocks. Concentrations of Ca2+ and Mg2+ were reduced by salinity in all rootstocks, except M. In all rootstocks, salinity increased P concentrations in leaves and Fe Table 1. Effects of external NaCl on leaf (L), stem (S) and root (R) dry weights (g) of four citrus rootstocks (Citrus macrophylla, Carrizo citrange, Cleopatra mandarin and Sour orange) following a 60-day exposure to salinity. Values are means of six replicates.
NaCl Citrus macrophylla Carizo citrange Cleopatra mandarin Sour orange
(mM) L S R L S R L S R L S R
0 5.67 a 2.87 a 3.32 a 1.69 a1 1.79 a 2.18 a 2.06 a 0.91 a 4.50 a 4.11 a 1.50 a 4.06 a 10 4.56 a 2.49 ab 2.36 b 1.14 b 0.99 1.48 b 1.49 b 0.66 ab 2.46 b 4.13 ab 1.38 a 2.63 b 20 3.88 b 1.92 b 2.27 b 0.96 b 0.75 bc 1.10 c 1.66 b 0.60 ab 2.11 b 3.27 ab 1.06 ab 2.53 b 40 1.81 c 0.89 c 1.22 c 0.48 c 0.59 c 0.97 cd 1.06 c 0.53 b 2.10 b 3.86 b 1.03 ab 2.30 b 80 1.48 c 0.71 c 0.82 c -- 0.52 c 0.69 d -- 0.40 b 1.45 c 2.63 c 0.74 b 1.25 c ANOVA, F-Values2
Leaves Stems Roots
NaCl 20.0*** 26.6*** 77.6***
Rootstock 69.3*** 36.0*** 34.5***
NaCl × Rootstock 2.9** 4.3*** 1.7*
1 Means within a column followed by the same letter are not significantly different at
P = 0.05, according to the Duncan’s test.
2 Significant effects are indicated by asterisks: * = P = 0.05, ** = P = 0.01 and *** = P = 0.001, NS indicates not significant at P = 0.05.
and Zn concentrations in roots, but no changes in Fe and Zn concentrations were observed in leaves. The Mn response to the salt treatments was variable. The absolute whole-plant content of all elements analyzed increased with time (data not shown).
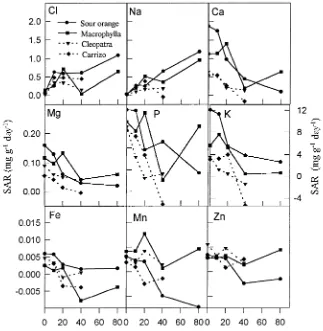
Specific absorption rate
On Day 20, salinity had significantly increased the absorption rates of Cl− and Na+ to about 4 and 3.5 mg g−1 root day−1, respectively. After this time, the absorption rates with respect to external salinity remained constant, although the absolute values decreased with time (Figure 4).
On Day 20, SARs of K+, Ca2+ and Mg2+ were slightly reduced by salt treatments in excess of 20 mM NaCl (data not shown), but by Day 60, the SARs of these elements were severely reduced by salinity in all rootstocks (Figure 4). Dif-ferences in SARs among rootstocks were evident after 60 days of salt treatment. Values of SAR were higher for M and SO rootstocks than for CC and CM rootstocks. Potassium SAR of salinized SO and CC plants (40 mM NaCl treatment) ranged from 3.81 to −5.31 mg g−1 root day−1, respectively, and the corresponding values for Ca2+ were 0.44 and −0.16 mg g−1 root day−1. The SAR for Mg2+ ranged between 0.030 and −0.0043 mg g−1 root day−1 for M and CC rootstocks, respectively.
Although SAR of P decreased with time, saline inhibition was only evident on Day 60 (Figure 4). The maximum SAR of P (1.71 mg g−1 root day−1) was observed in SO plants in the 40 mM NaCl treatment and the minimum SAR of P (−0.44 mg g−1 root day−1) was observed in CC plants in the 40 mM NaCl Figure 2. Effects of external NaCl on RGR (A), NARw (B) and LWR
(C) of four citrus rootstocks following a 60-day exposure to NaCl. Error bars are ± SE (n = 6).
Table 2. Analysis of variance of the RGR, NARw and LWR values presented in Figure 2.
RGR NARw LWR
NaCl 74.8***1 37.6*** 12.2***
Rootstock 34.2*** 4.1* 158.5***
NaCl × Rootstock 3.4** 3.7** 6.1*** 1 Significant effects are indicated by asterisks: * =
P = 0.05, ** = P = 0.01 and *** = P = 0.001.
treatment. The SAR of the micronutrients showed a tendency to decrease with increasing salinity, although the extent of the response varied with both rootstock and micronutrient (Fig-ure 4).
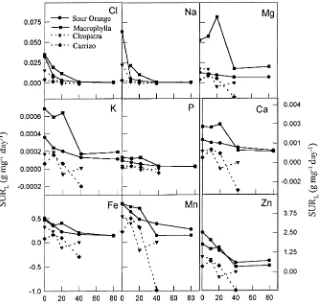
Specific utilization rate
Specific utilization rate on a leaf basis (SURL) showed similar trends for all of the elements studied. There was a significant decrease in SURL with both increasing salinity and time for all Table 3. Effects of external NaCl concentration on mineral composition (mmol kg−1) of leaves and roots of four citrus rootstocks. Data are for plants harvested after a 60-day salinization period. Values are means of six replicate plants.
NaCl (mM) Cl Na K Ca Mg P Fe Mn Zn
Citrus macrophylla leaves
0 32 12 1345 323 29 893 0.92 1.03 0.29
10 47 73 1500 300 23 819 1.28 0.97 0.34
20 103 183 1471 304 20 857 1.43 1.15 0.36
40 209 511 1654 269 25 1139 0.47 1.36 0.44
80 445 667 1735 350 26 1466 1.49 1.70 0.50
Carrizo citrangeleaves
0 52 59 2892 555 54 1303 2.36 0.97 0.64
10 231 288 2062 410 46 1395 2.03 0.78 0.57
20 405 659 2866 340 45 1415 2.01 0.80 0.68
40 737 718 2162 270 35 1406 2.00 0.63 0.62
80
Cleopatra mandarin leaves
0 31 23 2042 492 20 1261 1.28 0.97 0.45
10 70 185 1611 459 20 1281 1.86 1.06 0.56
20 123 337 1871 314 27 1163 1.79 0.86 0.48
40 518 783 1347 344 18 1380 1.59 0.80 0.53
80
Sour orange leaves
0 27 12 2992 548 72 965 1.83 1.21 0.38
10 87 141 3269 504 67 1013 1.91 1.14 0.39
20 188 231 2997 390 59 1080 1.88 1.27 0.50
40 319 569 2758 303 45 1301 1.97 0.91 0.62
80 810 1159 2643 295 39 1275 2.15 1.09 0.41
Citrus macrophyllaroots
0 42 20 1784 186 92 831 3.73 2.24 3.28
10 156 57 1882 199 87 699 3.97 2.36 3.45
20 211 95 1513 178 95 768 3.07 2.03 3.01
40 257 156 742 222 113 649 5.70 3.82 5.68
80 369 609 934 231 109 690 7.10 6.48 8.15
Carrizo citrange roots
0 40 19 2496 150 48 1375 3.46 3.27 3.44
10 223 100 2382 150 41 898 6.10 2.93 3.50
20 288 155 1980 112 44 814 4.70 3.42 4.10
40 425 225 1763 113 46 692 6.40 3.81 3.91
80 549 397 1206 112 49 876 6.60 1.71 3.42
Cleopatra mandarin roots
0 14 21 2042 221 86 1207 3.15 1.65 2.70
10 241 129 1611 242 106 1186 3.52 1.95 2.95
20 332 189 1871 272 131 1383 4.16 4.41 5.32
40 311 133 1347 235 106 1210 4.25 1.97 2.83
80 299 300 831 221 99 1172 4.85 1.65 2.61
Sour orange roots
0 29 23 3265 631 77 1205 3.98 2.76 3.77
10 338 180 3210 748 78 1260 5.04 3.00 3.90
20 390 224 2566 665 73 1166 5.07 3.85 4.55
40 444 275 1974 550 64 892 5.01 1.76 4.08
elements examined, except for the SURL of P which was only affected by salinity at the 60-day harvest (Figure 5). The SURL for Mg2+ was higher than for K+, Ca2+, and P, and, among the micronutrients, the highest SURL was for Zn. For all elements, the SO and M rootstocks exhibited higher SURL values than the CM and CC rootstocks.
Regression equations of RGR with SAR and with SURL of all elements studied were calculated to evaluate the relative importance of these parameters for each nutrient with respect to their effects on RGR. The correlation coefficients are pre-sented in Table 4.
Discussion
Growth analysis
Relative growth rates of the citrus rootstocks were less than 0.05 day−1; however, small changes in RGR may result in large variations in growth (Hardwick 1984). Furthermore, the RGR values are similar to those reported for tree seedlings of other species (Grime and Hunt 1975). Differences in RGR observed among the citrus rootstocks in response to salinity may be associated with the growth characteristics of the rootstocks (CC and CM were slow-growing rootstocks, whereas SO and M rootstocks grew vigorously (Table 1)) and with the inherent
partitioning of biomass between shoot and roots. The SO and M rootstocks favored a high biomass investment in leaves and stems (Table 1), thus ensuring increased light interception, and consequently, increased growth. In contrast, the CC and CM rootstocks invested relatively more biomass in roots.
Inhibition of growth of CM and CC rootstocks in the 80 mM NaCl treatment appeared to result from large increases in foliar concentrations of Na+ or Cl−, or both. Because the CM and CC
rootstocks were less vigorous than the SO and M rootstocks (Table 1), growth inhibition could be a consequence of a greater concentration effect of these ions in the CM and CC rootstocks than in the SO and M rootstocks. In many perennial woody crops, the growth response to salt treatment varies with rootstock (Maas 1993).
In many physiological studies on salinity, plant growth inhi-bition has been related to a reduction in photosynthesis (Munns 1993). In all of our rootstocks, NARw was significantly correlated with RGR, but not with LWR, suggesting that growth of citrus rootstocks was affected more by a decline in photosynthetic capacity than by a reduction in extension growth. These observations are consistent with those reported in Hordeum vulgare L. by Cramer et al. (1990) and in Melilotus segetalis (Brot.) Ser. by Romero and Marañón (1994). In contrast, Curtis and Läuchli (1986) and Shennan et al. (1987) concluded that inhibition of growth in Hibiscus cannabinus L.
and Aster tripolium L. under salt stress was caused by reduc-tions in extension growth and leaf area development, rather than by a decline in photosynthetic capacity.
The saline-induced decrease in NARw could be associated with a decrease in photosynthetic rate, an increase in respira-tion rate, or an increase in the relative amount of non-photo-synthetic tissue participating in respiration (Poorter 1989). In
citrus, the primary effect of salinity on photosynthesis is sto-matal closure, which leads to decreased mesophyll capacity for CO2 assimilation (Lloyd et al. 1989, 1990). The extent of the saline-induced reduction in photosynthesis varies with both scion and rootstock (Walker et al. 1982, Lloyd et al. 1989, 1990, Bañuls and Primo-Millo 1992). Irrespective of the pri-mary cause of reduced CO2 assimilation, high foliar concen-Figure 5. Effect of external NaCl con-centration on specific utilization rate on a leaf basis (SURL) in four citrus rootstocks at the 60-day harvest. Val-ues are means of six replicates.
Table 4. Correlation coefficients of the regression equations for the relative growth rates (RGR) with the specific absorption rates (SAR) and the specific utilization rates on a leaf basis (SURL) of mineral elements in citrus rootstocks in response to increasing salinity in the external solution. Significant effects indicated by asterisks: * = P < 0.5, ** = P < 0.01 and *** = P < 0.001, and NS indicates not significant at P = 0.5.
Element Citrus macrophylla Carrizo citrange Cleopatra mandarin Sour orange
SAR SURL SAR SURL SAR SURL SAR SURL
Cl 0.16NS 0.88*** 0.69** 0.78*** 0.20NS 0.58* 0.23NS 0.74***
Na 0.27NS 0.71** 0.76*** 0.77*** 0.28NS 0.62* 0.23NS 0.60*
K 0.70** 0.80*** 0.95*** 0.94*** 0.97*** 0.75*** 0.90*** 0.97***
Ca 0.80*** 0.83*** 0.95*** 0.91*** 0.89*** 0.72** 0.95*** 0.93***
Mg 0.55* 0.71** 0.96*** 0.91*** 0.83*** 0.81*** 0.93*** 0.95***
P 0.61* 0.86*** 0.96*** 0.94*** 0.84*** 0.80*** 0.89*** 0.98***
N 0.80*** 0.86*** 0.95*** 0.94*** 0.88*** 0.78*** 0.95*** 0.98***
Fe 0.47NS 0.80*** 0.94*** 0.92*** 0.82*** 0.75*** 0.88*** 0.97***
Mn 0.36NS 0.87*** 0.78*** 0.91*** 0.40NS 0.81*** 0.92*** 0.95***
trations of both Na+ and Cl− ions are capable of inducing a
reduction in CO2 assimilation (Lloyd et al. 1989, 1990, Bañuls and Primo-Millo 1992, Garcia-Legaz et al. 1993).
The decrease in NARw with salinity in the citrus rootstock may also be associated with an increase in respiration. Salinity may increase whole-plant respiration (Richardson and McCree 1985), thereby inducing a higher carbohydrate requirement (Schwarz and Gale 1981). Additional carbohydrates presum-ably provide the additional energy required for increased re-building of organelles and compounds that are disrupted by salinity. A saline-induced increase in respiration would pre-sumably occur at the expense net CO2 fixation, resulting in reduced overall growth. However, Curtis et al. (1988) found an increase in respiration in mature kenaf leaves with increasing salinity, but no evidence that it resulted in a reduced amount of available carbohydrate in the growing tissue. The lower NARw values in the CC and CM rootstocks at the two highest salt concentrations may result from their relatively high root weights per unit leaf area, which would induce an increase in respiration (Poorter 1989).
The effects of salinity on LWR suggest that allocation of biomass to leaves was maintained or increased under saline conditions. Although specific leaf area was not determined, we observed morphological differences among leaves of the root-stocks, indicating that this LAR component may have been affected by salt treatment. For example, in the control treat-ment, SO seedlings had few but large leaves (177 mg per leaf), M seedlings had the highest number of leaves with 75.7 mg per leaf, whereas the individual leaf weight of CM and CC root-stocks were 64.1 and 48.2 mg, respectively (Figure 1C). The fast-growing species (SO and M) formed large thin leaves with a large amount of water per unit of leaf weight (Poorter 1989). Leaf water content per unit dry weight increased with salinity in all rootstocks.
Thus, for citrus seedlings growing in saline conditions, NARw is the most important factor explaining differences in RGR, whereas LWR is of secondary importance. However, changes in specific leaf area may also be involved. We con-clude that: (a) citrus species are among the most salt-sensitive horticultural crops, because a 60-day exposure to 10 mM NaCl had a significant impact on the relative growth rate of the rootstocks tested, and (b) there are marked differences in the response of RGR to salinity among rootstocks, with the SO and M rootstocks being less sensitive to salt than the CC and CM rootstocks.
Nutrient uptake and utilization
Much attention has been devoted to understanding adverse effects of Na+ and Cl− on physiological and biochemical
proc-esses and how these ions contribute to plant growth inhibition (Munns and Termaat 1986, Maas 1993, Munns 1993). Both uptake and accumulation of Na+ and Cl− in leaves increased
with increasing concentrations of these ions in the external solution, and the increases were paralleled by decreases in RGR and NARw. These elements had a higher utilization rate in control plants than in salt-stressed plants. Similar findings in Melilotus segitalis have shown that low concentrations of
saline ions that have a minimal nutritional requirement can stimulate growth, whereas high salt concentrations in the ex-ternal solution have toxic effects (Romero et al. 1994). The rapid decline in SURL of Na+ and Cl− with increasing time and
salinity, especially for Cl−, may underlie the inhibitory effects of salinity on relative growth rate in citrus.
An imbalance of essential nutrients may also be a factor involved in the salt-induced decrease in photosynthesis and consequently in plant growth reduction. We found that the salt treatments altered mineral nutrient distribution and decreased both absorption rates (Figure 3) and specific utilization rates (Figure 4) of all of the nutrients studied. The decrease in element uptake may be partly a result of a reduction in their activities caused by high concentrations Cl− and Na+ in the nutrient solution (Cramer et al. 1986). Uptake may also have been reduced as a result of competition with the salt ions in the external solution (Grattan and Grieve 1992).
A decrease in K+ uptake and accumulation in salt-treated plants is likely an important growth limiting factor because this element plays an essential role in many plant processes (Marschner 1986). The NaCl treatments decreased K+ uptake to a higher degree in CM and CC rootstocks than in M and SO rootstocks, which may explain the RGR differences observed among these rootstocks. The regulation of K+ uptake and transport in these citrus rootstocks appears to involve different mechanisms. In M and SO rootstocks, the decreased K+ con-centration in roots may be attributed to an exchange between Na+ and K+ in the basal stem and proximal root and a further release of K+ into the xylem (Walker and Douglas 1983, Walker 1986). In CM and CC rootstocks, root and leaf K+ concentrations decreased with increasing salinity, indicating that the reduction in K+ SAR results from a competitive proc-ess (Janzen and Chang 1987, Subbarao et al. 1990) or is induced by changes in membrane integrity caused by the displacement of Ca2+ by Na+ (Cramer et al. 1985).
Salinity reduced Ca2+ absorption rates, resulting in a high Na+/Ca2+ ratio that may have restricted root growth (Kent and Läuchli 1985, Hansen and Munns 1988). In all rootstocks, the root was the organ most affected by salinity. The decrease in Ca2+ SAR paralleled root growth and may explain the constant
concentration of Ca2+ in this organ. Except in M rootstock, the foliar concentration of Ca2+ was reduced by salinity, indicating that Ca2+ translocation was inhibited. Similar findings have been reported for other plant species (Maas and Grieve 1987, Lazof and Läuchli 1991).
absorption rates and reduced translocation. The absorption rates of Mg2+ were highly correlated with RGR for all treat-ments (Table 4). The utilization rates of this element were much higher than for K+ and Ca2+.
The uptake of phosphate was not impaired by a 60-day exposure to NaCl, so P imposed no limitation to plant growth under the experimental conditions of our study.
The influence of salinity on micronutrient concentrations in plants is highly variable (Grattan and Grieve 1992). In citrus, the specific absorption and utilization rates of all micronutri-ents examined were reduced by salinity, indicating that the saline-induced reduction in NARw could be associated with the disturbed absorption of these elements, which are all directly or indirectly involved in photosynthesis (Marschner 1986).
We conclude that citrus nutrition is altered by salinity. Rela-tive growth rate was correlated with saline-induced declines in NARw and in the SAR and SURL of all mineral elements. Thus, in addition to the toxic effects of high concentrations of Na+ and Cl− in plant tissue, the saline-induced changes in mineral nutrient uptake and utilization likely contributed to the reduc-tion in plant growth. In support of this argument, a greater growth reduction was observed in rootstocks CM and CC, which have low SAR and SURL values.
Acknowledgments
The authors thank J. Abrisqueta and A. Aragon for technical assis-tance. This work was supported by the Comision Interministerial de Ciencia y Tecnologia. Project No. AGR91-1096-C03-02 (Spain).
References
Bañuls, J. and E. Primo-Millo. 1992. Effects of chloride and sodium on gas exchange parameters and water relations of citrus plants. Physiol. Plant. 86:115--123.
Bañuls, J., F. Legaz and E. Primo-Millo. 1990. Effect of salinity on uptake and distribution of chloride and sodium in some citrus scion--rootstock combinations. J. Hortic. Sci. 65:715--724. Cerdá, A., M. Caro., F.G. Fernández and M.G. Guillén. 1977. Foliar
contents of sodium and choride on citrus rootstocks irrigated with saline waters. In Managing Saline Water for Irrigation. Ed. H.E. Dregne. Proc. Int. Salinity Conf., Texas Tech Univ., Lubbock, TX, pp 155--164.
Cramer, G.R., A. Läuchli and V.S. Polito. 1985. Displacement of Ca2+ by Na+ from the plasmalemma of root cells: A primary response to salt stress? Plant Physiol. 79:207--211.
Cramer, G.R. A. Läuchli and E. Epstein. 1986. Effects of NaCl and CaCl2 on ion activities in complex nutrient solutions and root growth of cotton. Plant Physiol. 81:792--797.
Cramer, G.R., E. Epstein and A. Läuchli. 1990. Effects of sodium, potassium and calcium on salt-stressed barley. I. Growth analysis. Physiol. Plant. 80:83--88.
Curtis, P.S. and A. Läuchli. 1986. The role of leaf area development and photosynthetic capacity in determining growth of kenaf under moderate salt stress. Aust. J. Plant Physiol. 18:553--565.
Curtis, P.S., H.L. Zhong, A. Laüchli and R.W. Pearcy. 1988. Carbohy-drate availability, respiration, and the growth of the kenaf (Hibiscus cannabinus) under moderate salt stress. Am. J. Bot. 75:1293--1297.
Del Amor, F., A. León and A. Torrecillas. 1985. Guía practica para el riego y la fertilización de cítricos, ISBN 84-505-1117-3. Caja Rural de Orihuela, pp 37--55.
Dickman, S.R. and R.H. Bray. 1940. Colorimetric determinations of phosphate. Ind. Eng. Chem. Anal. Ed. 12:665--668.
García-Legaz, M.F., J.M. Ortiz, A. García-Lidón and A. Cerdá. 1993. Effect of salinity on growth, ion content and CO2 assimilation rate in lemon varieties of different rootstocks. Physiol. Plant. 89:427--433. Garnier, E. 1991. Resource capture, biomass allocation and growth in
herbaceous plants. Trends Ecol. Evol. 6:126--131.
Grattan, S.R. and C.M. Grieve. 1992. Mineral element acquisition and growth response of plants grown in saline environments. Agric. Ecosyst. Environ. 38:275--300.
Grattan, S.R. and E.V. Maas. 1984. Interactive effects of salinity and substrate phosphate on soybean. Agron. J. 76:668--676.
Grime, J.P. and R. Hunt. 1975. Relative growth rate: its range and adaptative significance in a local flora. J. Ecol. 63:393--442. Guilliam, M.G. 1971. Rapid measurement of chlorine in plant
materi-als. Soil Sci. Soc. Am. Proc. 35:512--513.
Hansen, E.H. and D.N. Munns. 1988. Effects of CaSO4 and NaCl on growth and nitrogen fixation of Leucaena leucocephala. Plant Soil 107:95--99.
Hardwick, R.C. 1984. Some recent developments in growth analy-sis----a review. Ann. Bot. 54:807--812.
Hunt, R. 1982. Plant growth curves. An introduction to the functional approach to plant growth analysis. Edward Arnold, London, pp 14--46.
Janzen, H.H. and C. Chang. 1987. Cation nutrition of barley as influ-enced by soil solution composition in a saline soil. Can. J. Soil Sci. 67:619--629.
Kent, L.M. and A. Läuchli. 1985. Germination and seedling growth of cotton: salinity--calcium interactions. Plant Cell Environ. 8:155--159. Lazof, D. and A. Läuchli. 1991. The nutritional status of the apical meristem of Latuca sativa as affected by NaCl salinization: An electron-probe microanalysis study. Planta 184:334--342. Lloyd, J., P.E. Kriedemann and D. Aspinall. 1989. Comparative
sensi-tivity of ‘‘Prior Lisbon’’ lemon and ‘‘Valencia’’ orange trees to foliar sodium and chloride concentrations. Plant Cell Environ. 12:529--540. Lloyd, J., P.E. Kriedemann and D. Aspinall. 1990. Contrasts between Citrus species in response to salinization: An analysis of photosyn-thesis and water relations for different rootstock-scion combina-tions. Physiol. Plant. 78:236--246.
Maas, E.V. 1990. Crop salt tolerance. In Agriculture Salinity Assess-ment and ManageAssess-ment. Ed. K.K. Tanji. Am. Soc. Civil Eng. Manu-als and Reports on Engineering No. 7, NewYork, pp 202--304. Maas, E.V. 1993. Salinity and citriculture. Tree Physiol. 12:195--216. Maas, E.V. and C.M. Grieve. 1987. Sodium-induced calcium
defi-ciency in salt-stressed corn. Plant Cell Environ. 10:559--564. Marschner, H. 1986. Mineral nutrition of higher plants. Academic
Press. London.
Munns, R. 1993. Physiological processes limiting plant growth in saline soils: some dogmas and hypotheses. Plant Cell Environ. 16:15--24.
Munns, R. and A. Termaat. 1986. Whole-plant responses to salinity. Aust. J. Plant Physiol. 13:143--160.
Nieves, M., A. Cerdá and M. Botella. 1991. Salt tolerance of two lemon scions measured by leaf chloride and sodium accumulation. J. Plant Nutr. 14:623--636.
Poorter, H. 1989. Interspecific variation in relative growth rate: on ecological causes and physiological consequences. In Causes and Consequences of Variation in Growth Rate and Productivity of Higher Plants. Ed. H. Lambers. Academic Publishing, The Hague, The Netherlands, pp 45--68.
Richardson, S.G. and K.J. McCree. 1985. Carbon balance and water relations of sorghum exposed to salt and water stress. Plant Physiol. 79:1015--1020.
Romero, J.M. and T. Marañón. 1994. Long-term responses of Melito-tus segetalis to salinity. I. Growth and partitioning. Plant Cell Environ. 17:1243--1248.
Romero, J.M., T. Marañón and J.M. Murillo. 1994. Long-term re-sponses of Melilotus segetalis to salinity. II. Nutrient absorption and utilization. Plant Cell Environ. 17:1249--1255.
Schachtman, D.P., A.J. Bloom and J. Dvorak. 1989. Salt tolerant Triticum × Lophophyrum derivatives limit the accumulation of sodium and chloride ions under saline-stress. Plant Cell Environ. 12:47--55.
Schwarz, M. and J. Gale. 1981. Maintenance respiration and carbon balance of plants at low levels of sodium chloride salinity. J. Exp. Bot. 32:933--941.
Shennan, C., R. Hunt and E.A.C. Macrobbie. 1987. Salt tolerance in Aster tripolium L. I. The effect of salinity in growth. Plant Cell Environ. 10:59--65.
Subbarao, G.V., C. Johansen, M.K. Jana and J.V.D.K. Kumar Rao. 1990. Effects of sodium/calcium ratio in modifying salinity re-sponse of pigeonpea (Cajanus cajan). J. Plant Physiol. 136:439--443.
Tennant, D. 1975. A test of a modified line intersect method of estimating root length. J. Ecol. 63:995--1001.
Walker, R.R. 1986. Sodium exclusion and potassium-sodium selectiv-ity in salt-treated trifoliate orange (Poncirus trifoliata) and Cleopa-tra mandarin (Citrus reticulata) plants. Aust. J. Plant Physiol. 13:293--303.
Walker, R.R. and T.J. Douglas. 1983. Effect of salinity level on uptake and distribution of chloride, sodium and potassium ions in citrus plants. Aust. J. Agric. Res. 34:145--153.
Walker, R.R., E. Torokfalvy and W.J.S. Downton. 1982. Photosyn-thetic responses of the citrus varieties Rangpur lime and Etrog citron to salt treatment. Aust. J. Plant Physiol. 9:783--790. Wickens, L.K. and J.M. Cheeseman. 1988. Application of growth
analysis to physiological studies involving environmental continui-ties. Physiol. Plant. 73:271--277.
Zekri, M. 1993. Salinity and calcium effects on emergence, growth and mineral composition of seedlings of eight citrus rootstocks. J. Hort. Sci. 68:53--62.