INVESTIGATION OF COASTLINE CHANGES IN THREE PROVINCES OF THAILAND
USING REMOTE SENSING
Thanyabhon Tochamnanvita, *and Wutjanun Muttitanona
a
International Program in Environmental and Water Resources Engineering, Dept. of Civil and Environmental Engineering, Faculty of Engineering, Mahidol University, Nakhon Pathom 73170,
Thailand. [email protected], [email protected]
KEY WORDS: Coastline changes, Remote sensing, fusion Technique, Change detection technique, Principal Component Analysis
ABSTRACT:
The measuring of coastal in the certain short period of time is almost impossible, but applying the remote sensing with the satellite imagery bring mankind to track down and analyze the approximately length of the coastal changes at the Nano technology speed. An attempt has been made to study the length of shoreline changes along three provinces in the upper gulf of Thailand. The significant purpose is to investigate coastline length changes and to evaluate those different coastal changes at different times. Two specialties of chosen areas are the outstanding location at mouth of river in curve pattern and ecological important mangrove forest, as nominated and designated area listed in Ramsar convention, international wetlands treaty. In employing the remote sensing will help to investigate the shoreline erosion, stable or construction shoreline. Rapid and drastic shoreline changes have been compared and measured base on satellite image Landsat 5 TM on 1994, 2002 and 2007 at path129 row 051. There were geometrically co-registered and, in the process were resampled to 25m. By composing RGB band, fusion, supervised classification. By apply different theories will give different results but the similarly pattern. Training sites were selected by signature editor, area of interest, evaluate by seperabilitly and contingency. Principle component analysis (PCA) was employed as a method of change detection. This is to conclude that these shoreline areas were in erosion from natural processes and manmade activities, for example, aquaculture and agriculture expansion, such as shrimp farm. These coastal line lost were not just losing the land; it's losing the soul of the cycle of marine life, economically, and environmentally. Moreover, this project, in the future, could benefit to set the recovery buffer zone for mangrove restoration also.
1. INTRODUCTION
The measuring of coastal in the certain short period of time is almost impossible, but applying the remote sensing with satellite imagery bring mankind to track down and analyze the approximately length of the coastal changes at the Nano technology speed.
Shoreline can be defined as the intersections of the land with the water surface at a selected tidal elevation level (camfield & Morang, 1996). The shoreline is a dynamic environment and an important component in research such as sea level rise, shore protection, tidal inundation, land subsidence and erosion- sedimentation process (Shcwarzer, 2010).
The coastal benefits and important for human’s life, plants and animals are included ecology, economics, social and politic among regional, national and international scale. So this area is widely invaded or changing land use for agriculture, shrimp farm, mangrove forest/tropical forest, deforest/urban area and other development. Development somehow creates more coastal erosion which effect to natural resources and coastal ecosystem. Other human activities which impact coastline are dredging, construction of breakwater infrastructure and physical development, mineral exploration, ports construction, removal of backshore vegetation, construction of barrages and coastal control works (Fanos Et al. 1995, Berger and lams 1996, Ibe 1998 and Pandian et al 2004).
Land use practices generally develop over a long period of time under different environmental, political, demographic, and socio-economic conditions. These conditions often vary and have a direct impact on land use and land cover. The interaction of nature and society and their implications on land use and land cover is a very complex phenomenon that encompasses a wide
range of social and natural processes. These socioeconomics factors often dictate how land is used regionally as well as locally. To better understand the impact of land use change on terrestrial ecosystems, the factors affecting land use change must be filly examined (Muttitanon and Tripathi 2005).
The gulf of Thailand is a shallow arm of the South China Sea. It is the boarded by Cambodia, Thailand and Vietnam.
Figure 1: Gulf of Thailand image (Wikipedia)
Remote sensing and geographical information system has been widely used as another option than conventional method for monitoring shoreline position (Ryu et al., 2002)
applications have not supported their conclusions by quantitative analysis (Singh 1989).
This paper presents a composite application of several change processing operation of remotely sensed data and satellite image for change detection. The significant purpose is to investigate the changes in the length of the coastline and to evaluate those different coastal changes at different times of Samut Sakorn, Samut Prakarn and Samut Songkram over a period of 18 years.
2. STUDY AREA
The length of all coastal in Thailand in approximately 2,614 kilometers, divided it as two sides, the gulf of Thailand is about 1660 kilometers, with 17 provinces and Andaman Sea is about 954 kilometers, with 6 provinces (Department of Marine and Coastal Resources, 2000). According to the coastal morphodynamics research, the coastal erosion has occurred to Andaman Gulf of Thailand but more dramatic at Gulf of Thailand, at the speed of one and more than five meters per year In this study, investigation was carried out in three provinces. Three Samut provinces in the upper gulf of Thailand focus are Samut Sakhon, Samut Prakarn and Samut Songkhram. Two specialties of areas are the location at mouth of river in curve pattern, as so called “wave buffer” and ecological important mangrove forest, as nominated and designated listed in Ramsar convention, international wetlands treaty.
Muddy coastline was home to abundant mangrove forests. The explosive growth of factories and industry in the area has been a catastrophe because seashore ground is soft. When natural buffers vanished, the district’s coastline rapidly became submerged in sea water.
These three provinces are soft area and more crisis than other areas. They are more likely to lose the coastal area or land. As World Bank stated in 2007 estimated that Thai coastal land has been lost 2 km2 per year with the damage of six Billion Baht.
Detail of the specific areas, Samut Sakorn Province, total area in Samut Sakorn Amphoe, 8 Tambon is 872.3 km2. The coordinate
of study area is 13° 32 50 N, 100° 16 25 E. Samut Songkram total area in at Amphoe Muang, 4 Tambon is 93.97 km2. Samut Prakarn, at 3 Amphoe 6 Tambon total area is 204.91 km2.
Table 1: The coastal length of study area
Province simultaneously. Landsat TM imagery is usually good for creating a general land cover classification map.
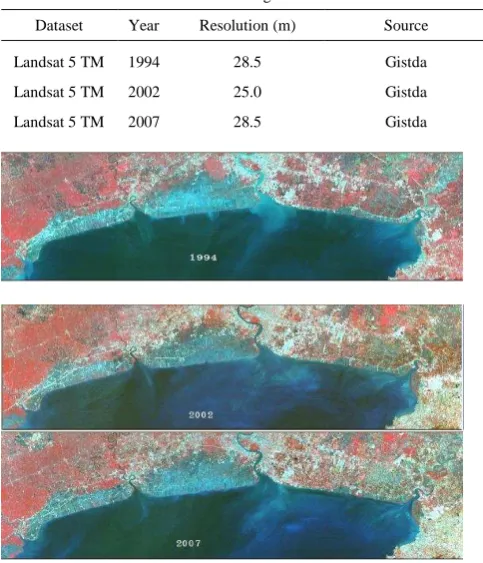
Table 2: dataset used in this study. Satellite Image Data
Dataset Year Resolution (m) Source
Landsat 5 TM 1994 28.5 Gistda
Landsat 5 TM 2002 25.0 Gistda
Landsat 5 TM 2007 28.5 Gistda
Figure 2: Landsat 5 TM satellite imagery of study area
One visible red band (band 3; 0.63-0.69 µm), a near infrared band (band4; 0.76-0.90 µm) and a mid-infrared band (band 5; 1.55-1.74 µm) were extracted from original TM data sets.
3.2 Map data from Royal Thai Survey Department
Table 3: Map Data used in this study.
Land use zoning map from Land Development Department, the three provinces, the upper gulf of Thailand as listed in Table 4 and Figure 3, left to right respectively.
Table 4: Land use zoning data used in this study:
Land use Zoning Map
Province Year Scale
Samut Songkram 2000,2006 1:25000
Samut Sakhon 2000,2007 1:25000
Samut Prakarn 2000,2007 1:25000
Figure 3: Three provinces land Use Map
Boundaries of each province to the sea are as followed, Samut Songkram, one Amphoe is connecting to the sea are Amphoe Muang Samut Song kram. Four Tambon are Klong Kone, Bang Kaew, Bang Ja Keng, and Leam Yai.
Samut Sakorn, one Amphoe is connecting to the sea are Amphoe Muang Samut Sakorn, Eight Tambons are Ka long, Khok Kam, Na Khok, Bang Kra Jaw, Bang Toe Rat, Bang Ya prak, Ban Bor, Pan Tai NoraSing.
4. METHODOLOGY
Methodology used in this study based on classification technique to delineate land/sea boundary. Change detection is an important application of remote sensing and has different meanings to different users, invariably involves detection of change-normally its location and extent, and sometimes the identification.
There were geometrically co-registered and, in the process were resampled to 25m. By composing RGB band, fusion, supervised classification by apply different theories will give different result but the similarly pattern. Training sites were selected by signature editor, area of interest, evaluate by seperabilitly and contingency.
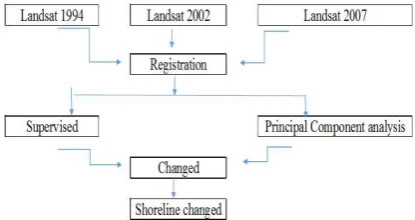
Change detection technique, which is an important application of remote sensing, and has different meanings to different users, invariably involves detection of change – normally its location and extent, and sometimes the identification. The steps of shoreline change detection are shown in figure 4.
Figure 4: Shoreline change detection scheme
4.1 Geometric Corrections
Three Landsat 5 TM images were georeferenced to digitized map of the corresponding area.
4.2 Supervised classification
Supervised classification is a classifications method that users specify examples of information classes of interest in the image for the computer system to use. Selected examples are statistical data that determine data characteristics, which the computer system uses for processing and classifying each pixel of satellite data into information classes specified by uses as training sites (lillesand & kiefer, 1987). The accuracy and reliability of this classification method depend on the characteristic of training sites, whether they are adequately diverse to cover all information classes and able to represent the population of all classes. This method requite the "thorough knowledge of study areas users in order to integrate ancillary data, to Do site survey, and to observe physical characteristics of each information classes as explained above.
Satellite images were classified to prepare land cover maps of 1994, 2002 and 2007. The assessment of land use/land cover and changes was performed using GIS. Classification combined the best band of Landsat TM imagery was emphasized as the classified images were needed to be used as inputs for change detection analysis.
Conversion of the classified raster images of land use/ land cover in vectors forms was performed to assess the land use changes during study period as shown in figure 5.
Figure 5: Supervised classification of year 2007.
4.3 Change detection Technique
Overlaying GIS technique has been used to find the growth that occurred between different time periods. This helps to determined and explain spatial land-use change patterns. Importantly to mention that a 25 meters error could be accepted in digitizing 1: 50000 scale topographic map.
Image differencing, which appears to perform generally better than other methods of change detection, is probably the most widely applied change detection algorithm for a variety of geographical environment (Singh, 1989). Different images in Year 1994, 2002, and 2007, were created by subtracting the brightness values of later date from those of previous date.
4.4 Principal Component analysis
information in the original bands into fewer bands. The new bands that result from this procedure are called components. This method of Data compression, compacted into fewer bands that is dimensionality of the data is reduced, as shown in the equation as follow, element of that matrix at row k, column e
4.5 Post classification
Post classification is carried out to improve the classified image to evaluate classification accuracy and to generalize classes to use in vector GIS.
4.6 Problems, limitation and accuracy
Accuracy assessment of remote sensing is feedback system for checking and evaluating the objectives and the results. The classified remote sensing products are to be compared with the reference that is created based on human generalization. As long as the boundaries fall in their respective buffer zones, they are considered correct. If the image classification corresponds closely with the standard, it is said to be accurate.
Tested quantitative methods for developing threshold levels using accuracy indices, the Kappa coefficient in determining an optimal threshold level are being based on an error matrix of image data against known reference data, The classification accuracy was 95-97% with 0.90-0.95 Kappa Coefficient index,
5. RESULTS AND DISCUSSION
In this Initial research, trail error analysis of change detection techniques found that two times PCA testing result were quite obvious different. After examined what cause it. Researcher found that the different way of mixing RGB band combination affect less or none. The comparison of two types classification, the supervise classification is much better than Unsupervised classification.
After trial of error in defining training area, the results state that little mistake in visual interpretation to classify each class in the supervise classification can cause big problem to PCA later. Defining signature editor is the important in this task.
In supervised classification, defined the training area, using visual interpretation rely on the user also. Moreover, some local area expert in Thailand can defined the coastline as six categories which are mud flat, sand beach, sand and mud beach, shingle beach and land reclamation which would generate more in-depth results.
Typically the waterline is mapped through image classification procedures. The major outputs of this study are the complication of relevant thematic database, assessment of land use/ land cover distribution in 1994, 2002 and 2007. Between year 1994- year 2002 the decreasing of mangrove area, the erosion was severed. However, year 2002-2007 the mangrove forest coverage was increasing, save the shoreline. The coastal line was changed. However, to identify the shoreline, the obstacle is reflectance of salt farming and fish farming which trigger the false/true coastline.
Field survey, the inaccessible in some area of determined ground center point or GCP, make the work harder, but travelling with a long – tail boat in these areas were interesting and remarkable.
Field Survey, one of the water transportation in Thailand is Long tail Boat, traditionally local boat to assess the inaccessible mangrove forest area. Long tail boat is less harm to nature.
6. Conclusion
Figure 6: Long tail Boat.
This is to conclude that these shoreline areas were in erosion from natural processes and manmade activities, for example, aquaculture and agriculture expansion, such as shrimp farm.
During Year 1994- 2007, Most of the changes were observed. However, with the increasing development of bridge construction in those areas, the coastline change rapidly in the next 10 years. Multi –Temporal and multi spectral data, Delineated the land use/land cover changes Research in the upper gulf of Thailand would increasingly important.
These coastal line lost were not just losing the land; it's losing the soul of the cycle of marine life, economically, and environmentally. Moreover, in the future, could benefit to set the recovery buffer zone for mangrove restoration also. Then
Adapting remote sensing to use in shoreline with the experience user is quite accuracy. However, Satellite imagery in Thailand would be more benefit and present more clearly results if the high spatial resolution data were utilized.
REFERENCES
Berger, A. and W. J. Lams. (1996). Geoindicators: Assessing rapid environmental changes in earth systems. Roterdam, p. 466.
Camfield, F.E., Morang, A. (1996). Defining and interpreting shoreline change. Ocean & Coastal Management, 32(3), 129-151
Department of Marine and coast resources, 2000
Mediterranean Coastal Environment. Terragona, Spain: MEDCOAST.
Ibe, A.C. (1988). Coastline erosion in Nigeria. The Nigerian Institute for Oceanography and Marine Research and A.C. Ibe. Ibadan. University Press, Ibadan, Nigeria (ISBN 978-2345-041).
Jimmy O. Adegoke (2010), an assessment of recent changes in the Niger delta coastline using satellite imagery, Journal of Sustainable Development, 3(4), 277-296
Lillesand, T.M. and Kiefer, R.W., (1987), Remote Sensing and Image Interpretation, Sec. Ed., John Wiley and Sons, Inc.: Toronto.
Muttitanon W. & N.K Tripathi (2005) Land use/Land cover changes in the coastal zone of Ban Don Bay, Thailand using Landsat 5 TM data. International Journal of Remote Sensing, 26(11), 2311-2323
Pandian, P. K.; S. Ramesh; M. V. R. Murthy; S. Ramachandran; and S. Thayumanavan. (2004). Shoreline changes and near-shore processes along Ennore Coast, East Coast of South India. Journal of Coastal Research.
20(3): 828-845.
Ryu, J.H., Won, J.S., & Min, K.D. (2002). Waterline extraction from Landsat TM data in a tidal flat a case study in Gomso Bay, Krea. Remotes Sensing of Environment, 83 (3), 442-456.
Shwarzer, K., (2010). Geology and coastal erosion in the tropical marine ecosystem. Coastal and Continental Shelf Research, Institute of Geosciences, Cristian-Albrechts University, Germany.