A MULTI-RESOLUTION FUSION MODEL INCORPORATING COLOR AND ELEVATION FOR
SEMANTIC SEGMENTATION
Wenkai Zhang a, b, Hai Huang c, *, Matthias Schmitz c, Xian Sun a, Hongqi Wang a, Helmut Mayer c
a Key Laboratory of Spatial Information Processing and Application System Technology, Institute of Electronics, Chinese Academy
of Sciences, Beijing, 100190, China
[email protected]; [email protected]; [email protected] b University of Chinese Academy of Sciences, Beijing, 100190, China
c Institute for Applied Computer Science, Bundeswehr University Munich, Werner-Heisenberg-Weg 39, D-85577 Neubiberg,
Germany
{hai.huang, matthias.schmitz, helmut.mayer}@unibw.de
KEY WORDS: Semantic Segmentation, Convolutional Networks, Multi-modal Dataset, Fusion Nets
ABSTRACT:
In recent years, the developments for Fully Convolutional Networks (FCN) have led to great improvements for semantic segmentation in various applications including fused remote sensing data. There is, however, a lack of an in-depth study inside FCN models which would lead to an understanding of the contribution of individual layers to specific classes and their sensitivity to different types of input data. In this paper, we address this problem and propose a fusion model incorporating infrared imagery and Digital Surface Models (DSM) for semantic segmentation. The goal is to utilize heterogeneous data more accurately and effectively in a single model instead of to assemble multiple models. First, the contribution and sensitivity of layers concerning the given classes are quantified by means of their recall in FCN. The contribution of different modalities on the pixel-wise prediction is then analyzed based on visualization. Finally, an optimized scheme for the fusion of layers with color and elevation information into a single FCN model is derived based on the analysis. Experiments are performed on the ISPRS Vaihingen 2D Semantic Labeling dataset. Comprehensive evaluations demonstrate the potential of the proposed approach.
* Corresponding author
1. INTRODUCTION
Semantic segmentation is of great interest for scene understanding and object detection. Many approaches have been reported to improve the performance of semantic segmentation. The introduction of Fully Convolutional Networks (FCN) by Long et al. (2015) as a special variant of Convolutional Neural Networks (CNNs, Krizhevsky et al., 2012, LeCun et al., 1998) has opened a new research area for semantic segmentation.
FCN is the first pixel-wise prediction model which can be trained end-to-end and pixel-to-pixel. The basic model named FCN-32s consists of convolution layers extracting features, deconvolution layers, and classification layers generating coarse predictions. Because of the large stride of FCN-32s, it generates dissatisfying coarse segmentations. To overcome this drawback, a skip architecture model, which directly makes use of shallow feature and reduces the stride for up-sampled prediction, has been proposed (Long et al., 2015). This skip model fuses several predictions from shallow layers with deep layers, which are simultaneously learned. An improved model named DeepLab, is presented in (Chen et al., 2016). It improves the coarse spatial resolution caused by repeated pooling by means of the so called atrous convolution. The authors employ multiple parallel atrous convolutions with different rates to extract multi-scale features for the prediction. Fully-Connected Conditional Random Fields (CRFs) are also applied for smoothing the output score map to generate a more accurate localization. Badrinarayanan et al. (2017, 2015) propose a novel model named SegNet. It is composed of two stacks: the first stack is an encoder that extracts the features of the input images,
while the second stack consists of a decoder followed by a prediction layer generating pixel labels. CRF-RNN (Zheng et al., 2015) fully integrates the CRF with Recurrent Neural Networks (RNN) instead of applying the CRF on trained class scores, which makes it possible to train the network end-to-end with back-propagation.
FCNs had been originally proposed for the semantic labeling of everyday photos. Currently, several researchers have proposed different methods based on FCN to segment high-resolution remote sensing images. Kampffmeyer et al. (2016) have presented a concise FCN model by removing the fifth convolution layer as well as the fully convolutional layers and keeping the first four convolution and the up-sampling layers. RGB, DSM (Digital Surface Model) and normalized DSM are concatenated into a 5-channel vector used as input. Audebert et al. (2016) introduce an improved model based on SegNet, which includes multi-kernel convolution layers for multi-scale prediction. They use a dual-stream SegNet architecture, processing the color and depth images simultaneously. Maggiori et al. (2017) present an ensemble dual-stream CNN to combine color with elevation information. Imagery and DSM data are employed in two separate streams in the CNN. The features derived from color and elevation are only merged at the last high-level convolution layer before the final prediction layer. Sherrah et al. (2016) propose a model based on FCN without down-sampling. It preserves the output resolution, but it is time-consuming. Color and elevation features are merged before the fully convolutional layer. The proposed models cannot only process color imagery, but also the combination of color and elevation data. Concatenating the color and depth as 4-channel vector is the most common strategy. It does, however,
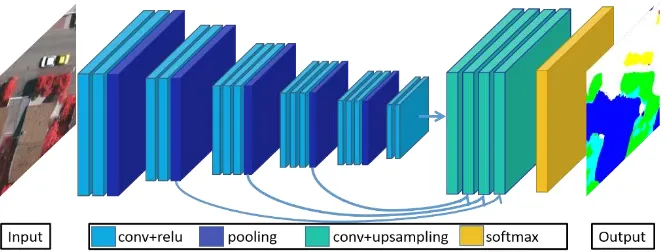
Figure 1. Multi-resolution model for the analysis of the contribution of individual layers to each class. conv: convolution layer, relu: Rectifying Linear Unit (nonlinearity).
usually not produce satisfying results. Gupta et al. (2014) proposed a new encoded representation of depth, which consists of three different features named HHA: disparity, height of the pixels, and the angle between the normal direction and the gravity vector based on the estimated horizontal ground. Long et al. (2016) combine RGB and HHA by late fusion averaging the final scores from both networks. Hazirbas et al. (2016) explore a neural network for fusion based on SegNet to improve the semantic segmentation for natural scenes.
In this paper we propose a multi-resolution model as a basis to understand the layers’ sensitivity to specific classes of heterogeneous data. This helps us to comprehend what layers learn and to explain why an early fusion cannot obtain a satisfying result. The contribution of different modalities for the pixel-wise prediction is examined based on the proposed model. Finally, different strategies of layer fusion for color and elevation information are analyzed to find an optimal position of the layers for an effective data fusion.
The rest of this paper is organized as follows. Section 2 introduces the proposed multi-resolution and fusion model. The experiments and analysis of the sensitivity and contribution of individual layers to specific classes are described in detail in Section 3. Conclusions are given in Section 4.
2. MULTI-RESOLUTION AND FUSION FRAMEWORK
2.1 Multi-resolution Model
FCN greatly improves the accuracy of semantic segmentation by end-to-end, pixel-to-pixel training methods. It can directly incorporate multi-modal data such as color and elevation information. However, it is not clear how sensitive the layers are concerning each class of data from different sources and why an early fusion does not lead to a satisfying result. To this end, we propose an improved FCN model named multi-resolution model (Figure 1). It is similar to FCN-8s proposed by Long et al. (2015) which has fifteen convolution layers. We add a shallower layer, i.e., the 2nd layer, as a skip layer to generate predictions. Each skip architecture consists of a convolution layer with kernel size 1×1, an up-sampling layer and a subsequent cropping layer (to remove the margin caused by pooling and padding) to obtain the same resolution as the original data. The sum of these up-sampling layers is the input to the classification layer generating the prediction. The nets are trained separately on imagery and DSM data to analyze the contribution of data from different sources to each class
2.2 Fusion Model
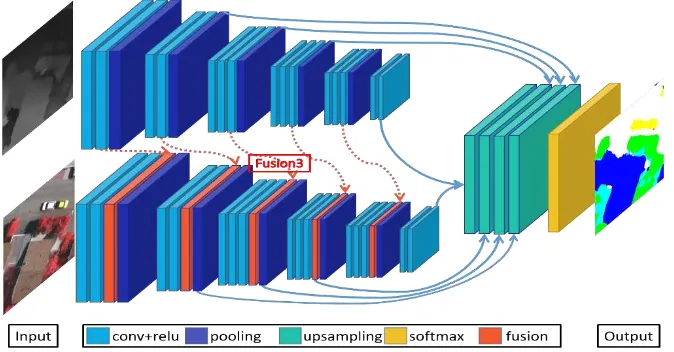
Figure 2 illustrates the fusion model which incorporates infrared imagery and DSM in one model instead of an ensemble model.
The proposed model consists of two parts: The encoder part extracts features and the decoder part up-samples the heat map which contains the probability to which class the pixels belong on the original image resolution. The encoder part consists of the left two streams in Figure 2 with the upper being the elevation channel and the lower the color channel. The elevation is normalized to the same range of values as the colors. In order to incorporate the infrared imagery and the DSM in one model, we fuse the feature maps from the elevation branch with those from the RGB branch. An element-wise summation fusion strategy is applied for the fusion layer, shown as red boxes in Figure 2. The fusion layers are inserted before the pooling layers. This fusion strategy helps to preserve the essential information of both branches. Since the fusion feature maps preserve more useful information, the network extracts better high-level features, which in turn enhances the final accuracy. We denote the fusion model by "Fusion" followed by the number of the fusion layers used in the FCN (cf. Figure 2). The decoder part resembles that of the multi-resolution model except the fusion layer after layer 2. If the fusion layer lies after layer 2, both streams between layer 2 and the fusion layer up-sample the heat map back to the original image resolution to generate predictions.
3. EXPERIMENTS
3.1 Dataset
Experiments are performed on the ISPRS 2D semantic labeling dataset (Rottensteiner, et al. 2013) of urban areas of Vaihingen. It includes high resolution True Orthophotos (TOP) and corresponding DSM data. The dataset contains 32 tiles in total with ground truth released for half of them, designated for training and validation. The Vaihingen dataset uses pixel-wise labeling for six semantic categories (impervious surfaces, building, low vegetation, tree, car, and clutter/background). We used 12 of the 16 labeled tiles for training and 4 tiles for validation. For training, we divided the selected tiles into patches with a size of 256×256 pixels with 128 pixels overlap. The patches are rotated by n times 90 degrees and flipped (top down, left right) for data augmentation. We selected four tiles (13, 15, 23, and 28) as the validation set. The validation set tiles are clipped into patches with a size of 256×256 pixels without overlap.
Major headings are to be centered, in bold capitals without underlining, after two blank lines and followed by a one blank line.
Figure 2. Fusion model incorporating heterogeneous remote sensing data: infrared imagery and DSM. 3.2 Training
3.2.1 Multi-resolution model training: To investigate the contribution of different source data for the interpretation of each class, we trained different nets separately on imagery and DSM data. The model for the imagery is only trained on color data and the DSM model is only trained on elevation data. All layers of the multi-resolution model are trained for 60,000 iterations. We utilize the step policy to accelerate the convergence of the networks starting with a reasonably small learning rate and decreasing it based on the step-size during the training. Net model VGG-16 (Simonyan and Zisserman, 2014) is employed with pre-trained initial parameters to finetune the model. We begin with a learning lrbase = 10-10, and reduce it by a factor of 10 every 20,000 iterations. Each training process contains a forward pass, which infers the prediction results and compares ground truth labels with predictions to generate loss, and a backward pass, in which the weights of the nets are updated via stochastic gradient descent.
3.2.2 Fusion model training: The fusion model is trained on both color and elevation data. All layers are trained together for 60,000 iterations. To accelerate the learning, we again utilize the step policy with a reasonably initial learning rate, decreasing every 20,000 iterations. Footnotes
3.3 Evaluation of Experimental results
What layers learn about different objects can be represented by the recall of the specific classifier for the specific class. The recall is the fraction of correct pixels of a class that are retrieved in the semantic segmentation. It is defined together with the precision in Equation (1). A higher recall of a layer for a specific class indicates in turn a higher sensitivity to the class. However, the recall for a single layer is not a reasonable measure for the sensitivity of classes. When the recalls of two layers are computed, it is useful to use the descent rate of recall, defined as difference over previous recall, to determine which layer has the primary influence. Thus we evaluate the contribution of layers for each class based on recall and its descent rate.
TP recall
TP FN
;
TP precision
TP FN
(1)
To evaluate the fusion model, we use the F1 score and the overall accuracy. The F1 score is defined as in Equation (2).
The overall accuracy (OA) is the percentage of the correctly classified pixels, as defined in Equation (3)
1 2precision recall F
precision recall
(2)
ii ii i
OA
n t (3)where nij is the number of pixels of class i predicted to belong to class j. There are ncl different classes and ti is the total number of pixels of class i.
3.4 Quantitative Results
Table 1 and 2 list the recall of single and combined layers: ‘score’ includes all layers, score2 represents the recall of layer 2, score345 represents the recall of layers without the layer 2, and so on up to score234.
Color is included at the beginning and elevation is integrated at layer x. From Table 1, we can see that for color layer 2 is mostly sensitive to trees, the descent rate of recall being 17%, the class car is slightly less sensitive with a descent rate of 15%. Layer is mostly sensitive to the classes car and impervious surface, the descent rate of recall being 38% and 8%, respectively. Impervious surfaces reach the top descent rate at layer 4, with trees, buildings, and low vegetation next. Layer 5 is only sensitive to buildings. They have the highest recall, although the descent rate is not steeper than for layer 4. Low vegetation, on the other hand, has the steepest descent rate at layer 5.
For the color we thus conclude that the shallower layers, i.e., layers 2 and 3, are more sensitive to small objects like cars. As demonstrated in Figure 3, when layer 3 is removed, the cars cannot be recognized any more. Deeper layers, i.e., layers 4 and 5, are sensitive to objects which comprise a more complex texture and occupy larger parts of the image, i.e., buildings and trees.
For the elevation features layer 2 is sensitive to impervious surfaces with a descent rate of recall of 75% while that for tree is 17% and for low vegetation 13%. Layer 3 reacts stronger to trees and impervious surfaces. The fourth layer is sensitive to trees, impervious surfaces, buildings and low vegetation. Layer 5 is essential to correctly classify buildings. If the fifth layer is removed, the recall decreases from 0.68 to 0.1.
Comparing the two types of feature, we can conclude that the layers for the same types of feature have different contribution for specific classes. Different types of feature are effective at
Color (IR) Ground truth Classification Classification (score245)
Figure 3. The contribution of layer 3 for car: When layer 3 is removed, cars are mostly not detected anymore, as other layers are not sensitive enough for cars.
Table 1. The recall of different layers for different classes for color features.
recall imp_surf building low_veg tree car other
score 0.86 0.86 0.72 0.84 0.43 0.52
score2 0.19 0.04 0 0.69 0.6 0.91
Score345 0.84 0.88 0.84 0.67 0.28 0
Score3 0.59 0.03 0.01 0.01 0.86 0.66
Score245 0.78 0.88 0.74 0.86 0.05 0.49
Score4 0.83 0.83 0.65 0.88 0.01 0
Score235 0.26 0.53 0.5 0.39 0.5 0.91
Score5 0 0.99 0.23 0 0 0
Score234 0.88 0.78 0.45 0.93 0.66 0.47
Table 2. The recall of different layers for different classes of elevation features.
recall imp_surf building low_veg tree car other
score 0.79 0.68 0.27 0.62 0 0
score2 0.92 0 0.07 0.52 0 0.01
Score345 0.04 0.84 0.14 0.55 0 0
Score3 0.98 0 0 0.24 0 0
Score245 0.72 0.8 0.34 0.53 0 0
Score4 0.59 0.51 0.11 0.8 0 0
Score235 0.85 0.8 0.19 0.2 0 0
Score5 0 1 0.04 0 0 0
Score234 0.87 0.1 0.21 0.65 0 0
Table 3. The Overall Accuracy (OA) of fusion model.
RGB-D Fusion1 Fusion2 Fusion3 Fusion4 Fusion5 Color Elevation
OA(%) 79.77 81.79 82.21 82.69 81.75 81.70 81.86 60.53
Table 4. Class-wise F1 score of six classes for fusion models.
F1 imp_surf building low_veg tree car other
RGB-D 0.82 0.86 0.69 0.81 0.56 0.59
Fusion1 0.85 0.88 0.72 0.83 0.5 0.54
Fusion2 0.85 0.89 0.72 0.82 0.47 0.58
Fusion3 0.85 0.9 0.72 0.84 0.56 0.57
Fusion4 0.85 0.89 0.71 0.82 0.51 0.58
Fusion5 0.84 0.89 0.7 0.83 0.55 0.62
Color 0.84 0.87 0.72 0.84 0.54 0.66
Elevation 0.69 0.71 0.34 0.59 0 0
different layers. This also explains why an early fusion does not lead to a satisfying result.
3.5 Fusion Model Results
Details for the overall accuracy of the fusion model are presented in detail in
Table 3. RGB-D indicates a simple four-channel RGB-D input. We denote the fusion model by Fusion followed by the number of fusion layers used in the FCN. The results demonstrate that Fusion3 obtains the highest OA of 82.69% and all fusion models outperform the simple use of RGB-D. This verifies that the fusion nets improve urban scene classification and especially the detection of buildings compared to the early
fusion of color and elevation data. From the multi-resolution model experiment, we have learned that for the color features the second layer is sensitive to trees, cars and clutter/background. In the elevation model, however, the second layer reacts most strongly to impervious surfaces and trees. Layers 3, 4, and 5 have a similar sensitivity for the classes. In Table 4, we report F1 scores for the individual classes. The fusion models result in very competitive OAs. Concerning the F1 scores of the six classes, Fusion3 outperforms all other for five of the six classes. When comparing the results for the individual features with the fusion model, we find that avoiding a particular conflicting layer for specific classes can improve the result. Thus, this investigation helps us to effectively incorporate heterogeneous data into a single model instead of
using ensemble models with higher complexity and computational effort.
4. CONCLUSION
The main contribution of this paper is a detailed investigation of the sensitivity of different layers for different sensor modalities for specific classes, by which means a multi-modal fusion incorporating heterogeneous data can be designed more precisely and effectively. The investigation also illustrates how different modalities contribute to the pixel-wise prediction. In-depth understanding of the sensitivity and, thus, functionality of the layers allows an adaptive design of a single FCN model for heterogeneous data, in which both classification results and efficiency are improved.
ACKNOWLEDGEMENTS
This work was supported partly by the National Natural Science Foundation of China under Grant 41501485 and the High Resolution Earth Observation Science Foundation of China under grant GFZX04060103. I am thankful to University of Chinese Academy Sciences for the scholarship.
REFERENCES
Audebert, N., Saux, B.L., Lefèvre, S., 2016. Semantic Segmentation of Earth Observation Data Using Multimodal and Multi-scale Deep Networks. ArXiv160906846 Cs.
Badrinarayanan, V., Kendall, A., Cipolla, R., 2017. SegNet: A Deep Convolutional Encoder-Decoder Architecture for Scene Segmentation. IEEE Trans. Pattern Anal. Mach. Intell. PP, 1–1. doi:10.1109/TPAMI.2016.2644615
Badrinarayanan, V., Kendall, A., Cipolla, R., 2015. Segnet: A deep convolutional encoder-decoder architecture for image segmentation. ArXiv Prepr. ArXiv151100561.
Chen, L.-C., Papandreou, G., Kokkinos, I., Murphy, K., Yuille, A.L., 2016. DeepLab: Semantic Image Segmentation with Deep Convolutional Nets, Atrous Convolution, and Fully Connected CRFs. ArXiv Prepr. ArXiv160600915.
Gupta, S., Girshick, R., Arbeláez, P., Malik, J., 2014. Learning Rich Features from RGB-D Images for Object Detection and Segmentation, in: Computer Vision – ECCV 2014. Presented at the European Conference on Computer Vision, Springer, Cham, pp. 345–360. doi:10.1007/978-3-319-10584-0_23
Hazirbas, C., Ma, L., Domokos, C., Cremers, D., 2016. FuseNet: Incorporating Depth into Semantic Segmentation via Fusion-based CNN Architecture, in: Proc. ACCV.
Kampffmeyer, M., Salberg, A.-B., Jenssen, R., 2016. Semantic Segmentation of Small Objects and Modeling of Uncertainty in Urban Remote Sensing Images Using Deep Convolutional Neural Networks. Presented at the Proceedings of the IEEE Conference on Computer Vision and Pattern Recognition Workshops, pp. 1–9.
Long, J., Shelhamer, E., Darrell, T., 2015. Fully Convolutional Networks for Semantic Segmentation. Presented at the Proceedings of the IEEE Conference on Computer Vision and Pattern Recognition, pp. 3431–3440.
Maggiori, E., Tarabalka, Y., Charpiat, G., Alliez, P., 2017. Convolutional Neural Networks for Large-Scale Remote-Sensing Image Classification. IEEE Trans. Geosci. Remote Sens. 55, 645–657. doi:10.1109/TGRS.2016.2612821
Shelhamer, E., Long, J., Darrell, T., 2016. Fully Convolutional Networks for Semantic Segmentation. IEEE Trans. Pattern Anal. Mach. Intell. 1–1. doi:10.1109/TPAMI.2016.2572683
Sherrah, J., 2016. Fully Convolutional Networks for Dense Semantic Labelling of High-Resolution Aerial Imagery. ArXiv160602585 Cs.
Simonyan, K., Zisserman, A., 2014. Very Deep Convolutional Networks for Large-Scale Image Recognition. ArXiv14091556 Cs.
Zheng, S., Jayasumana, S., Romera-Paredes, B., Vineet, V., Su, Z., Du, D., Huang, C., Torr, P.H.S., 2015. Conditional Random Fields as Recurrent Neural Networks. Presented at the Proceedings of the IEEE International Conference on Computer Vision, pp. 1529–1537.Moons, T., 1997. Report on the Joint ISPRS Commission III/IV Workshop “3D Reconstruction and Modelling of Topographic Objects”, Stuttgart, Germany http://www.radig.informatik.tu-muenchen.de/ISPRS/WG-III4-IV2-Report.html (28 Sep. 1999).