Nacep Asmara, 2014
The Effect of Modified Teacher’s Question on Describing Things in EFL Classroom Interaction
Universitas Pendidikan Indonesia | repository.upi.edu | perpustakaan.upi.edu CHAPTER III
RESEARCH METHODOLOGY
This chapter provides an overview of the research methodology, which includes
research design, data collection, data analysis and discussion, in search of the
answer of whether modified question affects EFL learners’ ability on describing
things by the use of pre-head modifier and the ability by upper group differs
significantly from lower groups. In addition, this study also searches for how
modified questions are implemented in building up EFL classroom interaction in
the instruction to give comprehensive understanding.
3.1 Research Design
To tackle the research problems, this study used a mixed method. It is a method
that concentrates on the collection, analysis and mixtures of the both data either in
single or serial study. The point of using the combinational approach is due to that
the approach can give better understanding than the single approach (Creswell and
Clark 2007: 5). It is the definition which becomes a guidance to conduct the
mixed method in this study because the investigator assumes that the use of mixed
method will give comprehensive understanding on the research problems.
This study involved the non-random assignment of subjects of the two
groups because, in a classroom research, it is excessive to ask the headmaster of
Nacep Asmara, 2014
The Effect of Modified Teacher’s Question on Describing Things in EFL Classroom Interaction
Universitas Pendidikan Indonesia | repository.upi.edu | perpustakaan.upi.edu
research (see Hatch and Farhady 1982: 22). Therefore, a quasi experimental
design was chosen because participants were not selected randomly (see Creswell
1994:132 and Creswell 2003: 169).
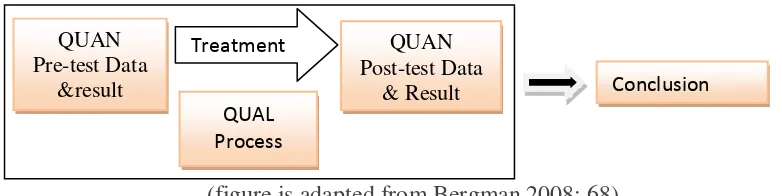
There are 5 types of the mixed methods including triangulation, concurrent
embedded, explanatory, exploratory and sequential embedded methods. The type
of the method that is used to explore the experiment in this study is a concurrent
embedded method. This means that qualitative data are embedded to the
quantitative data to examine the process of a treatment in the experiment and
qualitative data are collected concurrent with the implementation of the treatment
(see Bergman 2008: 68) . The steps of data collection in concurrent embedded
method can be observed in figure 3.1.
Figure 3.1 concurrent embedded design
(figure is adapted from Bergman 2008: 68)
There are three variables in the experiment. First is an independent
variable. It is the technique of instruction i.e. the use of modified questions to
provide students a reciprocal classroom interaction from which they pick up how
to describe things by the use of pre-head modifier correctly. Second is a
moderator variable. It is a current knowledge of learners if it interacts with the
independent variable in picking up the targeted skill. The last is a dependent
QUAN Pre-test Data
&result
QUAL Process
Treatment QUAN
Post-test Data
Nacep Asmara, 2014
The Effect of Modified Teacher’s Question on Describing Things in EFL Classroom Interaction
Universitas Pendidikan Indonesia | repository.upi.edu | perpustakaan.upi.edu
variable or something affected or influenced by the independent variable. It is a
learners’ ability to describe things by the use of pre-head modifier that a teacher
intends to convey (see Hatch and Farhady 1982: 15).
This experiment used Pretest-Posttest Control Group Design. The tests
were administered before and after treatment in the two groups. The experimental
group was treated by a special treatment i.e. the use of spoken modified input
through reciprocal interaction and the control group was treated by spoken
unmodified input through non-reciprocal interaction. The design can be observed
in Figure 3.2.
Figure 3.2 Quasi Experimental Design Group A (not random ) 01 --- X 1 --- 02 Group B (not random ) 01 --- X 2--- 02
(figure is adapted from Creswell 1994:132 and 2003: 170)
O1 = pre-test,
X 1 = special treatment
(spoken modified input through reciprocal interaction) X2 = non-treatment
(spoken unmodified input through non-reciprocal interaction) O2 = post-test.
G. A = experimental group G. B = control group
3.2 Data Collection
There are three research questions. Data which are needed to answer the
first research question is mixed data, the second research questions are
quantitative ones and the data needed to answer the third research question are
Nacep Asmara, 2014
The Effect of Modified Teacher’s Question on Describing Things in EFL Classroom Interaction
Universitas Pendidikan Indonesia | repository.upi.edu | perpustakaan.upi.edu
treatment including the material and principles of treatment and procedures of
data collection.
3.2.1 Subjects
The site of research is a state vocational school in Tasikmalaya. This vocational
school has five programs, i.e. hotel accommodation, marketing, office
administration, multi media and accounting programs. The present study focuses
on the first grade of office administration program.
This program has two classes, each consisting of 40 students but only 30
students were included as participants in which all of them are female. The seven
other students were excluded since their data were incomplete in either pre-test or
post-test and three other students were excluded too to make all subjects female.
Based on the result of the entrance test, their English belongs to the
average category. A preliminary observation of the class shows that they generally
have an extrovert personality, namely they like to express their feeling in spoken
form, to talk in front of many people and have high a self confidence.
3.2.2 Pre-test
A pre-test was administered before special treatment to experimental and control
groups. In the test, subjects were asked to describe things by completing
incomplete phrases, which was based on the picture and their linguistic
Nacep Asmara, 2014
The Effect of Modified Teacher’s Question on Describing Things in EFL Classroom Interaction
Universitas Pendidikan Indonesia | repository.upi.edu | perpustakaan.upi.edu
description. After that they were asked to complete incomplete phrases indicating
the conclusion of the picture description (see appendix 14).
The pre-test was conducted to measure the initial ability of learners on
describing things by the use of pre-head modifier both in experimental and control
groups. Their initial ability needs ensuring whether they are balanced or not. Thus,
if they have the similar initial ability, the differences of the effect between
treatment of the experimental and control groups can be seen from the result of
the post-test. The outline of the test items can be observed in Figure 3.3.
Figure 3.3 an outline of pre-test and post test item distribution
Theme Complexity of
2. Describing car from age and color; a film from nature and originality
Double descriptors
3, 4
3. Describing someone from profession; a place from function
Single descriptor
5,6
4. Describing a table from shape and material; a chair from color and material
Double descriptors
7, 8
5. Describing people from activity
Single descriptor 9, 10
6. Describing a car from events 11, 12
7. Describing a house from nature Double descriptors 13
8. Describing a person from age and number Triple descriptors 14
9. Describing a sedan from nature and classification
Double descriptors
15
10. Describing animal form nature. Triple descriptors 16
11. Describing tables from Quantity and
number; girls from number and activity Double descriptors 17,18 12. Describing women from quality and
Nacep Asmara, 2014
The Effect of Modified Teacher’s Question on Describing Things in EFL Classroom Interaction
Universitas Pendidikan Indonesia | repository.upi.edu | perpustakaan.upi.edu
Figure 3.3 shows the distribution of the test items. The test items consist of
20 completion test items (see appendix 14). Themes of the test were taken from
material which would be taught with a balance distribution. Each theme is
represented with two test items.
To keep a validity and reliability of the result, a study must be measured
with a valid and reliable instrument. Thus the instrument, in this case the set of the
items, is tested in the validity, reliability and test item analysis to measure the
discrimination and difficulty index.
Firstly, to measure validity of the test item, it was consulted to the
supervisors to measure face and construct validity. Meanwhile to measure content
validity, the outline of test items was made as described in Figure 3.3 (see
Sugiyono 2009: 352).
Figure 3.4 the formula of calculating reliability of test items
withspearman Brown’s formula
�
�=
1+2�� .ri = internal reliability of the test items
rb = Pearson Product Moment Correlation between first and second half
Secondly, measurement of a reliability index of the pre-test items was
measured by the use of split-half technique. At first, the scores were split up into
the groups of even and odd numbers. This split techniques was conducted because
the first even number and first odd number are identical and they tested the same
theme and so on. Then the scores of even numbers were correlated to those of odd
Nacep Asmara, 2014
The Effect of Modified Teacher’s Question on Describing Things in EFL Classroom Interaction
Universitas Pendidikan Indonesia | repository.upi.edu | perpustakaan.upi.edu
result were entered to spearman Brown’s formula (see Sugiyono 2009: 355) as
indicated on Figure 3.4. The calculation as indicated in table 2 in appendix 1
showed that the reliability index is 0.97. The value of �� (0.97) is greater than that
of r-table (with n = 34 and df 0.05 is 0.339). This means that pre-test items are
extremely reliable.
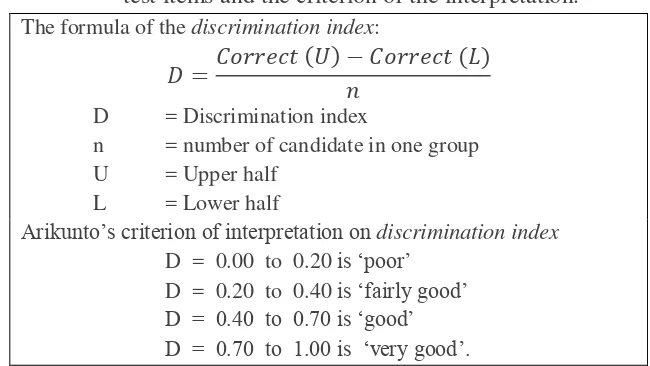
Figure 3.5 the formula of calculating discrimination index of test items and the criterion of the interpretation. The formula of the discrimination index:
= ��� � − ��� � (�)
D = Discrimination index
n = number of candidate in one group U = Upper half
L = Lower half
Arikunto’s criterion of interpretation on discrimination index
D = 0.00 to 0.20 is ‘poor’ D = 0.20 to 0.40 is ‘fairly good’
D = 0.40 to 0.70 is ‘good’ D = 0.70 to 1.00 is ‘very good’.
The last is test item analysis. The analysis was used to measure the
discrimination and difficulty index. To find out whether the test items discriminate
upper to lower groups, Discrimination index was calculated with the a formula as
written in Figure 3.5 (see Heaton 1988:180). Then the result of the calculation was
interpreted by the use of Arikunto’s criterion (1987: 221). See Figure 3.5.
Figure 3.6 the formula of calculating difficulty index of test items and the criterion of the interpretation.
The formula of the difficulty index
� = �
Nacep Asmara, 2014
The Effect of Modified Teacher’s Question on Describing Things in EFL Classroom Interaction
Universitas Pendidikan Indonesia | repository.upi.edu | perpustakaan.upi.edu
FV = the percentage of the total number of correct response R = the number of correct responses, and
N = the total number of responses.
The criterions for interpretation are adopted from Arikunto : FV from 0.10 to 0.30 is very hard
FV from 0.31 to 0.70 is fairly hard FV from 0.71 to 1.00 is easy
To find out the proportion of examinees who answered the item correctly,
the difficulty index was calculated by the formula as written in Figure 3.6 (see
Heaton 1988: 178). Then it was interpreted by the use of Arikuntos’ criterian
(1987: 210). See Figure 3.6. It refers to the percentage of the total number of
correct responses to the total of students taking the test, which can range between
0.0 and 1.0 (or from 0% to 100%). This indicates that the higher value of the
difficulty index, the greater the proportion of examinees respond to the item
correctly.
Manual calculation of the difficulty and discrimination index of test items
indicates that only number 2 needs revising because it has low discrimination
index (see table 3 in appendix 1). Number 2 was revised because there seemed a
word domestic that was assumed to be unknown by the most of subjects so it does
not discriminate the upper and the lower as shown with following quotation. The
word is replaced with a more familiar word, small.
Previous item: This is a lizard. It is domestic. It is reptile. Lizard is a ___ ___.
Revised item: This is a lizard. It is small. It is reptile. Lizard is a ___ ____.
In conclusion, the pre-test items are valid and reliable and could be used for the
Nacep Asmara, 2014
The Effect of Modified Teacher’s Question on Describing Things in EFL Classroom Interaction
Universitas Pendidikan Indonesia | repository.upi.edu | perpustakaan.upi.edu 3.2.3 Treatment
Treatment constitutes a process of teaching English with the topic ‘describing
things and people’ at the first grade of a vocational school. The treatment used
pictures that were related to the topic and the pictures were served as medium to
elicit interaction leading to describe pictures by the use of pre-head modifier.
The treatments were applied to experimental and control groups. The
treatment in the experiment group was the exposure of spoken modified input
through reciprocal interaction. This is a teaching-learning process in which a
teacher facilitated his students’ language experience by drawing them to involve
into classroom interaction in order that they try to describe the pictures. The
interaction is a process of presenting examples of language rules in direct
language experience (see appendix 4). In other words, language input were
exposed through a direct use of language enhanced in teacher-led classroom
interaction to examine the effect of modified teacher questions in negotiating the
description of pictures by the use of pre-head modifier (see Alwright 1988: 13).
The latter, the treatment in control group was the exposure of spoken
unmodified input through non-reciprocal interaction. This is a teaching-learning
process in which teacher expose the input by describing picture by the use of
pre-head modifier non-reciprocally while Students just listens their teacher’s
presentation (see appendix 4).
Figure 3.7 description of treatment
Nacep Asmara, 2014
The Effect of Modified Teacher’s Question on Describing Things in EFL Classroom Interaction
Universitas Pendidikan Indonesia | repository.upi.edu | perpustakaan.upi.edu
Pre-meeting Pre-test
Meeting 1 Describing t-shirts from color;
Describing cars from color and age or quality; Describing jackets from color and material; Describing films from originality and nature; Describing people from profession;
Describe animals from nature.
1
Meeting 2 Describing guitars from the characteristics and color; Describing people from profession;
Describing water from originality; Describing shoes from function;
Describing chairs from color and material; Describing vases from material and shape; Describing people and animal from activity; Describing cars and ships from event; Describing houses and animals from nature;
Describing the other name of military senior officers from nature
2
Meeting 3 Describing people from number and profession, activity and quality ;
Describing jackets from number, color and material; Describing animals from activity;
Describing chair, glasses, table from number, color and material;
Describing house from number and nature;
Describing students from number and classification; Describing money from number and nature;
Describing buses from number and nature; Describing books from number and nature; Describing guitar from number, color and nature; Describing vases from number, material and shape; Describing wall clock from number, color and shape
3
Post-meeting Post-test
Materials in the treatment were based on the syllabus for the 1st grade of
vocational school (SMK) issued by Badan Standar Nasional pendidikan (BSNP).
Nacep Asmara, 2014
The Effect of Modified Teacher’s Question on Describing Things in EFL Classroom Interaction
Universitas Pendidikan Indonesia | repository.upi.edu | perpustakaan.upi.edu
must be able to describe things after instruction. These materials are developed as
described in figure 3.7.
3.2.4 Recording of Teaching-Learning Process
A classroom recording is the secondary technique of collecting data to gain a deep
comprehension of the quantitative findings. It is applied to record a verbal
interaction in the experimental and control groups. The verbal data will be
recorded from how the teacher exposed the language input to how learners
described things as language output (see Genesee and Upshur 1996: 77).
Data of recoding were obtained from verbal classroom interaction of the
researcher who was being involved in an experimental and control groups (see
Sugiyono 2007: 64). The recording resulted in raw data i.e. a set of
video-recording which consisted of six folders of video-recording from three sessions of the
classes. Each folder contains some files of recording. Then, the recording was
transcribed. The transcription was divided into six sessions which consisted of
three of experimental and of control groups (see appendices 8, 9, 10, 11, 12 and
13).
Social situation belongings to object of observation covers three
components i.e. place, actor and activities (see Sugiyono 2007: 68). The place was
the classroom where the first grade of office administration program in a state
vocational school studied. Actor was teacher and students. Last, activities cover
Nacep Asmara, 2014
The Effect of Modified Teacher’s Question on Describing Things in EFL Classroom Interaction
Universitas Pendidikan Indonesia | repository.upi.edu | perpustakaan.upi.edu
modified question and students’ comprehension on lesson which is indicated with
verbal responds.
3.2.5 Post-test
A post-test was administered after treatment in the experimental group and control
groups to measure how long subjects can describe things by the use of pre-head
modifier. The procedure of the preparation of the post-test is like pre-test.
Meanwhile, the items in post-test are different from those in pre-test but they are
identical (see pre-test and appendix 14 & 15). The similarities are in the analysis
of the test item, in which, the post-test items were tried out to be analyzed. The
analysis included validity and reliability test and the analysis of discrimination
and difficulty index. To keep the validity, the test items were consulted to the
supervisors and made the map of the distribution of items as indicated in Figure
3.3. After that reliability of the test was measured by calculating the result of the
try-out through SPSS. 17. Then the results were calculated to find out the
discrimination and difficulty index (for detail, see section pre-test).
Aspect of reliability was measured with a split-half method as conducted
to pre-test items analysis. The calculation as indicated in table 2 of appendix 2
showed that the reliability index is 0.92. The value of �� (0.92) is greater than that
of r-table (with n = 38 and df 0.05 is 0.320). This means that post-test items are
Nacep Asmara, 2014
The Effect of Modified Teacher’s Question on Describing Things in EFL Classroom Interaction
Universitas Pendidikan Indonesia | repository.upi.edu | perpustakaan.upi.edu
The last, based on the manual calculation of the difficulty and
discrimination index of the test item analysis as indicated in Table 3 of appendix
2, only number 2 needs revising because it has low discrimination index. Number
2 was revised because there seemed a word wild that was assumed to be unknown
by the most of subjects so it did not discriminate the upper and the lower as shown
in following quotation. The word was replaced with a more familiar word,
‘dangerous’.
Previous item: This is a crocodile. It is wild. It is reptile. Crocodile is a _ _.
Revised item: This is a crocodile. It is dangerous. It is reptile. Crocodile is a _ _.
In conclusion, the instrument is valid and reliable and can be used for the study.
3.3 Data Analysis
There are two types of data in this study, i.e. quantitative and qualitative
data. The quantitative data were collected through pre-test and post-test, while
qualitative data were collected through video-recorded observation during the
treatments in the two groups. They will be discussed in the following sub-section.
3.3.1 Test Data
Test data include those from pre-test and post-test administered to the two groups
.the data were compared in several ways. Firstly, the scores of all groups were
tested to identify their variances with SPSS 17 through one-sample
Nacep Asmara, 2014
The Effect of Modified Teacher’s Question on Describing Things in EFL Classroom Interaction
Universitas Pendidikan Indonesia | repository.upi.edu | perpustakaan.upi.edu
experimental group versus that of the control group was calculated with
independent sample t-test to measure the initial ability of the two groups. Thirdly,
post-test of experimental group versus that of the control group was calculated
with independent sample t-test to measure the final ability of the two groups. The
last, the two sets of post-tests were calculated with Two-way ANOVA to examine
moderator variable, i.e. if the current ability of describing things by the use of
pre-head modifier affects the final ability.
3.3.2 Data of Recording
Recording data were obtained from transcription of interaction in both
experimental and control groups. The data have been analyzed in two categories.
Former is the analysis for uncovering the effect of modified questions on the
learners’ ability to describe things by the use of pre-head modifier from
qualitative aspect to support quantitative findings. The analysis were conducted by
comparing the success of teacher leading learners to describing things through
reciprocal interaction or not in the treatment process and comparing the learners’
performances in describing thing by the use of pre-head modifier in the
experimental group to those in the control group (see tables 3.1 and 3.2). The
latter is to uncover the implementation of modified teacher’s question in
treatment.
Table 3.1 the summary of question-led descriptions in experimental group Session
1
Session 2
Session 3
Nacep Asmara, 2014
The Effect of Modified Teacher’s Question on Describing Things in EFL Classroom Interaction
Universitas Pendidikan Indonesia | repository.upi.edu | perpustakaan.upi.edu
Successful meaning negotiation Unsuccessful meaning negotiation Total
To uncover the effect of modified questions qualitatively, there are two
kinds of qualitative data. Firstly, data recording of experimental group was
transcribed and analyzed to measure the strength of questions in leading learners’
to describe things by the use of pre-head modifier. The data consisted of some
transactions which were categorized into successful and unsuccessful meaning
negotiations or transactions. Then, they were quantified in a table as illustrated in
Table 3.1. The quantification was conducted to reveal their frequency of the
succeeded during the special treatment. The frequency was slotted per session so
the table showed it in detail apart from the total. Then, they were described
qualitatively.
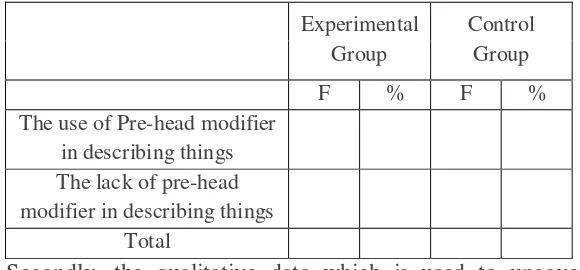
Table 3.2 the summary of the comparison learners’ description in
experimental group to those in control group
Experimental Group
Control Group
F % F %
The use of Pre-head modifier in describing things The lack of pre-head modifier in describing things
Total
Secondly, the qualitative data which is used to uncover the effect of
modified questions qualitatively is data from learners’ performance of the two
Nacep Asmara, 2014
The Effect of Modified Teacher’s Question on Describing Things in EFL Classroom Interaction
Universitas Pendidikan Indonesia | repository.upi.edu | perpustakaan.upi.edu
modified questions in leading learners’ to describe things. The data were
categorized into describing things by the use of pre-head modifier and without
pre-head modifier. Then, they were quantified in a table as illustrated in Table 3.2.
The quantification was conducted to reveal the frequency of the use of pre-head
modifier in describing things during the special treatment compared to
non-treatment. They were described qualitatively.
The last analysis is to uncover the implementation of modified teacher’s
question in the treatment. The data which is needed is the transcribed verbal data
which was treated in three steps. Firstly, the transcription was identified about the
things belonging to the types of modified questions (see table 3.3, 3.4 and 3.5) and
their use in managing classroom interaction (see table 3.6) by highlighting.
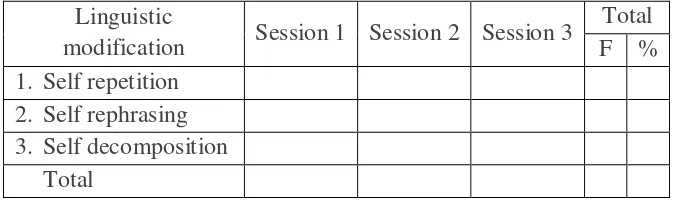
Table 3.3 Descriptive Quantification of Linguistically Modified Question
Linguistic
modification Session 1 Session 2 Session 3
Total F % 1. Self repetition
2. Self rephrasing 3. Self decomposition
Total
Secondly, the modified questions were sub-categorized into linguistically
modified questions including rephrase, self-repetition (see Chaudron 1988: 128)
and decomposition (see Wu, 1993: 56). The sub-category of linguistic
modification was quantified in a table as illustrated in Table 3.3. The
Nacep Asmara, 2014
The Effect of Modified Teacher’s Question on Describing Things in EFL Classroom Interaction
Universitas Pendidikan Indonesia | repository.upi.edu | perpustakaan.upi.edu
treatment. The frequency was slotted per session so the table showed it in detail
apart from the total. Then, they were described qualitatively.
Table 3.4 Descriptive Quantification of Interactionally Modified Question
Interactional modification Session
Thirdly, the modified question was sub-categorized into interactionally
modified questions including comprehension checks, clarification requests,
confirmation checks (see Pica et.al. 1985: 125) and probing question (see Pollard
2005: 302). The sub-category was quantified in a table as illustrated in Table 3.4.
The quantification was conducted to reveal their frequency during the special
treatment. The frequency was slotted per session so the table showed it in detail
apart from the total. Then, they were described qualitatively.
Table 3.5 Descriptive Quantification of modified Questions
Modification of Question Session 1 Session 2 Session 3 Total
F %
1. Linguistic modification
Nacep Asmara, 2014
The Effect of Modified Teacher’s Question on Describing Things in EFL Classroom Interaction
Universitas Pendidikan Indonesia | repository.upi.edu | perpustakaan.upi.edu
Fourthly, the modified question was categorized into linguistic and
interactional modification. The category was quantified in a table as illustrated in
Table 3.5. The quantification was conducted to reveal their frequency during
treatment. The frequency was slotted per session so the table showed it in detail
apart from the total. Then, they were described qualitatively.
Table 3.6 Descriptive Quantification of Classroom Interaction Management
Management of Classroom interaction
Session 1 Session 2 Session 3 Total
F %
3. Discourse Management
4. Repair Management Total
Then, the pattern of the use of modified question in managing classroom
interaction was classified into repair and discourse management (see Ellis, 1994:
257). The classifications were quantified in a table as illustrated in Figure 3.6. The
quantification was conducted to reveal their frequency during treatment. The
frequency was slotted per session so the table showed it in detail apart from the