Market-driven product and service design: Bridging the gap
between customer needs, quality management, and customer
satisfaction
Andreas Herrmann
*
, Frank Huber, Christine Braunstein
Johannes Gutenberg Universitat Mainz, 55099 Mainz, Germany
Received 22 October 1998; accepted 15 September 1999
Abstract
Bridging the gap between a "rm's internal quality improvements and external measures of customer needs and satisfaction is an important yet complex translation process. The process has traditionally been studied within two very di!erent domains. An external focus on customers has been the domain of marketers. Manufacturing and engineering-based approaches to quality management and improvement have traditionally taken a more internal, process improve-ment focus. Both areas have recognized the need to broaden their focus and bridge the gap between internal quality and external customers needs and satisfaction. This paper o!ers a framework to integrate these two domains. A case study is presented to demonstrate the usefulness of an integrated approach. ( 2000 Elsevier Science B.V. All rights reserved.
Keywords: Quality function deployment; Means}end analysis; Conjoint analysis; Product and Service design; Laddering interviews
1. Introduction
The signi"cance of product and service quality as a major competitive success factor is undisputed. There is no alternative to hard-fought buyers' mar-kets made up of critical, demanding customers to consistent quality orientation. Recently, however, the design of product quality has come to be seen not merely as the task of a single functional unit, but as a central challenge for any company. This altered perspective was brought about by the real-ization that superior products are available in many branches of industry, in terms of both price/cost and quality. This was accompanied by
*Corresponding author.
the recognition that the outstanding performance of Japanese manufacturers in particular cannot be entirely attributed to a higher, culturally founded level of employee commitment combined with a lower level of the quality function deployment concept (QFD)*which embraces all operational functions that is responsible for their market success [1,2].
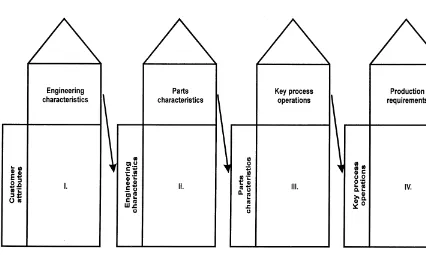
QFD can be described as an approach to prod-uct quality design, which attempts to translate the voice of the customer into the language of the engineer. The customer's wants are often called the`whatsa, or what QFD is ultimately supposed to improve [3,4]. Furthermore it is necessary to determine the `howsaor the design requirements that will determine how the`whatsaare to be
ful-"lled. The design requirements should be expressed
Fig. 1. Linked houses convey the customer's voice through manufacturing. in measurable terms (such as the amount of
pres-sure required to close a door system from the out-side). The core principle of this concept is a systematic transformation of customer require-ments and expectations into measurable product and process parameters. From the methodical point of view, it would appear useful to subdivide a quality planning process derived from customers' expressed wishes into four separate phases [5,6].
The House of Quality, which represents the"rst phase of the QFD concept, is concerned with trans-lating the purchase-decision-relevant attributes of a product that have been established [7}9], for example, within the framework of a conjoint study into design features (see Fig. 1). It is important to point out that these design require-ments are not design solutions, which do not ap-pear until the second house (part deployment). These design features are subsequently transformed into part features during the parts development phase. The aim of the work preparation phase is then to de"ne crucial operating procedures on the basis of the speci"ed part features. The crucial operating procedures in turn serve to determine
the production requirements in greater detail [10].
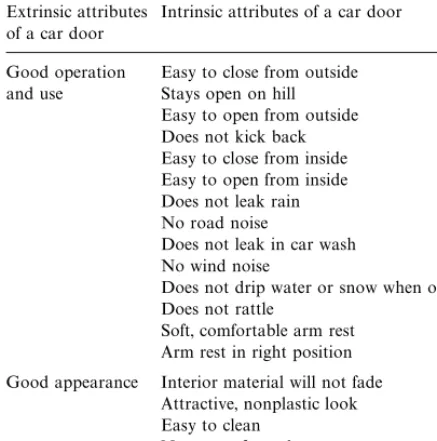
This approach suggests that the attributes of a product are crucial to a consumer's assessment of its usefulness [11]. However, it is not only the intrinsic (physical, chemical or technical) product attributes that determine the quality judgement [12, in particular pp. 222}232]. On the contrary, the value attached to a product is dependent on extrinsic (immaterial or non-functional) attributes, such as the brand name and aesthetic aspects. Table 1 gives somes examples for extrinsic and intrinsic attributes of a car door. Moreover, behav-ioural science studies have documented that the perception of product attributes by consumers * which is not necessarily identical to objective reality * controls purchasing patterns. The (per-ceived) attributes thus represent the most suitable determinants for conceiving marketing activities [13].
Table 1
Extrinsic and intrinsic attributes of a car door
Extrinsic attributes of a car door
Intrinsic attributes of a car door
Good operation and use
Easy to close from outside Stays open on hill Easy to open from outside Does not kick back Easy to close from inside Easy to open from inside Does not leak rain No road noise
Does not leak in car wash No wind noise
Does not drip water or snow when open Does not rattle
Soft, comfortable arm rest Arm rest in right position
Good appearance Interior material will not fade Attractive, nonplastic look Easy to clean
No grease from door
Uniform gaps between matching panels
Table 2
Attributes and bene"t components of a car Bene"t components of a car Attributes of a car Class membership Airbag
Additional prestige Sport chassis Quick reactions Engine power Performance Convenience of control Relaxation Sport seats
Impressing others Hi"system
Well-being Body shape
Aesthetics of design Bumper same colour as the car
utility (bene"t) components [14,15]. The bene"t components of a product (e.g. a car) re#ect its ability to ful"ll customers'needs, such as demon-strating class membership, conveying prestige, impressing others, enjoying safety. The intrinsic and extrinsic attributes describe the material and immaterial characteristics of a product, whereas the utility components denote its usefulness for prob-lem solving (see Table 2) [5]. This idea appears plausible, as buyers are only rarely aware of all the
bene"cial attributes of a product. In many cases it is
also true to say that di!erent attributes provide
a concrete utility and that one attribute can a!ect di!erent utility areas. Nevertheless, there is not normally a`one-to-onearelationship between the features and the utility components. This supposi-tion illustrates one of the dilemmas of marketing policy: when a company develops a product, it is only able to decide the levels of this product's intrinsic attributes. A consumer, on the other hand, bases his or her purchase decision on the utility conceptions derived from a perception of the prod-uct's attributes.
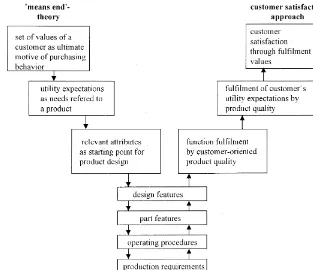
There is, however, cause to doubt that the utility expectations of the buyer do in fact constitute the ultimate explanation of purchasing behaviour. On the contrary, the motives for individual actions can be better accounted for by stimulating forces, such as a set of values and the formation of an intention [16}18]). Nevertheless, very little attention is paid to these hypothetical constructs when specifying a product's performance. There are two reasons for this:"rstly, numerous studies have documented the unsatisfactory association between these variables and purchasing behaviour. It is an undisputed fact that speci"c behavioural patterns cannot be pre-dicted, for example, on the basis of speci"c motives [19]. Secondly, there is no theory in existence at the present time which describes the interaction be-tween the hypothetical constructs and the relevant utility components and product attributes. Conse-quently, no evidence is available to support the notion that marketing activities are conceived ac-cording to the stimulating forces of purchasing behaviour. We contend that the various problems which are raised in this connection can be solved by extending the quality function deployment ap-proach from the point of view of marketing theory (see Fig. 2).
Fig. 2. The extended QFD-approach.
developed on the basis of the extended quality function deployment concept, corresponds to the consumer's utility expectations and to his set of values.
2. An extension of the quality function deployment approach
2.1. Means}end theory
The means}end theory is based on work carried out by Tolman. He "rst drew attention to the goal-oriented nature of individual behavior as early as the 1930s. The fundamental idea behind this approach is explained by Kroeber-Riel and Wein-berg as follows: `2the motivation to purchase a product is derived from the consumer's percep-tion of it as a suitable means for generating pleas-ant feelings and for gratifying desires2a [20, p. 142]. The suggestion is that*within the frame-work of an information-processing process * an
individual forms a conception of the suitability of the product in question (means) for ful"lling a
spe-ci"c want (end). At the same time, the supplier
attempts to set this cognitive process in motion and to in#uence it to his own advantage. In particular, he tries to guide the buyer's stimulating forces towards a particular product and to trigger a purchase motivation [21,22].
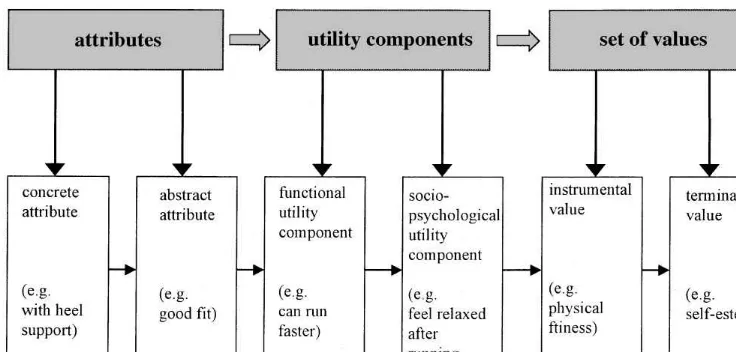
Fig. 3. The means}end concept.
It is initially useful to break down the attributes according to their level of abstraction [22,29]. An attribute is considered to be concrete if its various levels describe the physical}chemical}technical constitution (e.g. with heel supports) of a product (e.g. Nike sports shoes). It can generally be ob-served directly or measured objectively, and often exhibits a"nite number of discrete states. Whereas this type of attribute is normally only able to re#ect one facet of a phenomenon, an abstract attribute permits a comprehensive description of a product (e.g. good"t). The level of this type of attribute in a particular product depends on the subjective opin-ion of the individual rather than on objective facts. According to utility theory, the functional utility of a product is derived from its features [30}32]. This utility speci"es the usefulness of the product as well as embracing the consequences of the prod-uct's actual usage (e.g. can run faster). The socio-psychological utility, on the other hand, includes all extras which are not vital to the actual function of the product, for example product attributes which enhance the aesthetic appearance of the product or the social acceptability of the buyer (e.g. feel relaxed after running).
Rokeach has suggested that sets of values repres-ent series of individual standards*which remain constant over a period of time*serving to formu-late goals in life and to put them into practice in everyday behavior. A set of values thus constitutes
an explicit or implicit conception of ideals, charac-teristic of the individual concerned, which control the choice of a particular mode, instrument (means) and goal (end) of conduct. This view is also held by Rokeach, who de"nes a set of values as `2an enduring belief that a speci"c mode of conduct or end-state of existence is personally or socially pre-ferable to an opposite or converse mode of conduct or end-state of existence2a[33,34]. By`an endur-ing belief in preferable modes of conduct and end-states of existencea, the author does not simply mean a cognitive representation or conception of what must be done and achieved. He instead at-tributes a!ective and cognitive components to the set of values (or the goals in life) over and above the cognitive component. This idea stems from Rokeach's de"nition of the term `valuea as an `2intervening variable that leads to action when activated2a[33, p. 7; 35].
consist of moral and achievement-oriented values, whereas tolerance, willingness to help and a sense of responsibility are examples of moral values. The set of achievement-oriented values comprises such attributes as logical, intellectual and imaginative. In our example, `physical "tnessa can be classed as an instrumental value and `self-esteema as a terminal value [36,37].
The chain depicted in Fig. 3 which represents a small part of the knowledge structure of an indi-vidual [38,39], can be constructed using the
speci-"ed means}end elements. A consumer's intention
to purchase a product (e.g. Nike sports shoes) ini-tially causes the concrete (e.g. with heel supports) and abstract (e.g. good "t) attributes associated with it to be activated. This impulse is then propagated via the functional (e.g. can run faster) and socio-psychological (e.g. feel relaxed after run-ning) utility components before"nally reaching the instrumental (e.g. physical"tness) and terminal (e.g. self-esteem) values.
2.2. The customer satisfaction concept
A supplier is faced with the constant challenge of achieving maximum possible customer satisfaction. The signi"cance of the satisfaction rating for assess-ing the quality of a product derives from its func-tion as an indicator of actual purchasing behaviour [40]. The customer's (dis)satisfaction is the out-come of a complex information processing process, which essentially consists of a desired}actual comparison of a consumer's experience with a purchased product or service (actual) and his ex-pectations with regard to the"tness of this product or service for its intended purpose (desired). The congruence or divergence yielded by this compari-son between the perceived product quality and the anticipated quality is expressed as the consumer's (dis)con"rmation. Of the many attempted de" ni-tions, the one best suited for the purposes of this work is that put forward by Anderson: `2 con-sumer satisfaction is generally construed to be a postconsumption evaluation dependent on per-ceived quality or value, expectations and con" rma-tion/discon"rmation * the degree (if any) of discrepancy between actual and expected qual-ity2a[41, p. 20].
Whether or not an individual considers his ex-pectations to be con"rmed by a purchase, so that he is satis"ed with the performance of the supplier, is primarily dependent on the perceived quality. Quality perception is directly linked to the pur-chase and consumption experience, and can be
de"ned as a consumer's global judgement in
rela-tion to the "tness of a product for its intended purpose [42]. The individual concerned assesses each of the purchased product's attributes that are of relevance to him with regard to their suitability, and then integrates the partial ratings in accord-ance with a decision-making rule to obtain a qual-ity judgement. The buyer's expectations represent a speci"c level of quality that he hopes to"nd in the product. They serve as a yardstick for appraisal by the purchaser, which can be used to measure the consumed product or service. The level of expecta-tion is determined"rstly by previous consumption experiences, in other words by past encounters with the product in question [43]. Secondly * and this applies in particular to situations in which a product is purchased and consumed for the "rst time*the consumer obtains, in addition to other preliminary information, an idea of the quality of the contemplated product, above all from the prices of the available alternatives. If the product in ques-tion matches the consumer's conceptions in every respect, he will be satis"ed it.
The relevance of a satisfaction rating to the suc-cess of a company is evident [44]: as numerous studies have demonstrated, satis"ed customers ex-hibit considerable loyalty in respect of a product or service that they have already purchased previously from the same supplier. The repeat buying rate which is a consequence of this helps to secure a permanent sales basis for the company, so that loyal customers can be considered to represent an asset value.
supplier concerned, while at the same time restrict-ing the tactical options of his rivals. Even substan-tial price discounts or gratuitous additional services (such as delivery and maintenance free of charge) are likely to be insu$cient to entice away a satis"ed consumer.
Customer satisfaction moreover enhances the cross-selling potential of a supplier, as satis"ed cus-tomers display a greater tendency to purchase larger quantities or possibly other products or services belonging to the same range. Finally, an-other factor having a positive e!ect on the success of a company is the more marked inclination of satis"ed customers to relate the advantages of a product (and perhaps also the disadvantages of rival products) to other consumers [45]. This word-of-mouth advertising is distinguished by a high level of credibility, and the task of can-vassing new customers is consequently simpli"ed. In addition, the good reputation of the supplier which automatically ensues is useful when it comes to placing new products on the market successfully, or to occupying crucial sales channels and securing e$cient and capable sub-contractors.
The extent to which a manufacturer contrives to design the quality of a product in line with con-sumer's wishes is expressed by the satisfaction rating of the buyers. It is they who provide the necessary information about the success of product policy activities and thereby play a central role within the controlling system framework. By gathering judgements, it is possible to extrapolate means for improving the quality of a product or for assimilating it more closely with the conceptions of potential actual customers.
2.3. The extended quality function deployment approach
The standard QFD approach attempts to trans-late attributes of a product into design features. The design features are subsequently transformed into parts features, operational procedures and produc-tion requirements (see Fig. 1). This approach su!ers from two problems: Firstly, physical, chemical or technical product attributes are generally taken as a basis for specifying part features, operating
pro-cedures and production requirements. Modern marketing theory however suggests that consumers do not consider a product as a package of at-tributes, but rather think of it as a set of utility components, while behavioral scientists assert that stimulating forces, such as values, possess the most important impact on individual actions [12]. The means}end theory, to which considerable attention has been devoted in recent years by many re-searchers, enables the attributes relevant to the design of product quality to be associated with the determinants of purchasing behavior (set of values). Only by developing a product along these lines can such values be accomplished, and this accomplish-ment is subsequently re#ected in the customer's satisfaction with a company's performance. Sec-ondly, the standard QFD-approach does not pro-vide any framework or technique for measuring customer satisfaction. Since these judgements are important indicators of future purchasing behaviour, a company can improve its product by analysing customer satisfaction. In other words, the satisfaction ratings should be the basis for product
modi"cations.
Fig. 2 shows an extended QFD approach that enhances the standard QFD approach with two new aspects: Firstly, the model is used to take account not only of the purchase-decision-relevant product attributes, but also of the behav-iour-forming utility dimensions and values of the consumer. By considering utility dimension and values product development is associated to the actual drivers of individual actions. Secondly, the success of the product which is developed in such a way needs to be measured by customers' satisfaction ratings. These ratings re#ect the extend to which customers' need are ful"lled by the product and provide valuable advises for product improvement.
3. Market-driven product and service design at German Rail
During the course of the next few years, the market for long-distance railway passenger tra$c will undergo a radical transformation. One funda-mental innovation, which goes well beyond all EU regulations, came into e!ect in January 1994: third parties are in principle permitted access to the state railway network. Any company able to o!er a guarantee of safe operation is essentially allowed to use the railway lines in return for payment of a fee. This possibility of access to the railway network is also open to the trains of foreign operators (e.g. the Swiss Federal Railway and French National Railways). Conversely, German Rail will be al-lowed to use its own trains on foreign routes. In order to meet this challenge, German Rail is intro-ducing a system of market-oriented quality man-agement. This would appear to be the only feasible means of measuring the wants of potential and actual domestic and foreign passengers, and of transforming this data into a set of speci"cations for designing services. The various service o!ers put together in this way are veri"ed within the frame-work of a customer satisfaction study, in order to determine whether or not * and if so, to what extent * they correspond to customers' expecta-tions [46,47].
German Rail is to implement this concept in three steps, which are described here taking the example of the already competing Inter-City links on the route between Frankfurt and Paris:"rst of all, the wishes of potential and actual customers with regard to the quality of service on the InterCity trains in question must be determined. Various methods, such as the rep-ertory grid approach, the laddering interview, the content analysis and the laddering method are used for this purpose. The next step is to trans-form these abstract customer conceptions into concrete quality attributes. This task can best be accomplished by means of a conjoint analysis on the basis of the information acquired as de-scribed above. Finally, the "tness of the o!ered services for their intended purpose is examined, with particular emphasis on satisfaction measure-ment [48,49].
3.1. Identifying customer needs
The methods for transforming abstract customer expectations into concrete quality attributes (rep-ertory grid approach, laddering interview, content analysis and laddering method) are not applied in isolation within the framework of a means}end analysis, since it is only their interaction which enables precise starting points for designing servi-ces to be identi"ed. Their suitability can be demon-strated with the aid of a study conducted in April, May and June 1996 on the InterCity link between Frankfurt and Paris. A total of 186 respondents were interviewed (110 from Germany and 76 from France). The various constituent steps of these methods are described below [50].
The laddering interview represents a useful tool for determining the utility components of transport means and their underlying sets of values. It can be described as a non-standardised interview conduc-ted with a knowledge of psychology. The objective is to investigate the behaviour-forming forces which determine an individual's choice of alterna-tive. It consists of a series of consecutive `why?a questions designed to cause the respondents to reveal certain facets of their imagination, from ab-stract product attributes to terminal values. This procedure is summarized extremely succinctly by Olson and Reynolds [52, p. 82]: `The purpose of laddering is to force the consumer up the ladder of abstraction2to uncover the structural aspects of consumer knowledge as modeled by the means}end chain2a[53].
On this basis, the laddering interview can be described as an investigation technique comprising a series of interview rounds. The "rst round is concerned with establishing why the concrete at-tributes identi"ed by means of the repertory grid method (e.g. comfortable furnishings) carry such weight for the consumer's choice of a particular means of transport. The abstract attributes (e.g. pleasant journey) which are reconstructed from the answers form the basis for examining the functional utility components (e.g. feeling of luxury) of the alternatives in question in the second round. The aim of the third round is to develop a conception of the psychological utility components (e.g. feeling good) associated with the relevant means of trans-port, while taking account of the respondent's pre-vious mentions. The interview continues until the individuals have disclosed the desired information about their instrumental (e.g. enjoyment of life) and terminal (e.g. zest for life) values.
Following the interviews, methods of analysing the linguistic statements that have been set down in writing are applied. The approaches developed so far, which can all be subsumed under the heading of content analysis, essentially consist of heuristics for interpreting a transcribed interview. The primary aim of this work is not to elaborate a syntactic description of all 186 of the available data records, but rather to reconstruct the social reality of the selected travellers. It consequently appears reason-able to elevate the inference of text-external from
text-internal attributes to the status of the consti-tutive element of this content analysis. In doing so, we satisfy the methodical prerequisite for inferring the subjective reality from the available raw data or, put another way, the non-manifest context from the attributes of a manifest text.
The central propositions of any document can be revealed using words, sentences and paragraphs. The decision to employ a particular linguistic unit
(con"gurations) depends on where the pointers to
the determinants of individual behaviour are con-cealed. When specifying the most suitable con" g-urations for a study, it is important to remember that the document's message is frequently manifes-ted in a variety of linguistic units. The set of values of an individual, for example, can be expressed both by the sentenceI want to get the best out of lifeand by the word hedonism. It would however appear rash to draw conclusions about a respondent's set of values, for example, from individual con" gura-tions which express his or her positive or negative judgments in relation to speci"c phenomena. A word or a sentence usually only acquires its meaning when placed in a context with other lin-guistic units.
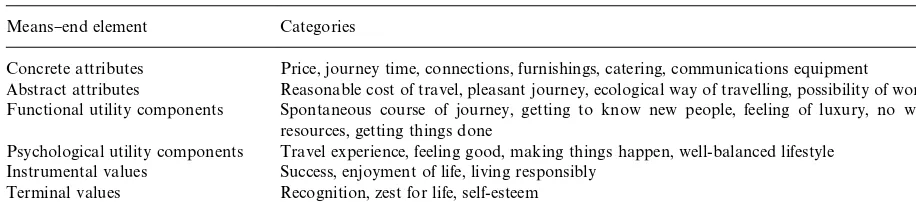
Owing to the extreme importance of a carefully elaborated system of categories for the results of the study, the available material was analysed by three recognized scientists. They are all quali"ed psy-chologists with extensive experience in interpreting raw data of this kind. The collection of the raw data can be described in two steps: Firstly, 186 repertory grid interviews were carried out in order to identify relevant attributes. Secondly, the same respondents were asked to participate in a laddering interview. The researchers took the stated attributes, bene"t components and values as a basis for de"ning a to-tal of 25 categories, corresponding to the individual elements of the means}end chain. Table 3 reveals, for example, thatlow priceandcomfortable furnish-ingsare concrete attributes, whereaszest for lifeand self-esteemrepresent terminal values.
Table 3
Means}end elements and their categories Means}end element Categories
Concrete attributes Price, journey time, connections, furnishings, catering, communications equipment
Abstract attributes Reasonable cost of travel, pleasant journey, ecological way of travelling, possibility of working Functional utility components Spontaneous course of journey, getting to know new people, feeling of luxury, no wasted
resources, getting things done
Psychological utility components Travel experience, feeling good, making things happen, well-balanced lifestyle Instrumental values Success, enjoyment of life, living responsibly
Terminal values Recognition, zest for life, self-esteem
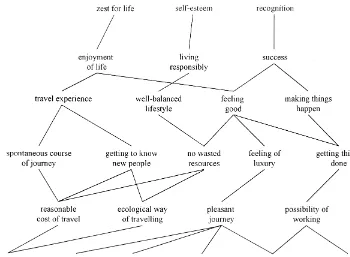
the eyes of the "rst respondent asked to choose a means of transport. This journey time is an indi-cator of a pleasant journey impression (abstract attribute). The customer sees an opportunity to get a lot of things done (functional utility component) and to make things happen (psychological utility component) by choosing a fast means of transport. This experience is perceived as a success (instru-mental value) and a means of gaining recognition from other people (terminal value). The second interviewee, on the other hand, is more concerned with a low level of harmful emissions from the chosen means of transport (concrete attribute). In this person's opinion, the environmental compati-bility of the transport alternative (abstract at-tribute) is crucial. This traveller wishes to choose a form of transport that wastes as few resources as possible (functional utility component), and in do-ing so to end up feeldo-ing good (psychological utility component). This mode of travel creates a feeling of living responsibly (instrumental value) and has the e!ect of enhancing self-esteem (terminal value).
These individual means}end chains can be com-bined to form a hierarchical value map, containing all the element connections mentioned most fre-quently by the respondents. Fig. 4 displays the hierarchical value map obtained for our study. 86% of all means}end chains mentioned by the respon-dents are shown in the "gure. Four di!erent pas-senger types were distinguished on the basis of the mapped means}end chains:
f The pleasure-seekers (60 respondents): The mem-bers of this group are conspicuous for their zest
for life. In their opinion, a journey is an experi-ence to be enjoyed. It is therefore very important to them to take a means of transport that o!ers a certain luxury. When choosing an alternative, they pay particular attention to the quality of the furnishings (e.g. seats, toilets) and to a good catering service.
f The price-conscious (33 respondents): The re-spondents that make up this group are distin-guished by their yearning for self-esteem. This is backed up by their aim of being there for other people and by their rejection of an extravagant lifestyle. They therefore subject the available transport alternatives to a comprehensive eco-nomic analysis. Their decision in favour of a par-ticular form depends ultimately on its price. f The adventurous (48 respondents): These
per-sons also exhibit a marked zest for life. Their desire to experience things as they travel is ex-pressed in the spontaneous course of the journey and in the fact that they make a large number of social contacts. Comfortable furnishings and an adequate catering service are particularly impor-tant in the eyes of these individuals.
Fig. 4. Hierarchical value map for railway services.
By taking additional sociodemographic data into consideration it can be seen that the descriptions of the four groups are not just labels. For example, 41 of the 48 business travellers (see group 4) are actual business people, whereas the other 7 individuals behave like business people and possess a utility and value system which is typical for business travellers. In fact some of the 7 respondents are retired managers, others are students, and some of them did not reveal their profession.
Now that the wishes of potential and actual customers have been determined, the next step is to transform these abstract customer expectations into concrete quality attributes. Conjoint measure-ment is a suitable methodical basis for specifying the services provided on German Rail's InterCity route between Frankfurt and Paris.
3.2. Creating services
In recent years the conjoint measurement method has proved extremely e!ective for
specify-ing corporate performance [12,54]. Numerous practical applications, such as the conception of a new car model, the development of detergents, planning of the services provided by an airline company, the structure of the individual compo-nents of collective bargaining agreements, modi" -cations to mechanical and plant engineering products and repositioning of delicatessen items, have demonstrated the enormous possibilities opened up by the conjoint measurement method for designing new products and for di!erentiating and varying existing ones [55,56].
Table 4
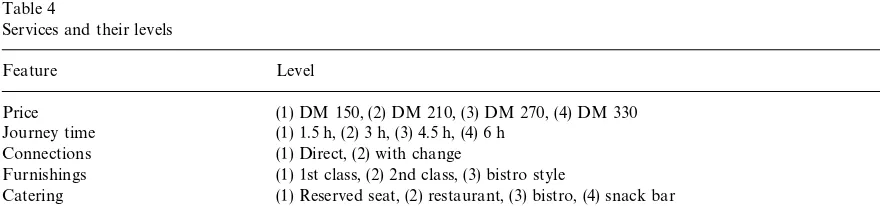
Services and their levels
Feature Level
Price (1) DM 150, (2) DM 210, (3) DM 270, (4) DM 330 Journey time (1) 1.5 h, (2) 3 h, (3) 4.5 h, (4) 6 h
Connections (1) Direct, (2) with change
Furnishings (1) 1st class, (2) 2nd class, (3) bistro style
Catering (1) Reserved seat, (2) restaurant, (3) bistro, (4) snack bar
Communications equipment (1) Telephone, fax and computer in conference room, (2) telephone, fax and computer workstation, (3) telephone
global judgement (decompositional approach). The alternatives in question are constructed prototypi-cally or"ctitiously by systematically combining the levels of all the attributes found to be signi"cant within the framework of the means}end analysis. The people responsible for production and for re-search and development can thus be provided with accurate information about the di!erent attribute levels of a product that is considered by potential consumers to be attractive.
To recapitulate, six distinct attributes (price, fur-nishings, catering, journey time, connections and communications equipment) are especially relevant to the choice of a particular means of transport (see Fig. 4). A preliminary study established that a total of 20 di!erent attribute levels are important (see Table 4).
From these attribute levels 1152 ("4]4]2]
3]4]3) di!erent means of transport can
theoret-ically be constructed. However, in order to avoid overtaxing the respondents and to restrict the amount of collected data, an experimental design was used, allowing the number of possible combi-nations to be reduced to 24 di!erent alternatives without losing any vital information. Variant 1, for example, consists of the following levels: ticket price DM 150, journey time 3 hours with no change, 2nd class, snack bar, telephone, fax and computer work-station. Variant 24, on the other hand, is made up of a ticket price of DM 270, a journey time of 4.5 hours, including a change, 1st class, with restaurant and telephone.
The 186 test persons were given the task of ar-ranging the 24 descriptions presented to them on cards in order of preference. The resulting ranking
order was then used as data input for the conjoint measurement method. The analysis yields were normalised, directly comparable partial utility values for the individual attribute levels. The at-tribute utility bands shown in Table 5 indicate the importance of these values (separately according to target groups). The table also shows the (segment-speci"c) partial utility values of each attribute, which express the attributes' relative importance for the formation of an order of preferences.
Amongst other things, the results (which have been modi"ed slightly out of consideration for Ger-man Rail) reveal that for the adventurous group the most important attribute is the price (25%), fol-lowed by the furnishings (23%) and the catering (20%). The business travellers, on the other hand, pay the greatest attention to the communications equipment (22%), the furnishings (20%) and the journey time (16%). In addition, it is noticeable that in the pleasure-seeking segment, for instance, an increase in the ticket price from DM 150 to DM 210, from DM 210 to DM 270 and from DM 270 to DM 330 results in a reduction in utility of 0.041 ("0.132!0.091), 0.008 ("0.091!0.083) and
0.072 ("0.083!0.011) units respectively. The willingness of passengers to pay for individual at-tributes can be determined simply by propor-tionalising the partial utility values obtained with this calculation. 0.121 ("0.132!0.011) utility
units correspond to approximately DM 180 ("DM 330!DM 150) for this segment. These
variables can be used directly to express the value of individual service dimensions in price units.
The &communications equipment' attribute, for
Attributes Attribute levels Passenger types
The pleasure seekers The price conscious The adventurers The business travellers
Part worth of attribute level
Attribute importance
Part worth of attribute level
Attribute importance
Part worth of attribute level
Attribute importance
Part worth of attribute level
Attribute importance
Price (1) DM 150 0.132 43% 0.231 69% 0.069 25% 0.051 15%
(2) DM 210 0.091 0.113 0.061 0.044
(3) DM 270 0.083 0.091 0.041 0.031
(4) DM 330 0.011 0.000 0.021 0.022
Journey time (1) 1.5 h 0.061 11% 0.059 9% 0.059 16% 0.060 16%
(2) 3 h 0.052 0.048 0.047 0.051
(3) 4.5 h 0.041 0.040 0.041 0.039
(4) 6 h 0.030 0.029 0.028 0.028
Connections (1) Direct 0.035 6% 0.034 3% 0.042 9% 0.042 14%
(2) With change 0.020 0.022 0.024 0.013
Furnishing (1) 1st class 0.081 17% 0.062 8% 0.063 23% 0.054 20%
(2) 2nd class 0.052 0.053 0.049 0.048
(3) Bistro style 0.030 0.043 0.022 0.013
Catering (1) Reserved seat 0.081 20% 0.057 7% 0.059 20% 0.040 13%
(2) Restaurant 0.062 0.052 0.051 0.038
(3) Bistro 0.044 0.045 0.030 0.016
(4) Snack bar 0.020 0.040 0.021 0.014
Communications equipment
(1) Telephone, fax and computer in conference room
0.020 3% 0.031 4% 0.037 7% 0.056 22%
(2) Telephone, fax and computer work station
0.018 0.023 0.031 0.037
(3) Telephone 0.012 0.018 0.023 0.013
A.
Herrmann
et
al.
/
Int.
J.
Production
Economics
66
(2000)
77
}
96
&telephone, fax and computer in conference room' level (0.020) and the&telephone'level (0.012). This di!erence of 0.008 utility units can be converted to
a"gure of around DM 11.
Assuming the same overall utility, the members of this group are thus willing to pay DM 11 more to travel on the InterCity route between Frankfurt am Main and Paris if the train is equipped with a tele-phone, fax and computer workstation than if it is only able to o!er a telephone. A reduction in the journey time from 3 hours (0.052) to 1.5 hours (0.061), on the other hand, appears to interest them relatively little. Furthermore, a direct connection (0.035) does not signi"cantly enhance the attract-iveness of the transport service as compared with a journey involving a change (0.020). If, however, German Rail o!ers a"rst-class journey (0.081) in-stead of/or as well as a second class trip (0.052), the overall utility can be increased by 0.029 ("0.081!0.052). This improved utility that results
from the more luxurious furnishings is rewarded by a willingness to pay an additional DM 43.
An enhancement of the o!ered range of services constitutes an advantage from the point of view of the customer, providing the overall utility gain brought about by varying the service components is greater than the utility loss caused by the higher price. On the other hand, it is not di$cult to imagine that it could prove extremely expensive for German Rail to put together exactly the pack-age of services that is considered by passengers to o!er the maximum utility. Although o!ering this service bundle might well lead to an increase in the market share, this would not necessarily be accompanied by a rise in pro"ts. German Rail would consequently be well advised when design-ing its service packages to concentrate on those attribute levels which o!er a high utility value to passengers, while requiring relatively little e!ort on the part of the operator. The relevant attributes might thus also be termed low-cost utility drivers. The outcome of this approach is that the measured partial utility values are contrasted with the costs involved. It is therefore ideal for assembling a ser-vice bundle that maximises pro"ts rather than mar-ket shares.
We must"rst determine the variable costs of the individual attribute levels before turning our
atten-tion to identifying the low-cost utility bringers. Since this information is con"dential, we are unable to give details of these costs here. A set of services that together constitute a service bundle and that embody the essence of the advertising message was determined for each segment on the basis of
cost}bene"t criteria. These packages were
con-structed by weighing up the partial utility values and the variable costs of each attribute level (out of consideration for German Rail, we cannot specify these any further). They are not optimum-utility bundles designed to achieve the maximum possible market share, but rather packages aimed at maxi-mising pro"ts by addressing customers'wishes and bearing in mind the costs they entail [57].
The means}end chains shown in Fig. 4 can be used together with Table 5 to orient the range of o!ered services towards speci"c segments. These chains indicate which attributes, utility compo-nents and sets of values the members of each group associate with the di!erent transport services. This information can be taken as a basis for elaborating a service * which is linked by the passengers in a particular cluster to all the elements of their own means}end chain*in accordance with marketing principles. A service bundle designed in this way, backed up by a corresponding advertising message, is a prerequisite of a corporate performance that is capable of gratifying wants on all levels.
Having speci"ed the InterCity services between Frankfurt and Paris, it was interesting to observe the success of these measures. Six months after their implementation, we therefore measured the satis-faction of passengers with the services o!ered by German Rail. The widely used concept of customer satisfaction formed the methodical basis for this study.
3.3. Measuring customer satisfaction
An empirical study conducted in June and July 1997 attempted to measure the satisfaction of 442 passengers with the service o!ered by German Rail on the route in question, and to provide a basis for deriving possible courses of marketing action. Fol-lowing the example set by other similar empirical analyses, the theoretical concept of `satisfactiona was subdivided into two separate components. The cognitive component expresses the perceived qual-ity of the services, while the a!ective component provides an indication of their importance. This method of investigation demands that the relevant dimensions be chosen very carefully. The concrete attributes identi"ed as relevant with the aid of the means}end analysis thus suggest themselves here. To recollect, these attributes are price, journey time, connections, furnishings, catering and com-munications equipment.
The importance of the individual service dimen-sions for the interviewed persons must be estab-lished "rst of all. The passengers can then be subdivided into various segments according to these mentions. Once these clusters have been
iden-ti"ed on the basis of the importance judgements, it
is possible to verify the"tness of the segments that were derived from the partial utility values. In the event that this new approach also yields`pleasure seekersa, `price consciousa, `business travellersa and `adventurousa clusters, the four-group solu-tion is con"rmed as a suitable method for seg-ment-speci"c market analyses.
The data was collected by asking the respondents to state the importance of the individual service dimensions on a scale ranging from 1 (not impor-tant at all) to 7 (very imporimpor-tant). A cluster analysis was used to subdivide the interviewed persons into segments according to the proximity of their
importance judgements. The clusters are formed by grouping together those individuals whose import-ance judgements exhibit the greatest similarity; the clusters themselves are as dissimilar as possible.
These importance judgements of the 442 respon-dents serve as input for a hierarchical classi"cation. Based on the clustering agglomeration coe$cient the four-segment solution was chosen after analys-ing the results [54]. The importance values shown for the service dimensions in Table 6 can be cal-culated for each group from the cluster mean values for the individual variables. It can be seen that the furnishings of the InterCity train and the catering are the most relevant attributes for the members of cluster 1. These mentions are in line with the wishes postulated by the pleasure seekers. The respon-dents belonging to group 2, on the other hand, pay particular attention to the price. Their wants thus coincide with those of the price conscious passen-gers. The respondents subsumed within group 3 set great store by the furnishings and the catering. A glance at the importance ratings accorded to the other attributes is su$cient to con"rm a similarity with the pro"le of the adventurous passengers. As far as the individuals that make up group 4 are concerned, it is the communications equipment, the journey time and the furnishings that are especially relevant. They thus focus on the same attributes as the business travellers.
The test persons were subsequently asked to specify their satisfaction with the individual ser-vice dimensions on a scale from 1 (very dissatis"ed) to 7 (very satis"ed). The satisfaction values determined for the four above-mentioned clusters are shown in Table 6. If the importance values contained in this table are compared with the satisfaction values, it can be seen that the service considered by each group to be the most satisfactory is not necessarily also the most important. This can be shown by means of a cor-relation analysis. This method measures the strength of the correlation between the importance of a particular service and satisfaction with it as expressed by the respondents in each group, and identi"es the correlation direction (parallel or anti-parallel).
The values obtained in this way were 0.77 for
Tab
second group (price conscious), 0.33 for cluster 3 (adventurous) and !0.47 for group 4 (business
travellers). Although the overall level of satisfaction with the performance of the railway is very low, these"gures reveal that the passengers belonging to groups 1 and 3 are relatively satis"ed with those service dimensions they consider to be most impor-tant. In the case of the customers in groups 2 and 4, on the other hand, there is a negative correlation between the two variables.
It is evident from the results of the empirical study"rstly that there is a considerable need for service improvement on the part of German Rail with regard to the InterCity route between Frank-furt and Paris. The very poor performance on every dimension explains why German Rail su!ers a competitive disadvantage especially with regard to other players in the transportation sector, such as airlines or cars. An analysis of the actual perfor-mance of German Rail on every dimension reveals that the design of each service is meets customers needs, but the way the services are delivered is very often poor. For example, many travellers complain the limited selection of beverages and sandwiches. In some cases light hot meals, such as hot dogs, pizzas, and spaghettis with tomato sauce, were cold when they were served. Another serious problem is the communication equipment in InterCity trains. It turned out that it was impossible to make a long distance call when the train was between Saar-bruKcken and Metz. The reason for this service fail-ure is the limited compatibility of the German and the French telephone system.
aeroplanes, in order to emphasise the attractiveness of travel by train [58,59].
The passengers that make up cluster 4 (business travellers), on the other hand, are concerned above all with comfortable furnishings, a short journey time and communications equipment. Regular care and maintenance of the"rst-class carriages is thus extremely important. It would also be a good idea to accept hire car and taxi bookings on behalf of passengers, and to provide detailed information regarding connections. It could furthermore prove advantageous for German Rail to cooperate with airlines in order to make travelling more conve-nient for business travellers. Stressing the perfor-mance of the communications equipment available in the train, along with the various other oppor-tunities for accomplishing work of all kinds, might likewise constitute a strategy for success. We there-fore recommend establishing contact with a variety of corporate organisations with a view to imparting the particular merits of railway travel to business travellers.
The usefullness of all these recommendations can
be"gured out by considering the means}end chains
in Fig. 4. In order to attract more business travel-lers all additional services, such as taxi booking and cooperation with airlines and haulage contractors, must be associated with the utility and value expec-tations of these passengers. So German Rail need to explain that these services ful"ll expectations like feeling of luxury,getting things done, making things happen,feeling goodetc. (see Fig. 4).
4. Implications
Bridging the gap between a"rm's internal qual-ity improvements and external measures of cus-tomer needs and satisfaction is an important yet complex translation process. The translation runs all the way from customer needs, to product and service attributes, through design, to production and service maintenance processes, and to cus-tomer satisfaction. This process has traditionally been studied within two very di!erent domains. An external focus on customers has been the domain of marketers. Manufacturing and engineering-based approaches to quality management and
improve-ment have traditionally taken a more internal, pro-cess improvement focus.
Both areas have recognized the need to broaden their focus and bridge the gap between internal quality and external customer needs and satisfac-tion. Engineers have become increasingly customer focused and strive to incorporate the voice of the customer into quality improvement models and methods, as evidenced by the growing use of qual-ity function deployment and its house of qualqual-ity. Similarly, externally focused market and consumer researchers have become more internally focused as they strive to translate customer needs and satisfac-tion into acsatisfac-tion implicasatisfac-tions. Simply put, both en-gineers and marketers are learning to wear multiple hats in a cooperative e!ort to increase business performance.
Bridging the gap between customer needs, prod-uct quality, and customer satisfaction requires a broad-based view in which external measures are translated into internal means of accomplishment. Existing translation tools and methods capture some, but not all, of this translation process. The framework developed here links a popular engin-eering-based translation method, quality function deployment, with a popular market-based ap-proach, customer needs and satisfaction modeling. Together these approaches describe the breadth of activities involved in the translation process. Integ-ration of the two approaches into a single frame-work, as described in Fig. 2, highlights several important phases in the translation process.
Both quality function deployment (QFD) and customer needs and satisfaction modelling (CNSM) use the similar logic: set priorities to improve those
bene"ts, attributes, or internal processes that are
important to customers and on which product or service performance is poor. CNSM adopts the `lensa of the customer to set priorities from cus-tomer needs to product and service attributes. QFD targets attributes and translates them through design and production. The methods thus operationalize very di!erent yet complementary levels of the overall translation process. This comp-lementarity is illustrated here using the customer needs and satisfaction model of German Rail.
Magna, Volvo, and Italian Telecom have adopted this extended QFD-approach the methodology has proved to be usefull in several sectors. The Germain Rail example and the lessons learnt from other companies also identify hidden problems in the interface between the methods and the potential solutions. The distinction between bene"ts and at-tributes in CNSM is obscured in QFD; primary attributes in QFD are more abstract bene"ts while secondary and tertiary attributes in QFD are more concrete attributes. The implication is that very di!erent approaches to measurement are required at the di!erent levels; whereas bene"ts are latent variables that can only be measured indirectly us-ing an index of survey measures, attributes are measurement variables that can be operationalized directly using individual survey questions. It is ex-tremely important for the success of the whole procedure that the qualitative interviews are car-ried out very carefully. Therefore only quali"ed psychologists with extensive experience should be recruited for collecting, analysing and interpreting the data. All other steps are much more structured by the underlying techniques, such as conjoint or cluster analysis, with far less space for indivdiual interpretation.
Two additional problems relate to consistency in the methods used to set priorities at di!erent levels of the translation. The priority setting process is confounded when di!erent approaches are used to measure bene"t and attribute importance. Ideally, the method should involve statistical estimation of importance as the impact that a bene"t or attribute has on customer satisfaction. Statistical estimation based on Conjoint Measurement is more objective and avoids many of the biases inherent in self-reported measures of importance.
Performance benchmarks should also remain consistent throughout the priority setting process. Otherwise the targeting of particular attributes or processes for improvement may be an artifact of the performance benchmarks used. Whereas bench-marks in CNSM and early in QFD tend to be more market segment driven or competitively relevant, benchmarks often grow to include admired peers outside an industry as the translation continues. While this broadening is important to point out what is possible in a product or service
develop-ment process, it can confound the priority setting process per se and compromise customer focus.
References
[1] A. Gustafsson, F. Ekdahl, QFD}the Swedish experience, The Ninth Symposium on Quality Function Deployment, QFD Institute, Ann Arbor, MA, 1997.
[2] A. Gri$n, J. Hauser, The voice of the customer, Marketing Science 12 (1993) 1}27.
[3] D. Clausing, Total Quality Development, New York, 1994. [4] L. Cohen, Quality Function Deployment, Reading, 1996. [5] J. Hauser, D. Clausing, The house of quality, Harvard
Business Review (1988) 63}73.
[6] A. Gri$n, J. Hauser, Patterns of communication among marketing, engineering and manufacturing, Management Science 38 (1992) 360}373.
[7] Y. Akao, Quality Function Deployment: Integration Cus-tomer Requirements into Product Design, Cambridge, 1990.
[8] G. Mazur, Service QFD: State of the art, in: A. Gustafsson, B. Bergman, F. Ekdahl (Eds.), Proceedings of the Third Annual International QFD Symposium, Vol. 1, LinkoK p-ing, Sweden, 1997, pp. 57}66.
[9] S. Mizuno, Y. Akao, QFD: The Customer-Driven Approach to Quality Planning and Deployment, Tokyo, Japan, 1994.
[10] M. Revelle, M. Cox, The QFD Handbook, New York, 1998.
[11] K.J. Lancaster, A new approach to consumer theory, Jour-nal of Political Economy 32 (1966) 132}157.
[12] G.L. Urban, J.R. Hauser, Design and Marketing of New Products, 2nd Edition, Englewood Cli!s, NJ, 1993. [13] J. Hauser, How Puritan-Bennett uses the house of quality,
Sloan Management Review 34 (1993) 61}70.
[14] T. Grae!, Comprehending product attributes and bene"ts: the role of product knowledge and means}end chain in-ferences, Psychology and Marketing 14 (1997) 163}183. [15] J.H. Myers, E. Tauber, Market Structure Analysis,
Chicago, 1977.
[16] R. Bagozzi, Goal-directed behavoirs in marketing: the role of emotion, volition, and motivation, Psychology and Marketing 14 (1997) 309}313.
[17] S. Beatty, L.R. Kahle, P. Homer, S. Misra, Alternative measurement approaches to consumer values: the list of values and the Rokeach value survey, Psychology and Marketing 12 (1995) 181}200.
[18] M. Frese, J. Stewart, B. Hannover, Goal orientation and planfulness: Action styles as personality concepts, Journal of Personality and Social Psychology 62 (1987) 1182}1194.
[19] W. Hoyer, D. MacInnes, Consumer Behavior, Houghton, 1997.
[21] J.C. Olson, Theoretical foundations of means}end chains, Working Paper, Pennsylvania State University, University Park, 1988.
[22] J.P. Peter, J.C. Olson, Consumer Behavior, 2nd Edition, Homewood, 1990.
[23] J.B. Cohen, The structure of product attributes: De"ning attribute dimensions for planning and evaluation, in: Shocker, A.D. (Eds.), Analytic Approaches to Product and Marketing Planning, Cambridge, 1979, pp. 54}86. [24] J.A. Howard, Consumer Behavior: Application and
The-ory, New York, 1977.
[25] J.H. Myers, A.D. Shocker, The nature of product related attributes, Working Paper, University of Chicago, Chicago, 1980.
[26] J. Gutman, A means}end chain model based on consumer categorization processes, Journal of Marketing 46 (1982) 60}72.
[27] T.J. Reynolds, J. Gutman, Laddering: Extending the rep-ertory grid methodology to construct attribute} conse-quence}value hierarchies, in: R.E. Pitts, A.G. Woodside (Eds.), Personal Values and Consumer Psychology, Lexington, 1984, pp. 155}168.
[28] J. Gutman, T.J. Reynolds, Laddering theory, methods, analysis, and interpretation, Journal of Advertising Research 28 (1988) 11}31.
[29] A. Tversky, K. Hemenway, Objects, parts, and categories, Journal of Experimental Psychology 13 (1984) 169}193. [30] K. Grunert, S. Grunert, Measuring subjective meaning
structures by the laddering method: Theoretical consider-ations and methodological problems, International Jour-nal of Research in Marketing 12 (1995) 209}225. [31] R.P. Bagozzi, P.A. Dabholkar, Consumer recycling
goals and their e!ect on decisions to recycle: A means}end chain analysis, Psychology and Marketing 11 (1994) 313}340.
[32] P. Valette-Florence, A causal analysis of means}end hierarchies in a cross-cultural context: Methodological re"nements, Journal of Business Research 42 (1998) 161}166.
[33] M. Rokeach, The Nature of Human Values, New York, 1973.
[34] T.J. Reynolds, C.E. Gengler, D.J. Howard, A means}end analysis of brand persuasion through advertising, Interna-tional Journal of Research in Marketing 12 (1995) 257}266.
[35] M. Rokeach, Beliefs, Attitudes and Values: A Theory of Organization and Change, San Francisco, 1972. [36] D. Winter, O. John, A. Stewart, E. Klohnen, L. Duncan,
Traits and motives: Toward an integration of two tradi-tions in personality research, Psychological Review 19 (1998) 230}250.
[37] R.G. Pieters, H. Baumgartner, H. Stad, Diagnosing means}end structures: The perception of word-processing software and the adaptive-innovative personality of man-agers, in: J. Bloemer, J. Lemmink, H. Kasper (Eds.), Pro-ceedings of the 23rd EMAC Conference, Maastricht, 1994, pp. 749}763.
[38] C.E. Gengler, T.J. Reynolds, Consumer understanding and advertising strategy: Analysis and strategic translation of laddering data, Journal of Advertising Research 35 (1995) 19}33.
[39] A. Jolibert, G. Baumgartner, Values, motivations, and personal goals: Revisited, Psychology and Marketing 14 (1997) 675}688.
[40] E. Anderson, C. Fornell, D. Lehmann, Customer satisfac-tion, market share, and pro"tability: Findings from Sweden, Journal of Marketing 58 (1994) 53}66.
[41] E.W. Anderson, Cross-category variation in customer satisfaction and retention, Marketing Letters 5 (1994) 19}30.
[42] V.A. Zeithaml, Consumer perceptions of price, quality, and value: A means}end model and synthesis of evidence, Journal of Marketing 52 (1988) 2}22.
[43] C. Fornell, A national customer satisfaction barometer: the Swedish experience, Journal of Marketing 56 (1992) 6}21.
[44] E.W. Anderson, M.W. Sullivan, The antecedents and con-sequences of customer satisfaction for"rms, Marketing Science 12 (1993) 125}143.
[45] F.F. Reichheld, W.E. Sasser, Zero defections: Quality comes to services, Harvard Business Review 68 (1990) 105}111.
[46] J. Deighton, Managing services when service is a perfor-mance, in: Rust, R.T., Oliver, R.L. (Eds.), Service Quality: New Directions in Theory and Practice, Thousand Oaks, 1994, pp. 123}138.
[47] L. DubeH, M.D. Johnson, L.M. Renaghan, Adapting the QFD approach to extended service transactions, Working Paper, McGill University, Montreal, 1998.
[48] R. Rust, R. Oliver, Service quality: Insights and managerial implications from the frontier, in: R.T. Rust, R.L. Oliver, (Eds.), Service Quality: New Directions in Theory and Practice, Thousand Oaks, 1994, pp. 3}27.
[49] V.A. Zeithaml, A. Parasuraman, L.L. Berry, Delivering Service Quality, New York, 1990.
[50] Y. Akao, QFD - Past, present and future, in: A. Gustafs-son, B. Bergman, F. Ekdahl (Eds.), Proceedings of the Third Annual International QFD Symposium, Vol. 1, LinkoKping, Sweden, 1997, pp. 19}29.
[51] A. Gri$n, Evaluating QFD's use in US"rms as a process for developing products, Journal of Product Innovation Management 9 (1992) 171}187.
[52] J.C. Olson, T.J. Reynolds, Understanding consumer cogni-tive structures: Implications for advertising strategy, in: L. Percy, A. Woodside (Eds.), Advertising and Consumer Psychology, Lexington, 1983, pp. 77}90.
[53] F. Hofstede, A. Audenaert, J.B. Steenkamp, M. Wedel, An Investigation into the associaton pattern technique as a quantitative approach to measuring means}end chains, International Journal of Research in Marketing 15 (1998) 37}50.
[55] A. Herrmann, F. Huber, A. Gustafsson, From value-oriented quality improvement to customer satisfaction}
a case study for passenger cars, in: M. Johnson, A. Herrmann, F. Huber, A. Gustafsson (Eds.), Customer Retention in the Automotive Industry: Quality, Satisfac-tion and Loyalty, Wiesbaden, Germany, 1997, 93}115. [56] M.D. Johnson, Customer Orientation and Market Action,
Upper Saddle River, 1998.
[57] A. Gustafsson, M.D. Johnson, Bridging the quality-satis-faction-gap, in: Gustafsson, A. (Ed.), Customer Focused Product Development by Conjoint Analysis and QFD, LinkoKping, 1996, pp. 55}84.
[58] T. Ohfuji, T. Noda, J. Ogino, Quality function deployment for the service industry, in: Y. Akao (Ed.), Quality Function Deployment: Integration Customer Re-quirements into Product Design, Cambridge, 1990, pp. 300}327.