The Economics of Climate Change
The impact of climate change is arguably one of the most significant challenges facing the world today. Mitigating this impact will require profound changes in many economic, business, political and industrial spheres.
This book provides a rigorous analytical assessment of the key issues at the heart of the economics of climate change such as:
• the economics of the Kyoto Protocol; • Cost-Benefit Analysis and climate change; • developing countries and climate change.
With contributions from recognized international authorities in their respec-tive disciplines, this readable, salient book will be appreciated by academics and postgraduate students with an interest in environmental economics, climate change and energy economics. The book will also appeal to environmental con-sultants as well as policy makers.
Routledge explorations in environmental economics
Edited by Nick Hanley
University of Glasgow1 Greenhouse Economics
Value and ethics Clive L. Spash
2 Oil Wealth and the Fate of Tropical Rainforests
Sven Wunder
3 The Economics of Climate Change
The Economics of Climate
Change
First published 2004 by Routledge
11 New Fetter Lane, London EC4P 4EE Simultaneously published in the USA and Canada by Routledge
29 West 35th Street, New York, NY 10001
Routledge is an imprint of the Taylor & Francis Group
©2004 editorial matter and selection, Anthony D. Owen and Nick Hanley; individual chapters, the contributors
All rights reserved. No part of this book may be reprinted or reproduced or utilized in any form or by any electronic, mechanical, or other means, now known or hereafter invented, including photocopying and recording, or in any information storage or retrieval system, without permission in writing from the publishers.
British Library Cataloguing in Publication Data
A catalogue record for this book is available from the British Library
Library of Congress Cataloging in Publication Data
A catalog record for this book has been requested
ISBN 0-415-28724-3
Dedicated to
Jackie, Catherine and Rhys (A.D.O.)
Fiona, Rose, Charlie and Finn (N.H.)
This edition published in the Taylor & Francis e-Library, 2004.
ISBN 0-203-49578-0 Master e-book ISBN
Contents
List of figures List of tables List of boxes Acknowledgements List of contributors List of abbreviations
1 Introduction
A N T H O N Y D . O W E N A N D N I C K H A N L E Y
2 Global warming: scientific modelling and its relationship to the economic dimensions of policy
I A N M O F F A T T
3 From negotiation to implementation: the UN Framework Convention on Climate Change and its Kyoto Protocol
J O A N N A D E P L E D G E
4 Climate protection: what insight can economics offer?
J A S O N S H O G R E N
5 The economics of the Kyoto Protocol
M I C H A E L G R U B B
6 The role of economic instruments
F A N N Y M I S S F E L D T A N D J O C H E N H A U F F
7 Cost-Benefit Analysis and climate change
8 Economic modelling of global climate change
W A R W I C K J . M c K I B B I N A N D P E T E R J . W I L C O X E N
9 The role of energy prices in global climate change
B R I A N S . F I S H E R A N D M I K E D . H I N C H Y
10 Project-based mechanisms: baselines, additionality and monitoring
J A N E E L L I S
11 Developing countries and climate change
A N I L M A R K A N D Y A A N D K I R S T E N H A L S N A E S
12 The transition to renewable energy
Figures
2.1 CO2concentrations and estimated temperature changes during
the last 160,000 years
2.2 Global mean combined land–air and sea–surface temperatures, 1861–1989
2.3 Major mechanisms of climate change and their time scales of operation
2.4 Concentrations of greenhouse gases measured in air at Cape Grim, Tasmania
2.5 Simulated global annual mean warming from 1860–1990 2.6 Four alternative scenarios of global warming
2.7 Global CO2emissions related to energy and industry and land
use changes
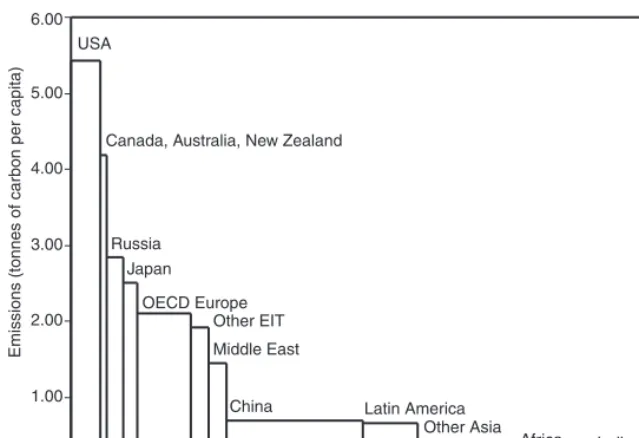
5.1 CO2emissions in 2000, per capita and population
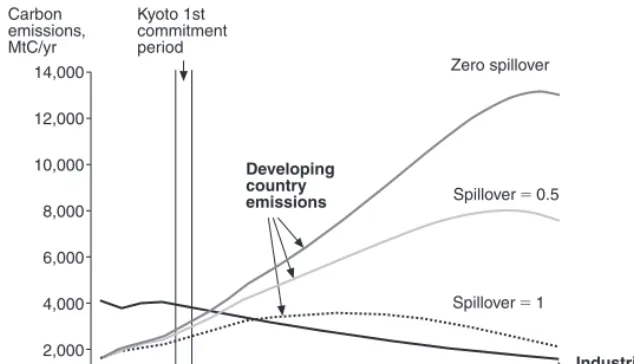
5.2 Kyoto first period commitments in context: global emissions dependence upon follow-up and spillover
5.3 Impact of international trading on abatement costs 5.4 Kyoto commitments and trading potential
5.5 Impact of trading EIT emission surplus (‘hot air’) on permit price and EIT revenues
6.1 Economic equilibrium taxes and choice of permit quota 6.2 Incentive for innovation
6.3 Grandfathering of permits 6.4 Auction of permits/carbon taxes
6.5 Share of environmental taxes as part of the total tax revenue in OECD countries
8.1 Median carbon tax needed in 2010 to achieve Kyoto target, by region
8.2 Median GDP loss in 2010 under Kyoto targets, by region 10.1 Influence of number of sample plots on the monitoring cost and
11.1 Costs of reducing carbon with flexibility 11.2 The prototype Carbon Fund
11.3 Impact of carbon finance on a sample of renewable efficiency projects
12.1 Impact of an externality
12.2 The impact pathway methodology 12.3 Coal-based electricity chain
Tables
2.1 1987 greenhouse gas concentrations, trends and degree of forcing relative to CO2
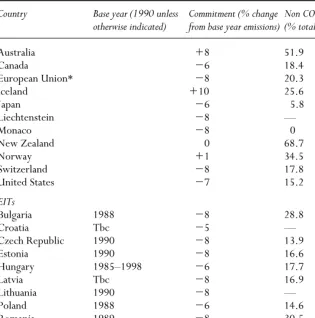
2.2 Currently proposed targets for 2010, based on 1990 CO2
emission levels
3.1 Countries included in Annexes I and II to the Convention 3.2 Individual emission targets for Annex I Parties under the Kyoto
Protocol
5.1 Greenhouse gases in the Kyoto Protocol
5.2 Emissions and commitments in the Kyoto Protocol 5.3 The internal distribution of the EU ‘bubble’
5.4 International carbon prices from economic models of the Kyoto system
5.5 Emissions from Economies in Transition: base year and recent trends
5.6 ‘Top-down’ estimates of the size of the CDM
5.7 International revenue flow constraints on carbon prices 5.8 Supply–demand balance in Kyoto system
6.1 Taxes in OECD member countries levied on electricity consumption
6.2 Existing and emerging domestic trading regimes 7.1 Climate change impacts by income group 7.2 Aggregate social cost of global warming 7.3 The marginal cost of CO2and N2O emissions
8.1 Carbon taxes needed in 2010 to achieve Kyoto targets 9.1 Estimated fossil fuel subsidies 1990–1991 and 1995–1996 9.2 Estimated fossil fuel subsidies in 1991
9.3 Estimated fossil fuel subsidies 1997 and effect of their removal 10.1 Overview of CDM transaction cost estimates
11.1 Emissions of carbon by region
11.3 Energy modelling forum main results: marginal abatement costs 12.1 Cost of traditional and renewable energy technologies: current
and expected trends 12.2 Damages of air pollutants
12.3 CO2emissions from different electricity generation technologies
12.4 External costs for electricity production in the EU
12.5 Projected base case societal life cycle costs for automobiles with alternative fuel/engine options
Boxes
5.1 Economic and crediting aspects of the Kyoto protocol’s project mechanisms
5.2 Elements of policies and measures in the Kyoto Protocol 5.3 Differentiation among the Kyoto project mechanisms
6.1 Saving costs through negotiated standards: the Chorzów project 6.2 ‘The assigned amount’
Acknowledgements
The editors would like to thank Kevin Brennan who proofread the entire manu-script from a student’s perspective and made many useful suggestions.
Contributors
Joanna Depledge is Sutasoma Research Fellow at Lucy Cavendish College, Cambridge University. She holds a PhD from University College London, in which she researched the climate change negotiation process, along with a Masters in Development Studies from the London School of Economics. Joanna is a former staff member of the UNFCCC Secretariat, where she was closely involved in the negotiations on the Kyoto Protocol and subsequent decisions.
Jane Ellis is a policy analyst in the Environment Directorate of the Organisation for Economic Co-operation and Development (Paris). The focus of her work since 1998 has been on the Kyoto Protocol’s project-based mechanisms, in particular on establishing ground rules for project baselines and monitoring, and on developing standardized baseline methodologies in different sectors. Her previous experience at the International Energy Agency focused on policy linkages between energy and climate change, in particular on renewable energy and on emissions inventory issues. She is a member of the CDM Exec-utive Board’s advisory panel on methodologies (‘Methodology Panel’).
Brian S. Fisher was first appointed ABARE’s Executive Director in 1988. He was appointed to the chair in Agricultural Economics at the University of Sydney in 1985, and became Adjunct Professor of Sustainable Resources Development in 2003. He has published over 220 papers and monographs, and has been involved in climate change research since the early 1990s. Dr Fisher was one of the experts appointed to the IPCC Second and Third Assess-ment Reports, and is currently engaged in scoping work for the Fourth Report. He has played an integral role in international climate change negotia-tions as economic adviser to Australia’s negotiating team. Dr Fisher was awarded the Public Service Medal in 2002 for ‘outstanding public service in the field of agricultural and resources policy development’.
of Applied Economics, Cambridge University. He is also Associate Director of Policy at the UK Carbon Trust. Formerly Head of the Energy and Environ-mental Programme at the Royal Institute of International Affairs, he is author of seven books and numerous research publications on international and domestic energy and environmental problems. He has been a lead author for several reports of the Intergovernmental Panel on Climate Change addressing the economic, technological and social aspects of limiting greenhouse gas emissions and has advised a number of governments, companies and inter-national studies on climate change policy. He is editor-in-chief of the journal Climate Policyand is on the editorial board of Energy Policy.
Kirsten Halsnaesis an international expert on the economics of climate change and sustainable development implications of climate change policies. She has played a leading role in several international projects on economics perspec-tives of climate change policies in developing countries and has authored several key international publications on the economics of climate change mit-igation, Kyoto flexibility mechanisms, as well as more general development perspectives of climate change policies. A major work is a recent book, Climate Change and Sustainable Development – Prospects for Developing Countries, co-authored with Anil Markandya. Kirsten has been among the internationally leading economists in the work of the Intergovernmental Panel on Climate Change, IPCC.
Nick Hanley is Professor of Environmental Economics at the University of Glasgow. He was previously Professor of Natural Resource Economics at Edinburgh University, and Reader at the University of Stirling. His main areas of research are environmental valuation, cost-benefit analysis, the economics of sustainable development, and the economics of non-point pollution control.
Jochen Hauff holds a Diploma in Economics from Tübingen University, Germany, as well as a MSc in Environmental Science and Policy from the Central European University in Budapest. His academic work is in the area of environmental economics and transformation processes in Central and Eastern Europe. His Master thesis focused on the applicability of a domestic emissions trading system to Poland in 1999. Since 2000, he has been employed as a man-agement consultant at A.T. Kearney, working mostly with clients in the Euro-pean energy sector. In this capacity he is actively involved in the discussion on how companies may prepare themselves for the challenges of the European Union’s emissions trading system.
schemes and general equilibrium modelling of the impacts of policies to combat climate change. He has been a contributing author to the Second and Third Assessment Reports of the IPCC. He has published over 60 papers and research monographs. He holds a bachelor of economics (honours) from the University of Sydney and a master of science from Cambridge University.
Anil Markandya is Professor of Quantitative Economics at the University of Bath and Lead Economist at the World Bank. He has written widely in the field of environmental economics, including a number of contributions on the issue of climate change. He is co-author of Climate Change and Sustainable Devel-opment (Earthscan) and was coordinating lead author of the IPCC’s Climate Change 2001: Mitigation.
Warwick J. McKibbinis Professor of International Economics and Director of the Centre for Applied Macroeconomic Analysis at the Australian National University. He is also a Professorial Fellow at the Lowy Institute for International Policy, a non-resident Senior Fellow at the Brookings Insti-tution in Washington D.C., and a Board member of the Reserve Bank of Australia. Professor McKibbin has been a visiting scholar or consultant for many international agencies and governments on issues of macroeconomic policy, international trade and finance and greenhouse policy issues. He is a Fellow of the Australian Academy of Social Sciences. He has published widely and is internationally renowned for his contribution to multi-country economic modelling through his development of the MSG multi-country model and the G-Cubed series of multi-country models, which are used in many countries by policy makers, corporations, financial institutions and academics.
Fanny Missfeldt-Ringius is Energy Economist at the World Bank. Before joining the World Bank she worked for the United Nations Environment Pro-gramme (UNEP) Centre on Energy and Environment, Denmark, and the Royal Institute for International Affairs, England. She has also been a consul-tant to the United Nations Framework Convention on Climate Change (UNFCCC) Secretariat. Her PhD from the University of Stirling, Scotland, is in environmental economics. Her academic work has considered game theory approaches to addressing the global commons, greenhouse gas emissions trading, and renewable energy sources.
Anthony (Tony) D. Owen is Associate Professor in the School of Economics at the University of New South Wales (UNSW), Director of the UNSW Energy Research Development and Information Centre (ERDIC) and Joint-Director of the UNSW Centre for Energy and Environmental Markets (CEEM). He has a PhD in Econometrics from the University of Kent (UK) and has held visiting appointments at the Universities of British Columbia, Colorado, Exeter and Leeds, the International Energy Agency, the Organi-zation for Economic Cooperation and Development, and the UK Department of Energy. Tony is a Fellow of the Royal Statistical Society and President (2004) of the International Association for Energy Economics. He serves on the International Editorial Boards of Energy Policyand Energy Economics.
Jason Shogren is the Stroock Distinguished Professor of Natural Resource Conservation and Management, and Professor of Economics at the University of Wyoming. His research focuses on the behavioural underpinnings of private choice and public policy, especially for environmental and natural resources. Before returning to his alma mater, he taught at Iowa State and Yale. In 1997, he served as the senior economist for environmental and natural resource policy on the Council of Economic Advisers in the White House during the run up to Kyoto. Currently, he serves on Wyoming’s Environmental Quality Council, and Western Governors’ Association’s Enlibra advisory board.
Dugald Tinchis a researcher in the Economics Department at the University of Glasgow, working with Nick Hanley on a two-year project on the impact of climate change in Scotland. He gained his masters degree in environmental economics from the University of York, having studied economics at Strath-clyde University previously. His research interests include environmental valuation, energy economics and biodiversity.
Abbreviations
AAU Assigned Amount Units
AEEI Autonomous Energy Efficiency Improvement AGCM Atmospheric General Circulation Model AIJ Activities Implemented Jointly
AOGCM Atmospheric Ocean General Circulation Model AOSIS Alliance of Small Island States
A/R Afforestation/Reforestation BAU Business As Usual
BP Before (the) Present
C (degrees) Celsius
CBA Cost-Benefit Analysis
CDM Clean Development Mechanism
CEEC Central and Eastern European Countries CER Certified Emission Reduction
CFCs Chlorofluorocarbons
CGE Computable General Equilibrium (model)
CH4 Methane
CIS Commonwealth of the Independent States CO2 Carbon Dioxide
CO2e Carbon Dioxide equivalent
COP Conference of the Parties (of the UNFCCC)
EC European Commission
ECU European Currency Unit
EE Eastern Europe
EITs Economies in Transition
EMIC Environmental Model of Intermediate Complexity EPRI Electric Power Research Institute
ERU Emission Reduction Unit
ERUPT Emission Reduction Unit Procurement Tender
FSU Former Soviet Union
g grammes
GDF Geophysical Data Facility GDP Gross Domestic Product GEF Global Environment Facility
GERT Greenhouse Gas Emissions Reduction Trading Program
GHG Greenhouse Gases
GIS Green Investment Scheme
GISS Goddard Institute for Space Studies
GJ Gigajoules
GWP Global Warming Potential HCFC Hydro-Chloro-Fluoro-Carbon
HFC Hydro-Fluoro-Carbon
ICAO International Civil Aviation Organization
ICLEI International Council for Local Environmental Initiatives ICCEPT Imperial College Centre for Energy Policy and Technology IEA International Energy Agency
IETA International Emissions Trading Association IMAGE Integrated Model to Assess the Greenhouse Effect IPCC Intergovernmental Panel on Climate Change
IR Infrared
IVMVP International Performance Measurement and Verification Protocol JI Joint Implementation
K (degrees) Kelvin
kW Kilowatt
kWh Kilowatt hour
LCA Life Cycle Analysis LDCs Least Developed Countries LEC Levelized Electricity Cost
MIT Massachusetts Institute of Technology
MITI Ministry of International Trade and Industry (Japan) MOP Meeting of Parties
MSB Marginal Social Benefit MSC Marginal Social Cost
MSG McKibbin-Sachs Global (model) MSU Microwave Sounding Unit
Mt Million tonnes
MtC Million tonnes of Carbon
MtCO2(e) Million tonnes (of) Carbon Dioxide equivalent
MW Megawatt
NGGIP National Greenhouse Gas Inventories Programme NGO Non-Governmental Organization
N2O Nitrous Oxide NOX Nitrogen Oxides NPV Net Present Value
ODA Official Development Assistance OE Operational Entities
OECD Organisation for Economic Cooperation and Development OGCM Oceanic General Circulation Model
OPEC Organization of Petroleum Exporting Countries OSI Oil Supply Insecurity
PCF Prototype Carbon Fund (of the World Bank) PERT Pilot Emissions Reduction Trading (of Ontario) ppbv Parts per billion by volume
ppmv Parts per million by volume
PV Photovoltaic
PV Present Value
PVLC Present Value of Lifecycle Costs
RAO UES Russian Joint Stock Company ‘United Energy Systems’ RCM Regional Climate Models
RMU Removal Unit
SBI Subsidiary Body for Implementation
SBSTA Subsidiary Body for Scientific and Technological Advice SD Sustainable Development
SO2 Sulphur Dioxide SWF Social Welfare Function
t Tonnes
TJ Terajoule
TWC Three-Way Catalyst
UK United Kingdom
UKMO United Kingdom Meteorological Office
UN United Nations
UNCED United Nations Conference on Environment and Development UNCTAD United Nations Conference on Trade and Development UNEP United Nations Environment Programme
UNFCCC United Nations Framework Convention on Climate Change UNGA United Nations General Assembly
USOSTP United States Office of Science and Technology Policy VER Verified Emission Reduction
VOC Volatile Organic Compound VSL Value of Statistical Life
WMO World Meteorological Organization WRI World Resources Institute
1
Introduction
Anthony D. Owen and Nick Hanley
The impact of climate change is one of the most significant environmental chal-lenges facing the world today. Mitigating this impact will require profound changes in energy production and use, since emission of greenhouse gases from combustion of fossil fuels is the dominant human contribution to climate change. In the short-term, a range of emission reduction strategies is available. For example, both opportunities for enhanced levels of energy efficiency and for fuel switching (from high to low carbon content fuels) are readily available in all sectors of the economy. However, a long-term solution is possible only if techno-logical development receives the appropriate price signals to enable it to proceed in a climate friendly manner.
In the context of environmental economics, three important characteristics make the study of climate change unique:
• it is global in nature;
• its impacts are of an unusually long-term character;
• understanding of both the nature of climate change itself and the effects of policies designed to mitigate it remain deficient.
The global nature of climate change arises from the fact that irrespective of where on earth greenhouse gases are emitted they are rapidly absorbed into the atmo-sphere and spread around the globe. The consequences of the resulting global climate change, however, are projected to be far from uniform, with some coun-tries expected to suffer far greater adverse impacts than others. In addition, uni-lateral action by any one country could not alter this situation significantly. It therefore requires concerted remedial cooperative action at the international level to address the problem.
(for carbon dioxide), through to thousands of years (for longer-lived gases such as perfluorocarbons). Thus, impacts induced by these emissions, such as global average temperature increases and rises in sea level, will be progressive over long time horizons. These long time lags will also influence remedial measures, where the risks of climate change in the future have to be offset against the costs of undertaking mitigating action today.
The ultimate physical impact of climate change has yet to be determined with a realistic degree of precision. Although this is true for other pollutants, uncer-tainty over climate change impacts involves a huge scale and breadth of possi-bilities worldwide. As a consequence, there is uncertainty about the magnitude of damage costs associated with changing weather patterns, changing agricultural patterns and numerous other effects. This makes policy options difficult to deter-mine and encourages decision makers to delay their response until stronger scientific evidence of potential damages becomes available.
In evaluating future emission reduction options economics can play an import-ant role, for example in terms of:
• assessing the cost-effectiveness of alternative measures;
• estimating the impacts on economic growth and sustainable development; • modelling impacts on social equity.
This book aims to provide a sound analytical environment for assessing these issues. It also aims to show how the general principles of environmental eco-nomics can be applied to serious real-world environmental problems.
The structure of this book
In the next chapter, Ian Moffatt provides a concise guide to the science of climate change, with a focus on the construction of climatic data, the causes of climate change and the growth rate of greenhouse gases, and climate change modelling methodology. He concentrates upon climate change over the last two centuries, a period short enough for astronomical and geological processes of climate change to be assumed constant. Thus attention can be focused on the climatic impact of the changing composition of greenhouse gases in the atmosphere over this time-frame. The science underpinning climate change models is illustrated by means of a simple thermodynamic model of the greenhouse effect. More sophisticated models are then discussed, together with the related degree of uncertainty associ-ated with such complex processes. Finally, he examines scenarios exploring pos-sible climate futures, their associated physical impacts, and alternative policy issues and options.
hundred nations in order to develop an international coordination framework for addressing climate change. In Chapter 3, Joanna Depledge explores the evo-lution of the climate change regime over the ensuing 12-year period. After out-lining the history of the regime, she focuses first on the Convention and the further development of its rulebook. The chapter then turns to the Kyoto Pro-tocol, looking at its provisions and rulebook, before offering some remarks on the road ahead.
In the following chapter, Jason Shogren discusses what insights economics can offer policy makers in the debate over rational climate protection policy. These include identification of market failure, the costs and benefits of pursuing action (or inaction) for climate protection, risk reduction strategies and the creation of economic incentives that will assign a price to climate protection. However, the fundamental longer-term economic insight identified by Shogren is the evaluation of risk and associated hedges against uncertainty at local, national and global levels.
In Chapter 5, Michael Grubb gives an overview of the economics of the Kyoto Protocol. The intention of the agreement is to tackle the threat of climate change by establishing an efficient regulatory framework that sets an international ‘price’ on emissions of CO2 and other greenhouse gases. The core mechanism for achieving this is quantified emission commitments, that are given market-based flexibility through the use of emissions trading and other international economic instruments, and with negotiations on subsequent period commitments mandated to follow. Grubb provides an explanation of the basic structure of the Protocol, illustrated with respect to some of the key debates that went into its formation. He then examines the practical economic consequences of the final agreement as elaborated at the Marrakech COP 7 conference, including the economic con-sequences of withdrawal by the Bush administration. He concludes with some thoughts on the future of the Kyoto system.
Carbon taxes and emissions trading are both policy instruments that in a competitive and transparent market setting are capable of bringing about desired levels of greenhouse gas emissions reductions at the lowest cost. In Chapter 6 Fanny Missfeldt and Jochen Hauff show that both instruments can reach a given emission target at minimum cost in the context of a perfectly competitive, fully transparent and static market. However, when discussing the actual introduction of tradable permits as a policy tool, it is essential to analyse their properties under more realistic assumptions. Issues examined in this chapter include uncertainty, market power, and transaction costs which all make the case for the cost-effectiveness of a tradable permit approach less clear-cut. The authors then address the issue of carbon taxes, at both the international and domestic levels, and highlight the constraints that have restricted their implementation to date.
analysis, attempts have been made to incorporate the environmental impacts of projects and policies. Many technical problems persist, however, in applying CBA to environmental issues. In Chapter 7, Nick Hanley and Dugald Tinch address some major problems in applying the CBA method to decisions over climate change, and question the appropriateness of CBA in this instance as a way of informed social decision-making. They point out that the costs of a policy must be lower than the perceived benefits for it to be adopted and non-adoption indic-ates that the costs are thought to be higher than the benefits. It therefore seems rational to suggest that decision makers should be informed by some quantifiable measure of the size of costs and benefits, rather than relying on implicit notions of what these costs and benefits are.
In the following chapter, Warwick McKibbin and Peter Wilcoxen outline the role that economic models have played in the climate change debate. They argue that economic models can play a very useful role but need to be used carefully to form the core of a structured debate rather than the source of definitive answers. Models are particularly useful for analysing the myriad of issues arising in the debate on greenhouse policies because it is impossible to solve the many interde-pendencies without using a framework that captures these interdeinterde-pendencies transparently. The ultimate usefulness of an economic model is not so much in the numerical magnitudes it produces (although these are very useful in placing debates in context) but in improving our understanding of the key underlying mechanisms that determine any set of numbers. As an illustration of how models are structured and used, they present an outline of the G-Cubed multi-country model and summarize the key insights from this model and others in the climate change debate to date. These insights include issues about baseline projections as well as the evaluation of the costs and benefits of alternative greenhouse policies.
Policies that target energy prices (either directly through taxes/subsidies or indirectly through emission caps) are likely to play an important role in any effort to combat global climate change. Although there has been considerable research effort into the impacts of possible energy pricing policies, there remains a number of unresolved issues and a need for continuing research. In Chapter 9, Brian Fisher and Mike Hinchy summarize the long standing disagreement between proponents of bottom up and top down models over the appropriate-ness of assumptions and plausibility of results from respective types of these models. In the specific case of the removal of fossil fuel subsidies, the main uncer-tainty is the size of the second-order repercussions of such a move. It is possible that the reduction in global carbon dioxide emissions could be smaller than sug-gested by the analysis of first-order impacts.
reductions they generate are ‘additional’ to any that would occur in the absence of the certified project activity. Further, the emission baselines against which a project performance is compared need to be environmentally sound, and project monitoring needs to be rigorous. In Chapter 10, Jane Ellis examines issues related to assessing a project’s additionality, setting baselines, and monitoring and verifying the emission mitigation effect of projects. She also suggests means to achieve the appropriate balance between environmental integrity and practical feasibility.
Historically, developing countries have been relatively minor sources of GHG emissions and, with just a few exceptions, are likely to remain so for the foresee-able future. Yet they are likely to suffer disproportionately more than developed countries as the impacts of climate change are realized. In Chapter 11, Anil Markandya and Kirsten Halsnaes look at the present and projected share of GHG emissions of developing countries, what different GHG emission allocation rules would mean in economic terms, and evidence on the possible impacts of climate change on developing, in contrast to developed, countries. They then discuss how climate policies are determined, the role of self-interest in the negotiations, and how developing countries have been included in the agreements. Finally, they review mechanisms that have been created specifically to assist developing countries adopt low carbon technologies, whilst simultaneously providing low-cost abatement credits for developed nations.
In the final chapter, Tony Owen reviews life cycle analyses of alternative energy technologies in terms of both their private and societal (that is, inclusive of externalities and net of taxes and subsidies) costs. The economic viability of renewable energy technologies is shown to be heavily dependent upon the removal of market distortions. In other words, the removal of subsidies to fossil fuel based technologies and the appropriate pricing of these fuels to reflect the environmental damage (local, regional and global) created by their combustion are essential policy strategies for stimulating the development of renewable energy technologies in both the stationary power and transportation sectors. However, a number of non-quantifiable policy objectives are also of significance in the planning of future technology options. Currently, the most important of these would appear to be security of oil supplies and their associated transporta-tion and distributransporta-tion systems.
2
Global warming
Scientific modelling and its
relationship to the economic
dimensions of policy
Ian Moffatt
Introduction
Global warming is considered by many scientists to be the major environmental problem confronting life on Earth.1Whilst it is well established that the Earth has a natural greenhouse effect concern is over the anthropogenic alteration to the composition and quantities of atmospheric greenhouse gases. The anthropogenic alteration of the climate is known as the enhanced greenhouse effect or, more commonly, global warming. In order to understand the processes underpinning global warming a massive scientific programme of research has been undertaken over the past three decades. Several major monographs on the scientific and social responses to global warming have already been produced and vitally important scientific research continues.2
Simultaneous to this research, the last two decades have witnessed increasing political and economic discussions over the ways of reducing greenhouse gases or, at least, exploring ways of adapting to the predicted climatic changes. The Kyoto Protocol, for example, is part of this on-going political and economic debate.3Clearly, global warming has the potential of impacting directly or indi-rectly on every sentient being on Earth. Hence, many political leaders, together with the rest of humanity, are concerned over the likely impacts that global warming will have on society and the environment as well as the costs and bene-fits of coping with this human made threat. The scientific and policy debates continue.
The purpose of this chapter is to focus on scientific modelling of global warming and discuss its relationship with the economic dimensions of policy. In this chapter our attention is focused mainly on climate change over the past 200 years (i.e. short-term change) and we examine some probable changes caused by human activities that will occur by 2050 or 2100.
scales over which they operate are described. This then leads into a brief account of the growth rates of greenhouse gases that represent the basis for one theory of short-term climate change.
We then focus upon the ways in which scientists can model climate change. The basic thermodynamics of climate change are described as a simple one-dimensional dynamic model. Such models were developed in the 1960s but, whilst the thermodynamics are captured in these models, other details of the ter-restrial and oceanic environment were not. More recent atmospheric general cir-culation models (AGCMs) have been developed as a way of representing our knowledge of the processes underpinning global warming. These models also contain some uncertainties and these are described. Despite these uncertainties these sophisticated dynamic models give reasonable simulations of past climatic change over the last 100 years. Generally, these models are then run forward to give alternative scenarios of possible future climate change. It will be argued that until the 1990s the early AGCMs were able to capture the temporal variation in global climatic change but were unable to capture the detailed regional variations associated with global climatic change. Current research, however, has developed models that give more detailed regional descriptions of atmospheric pressure, precipitation and temperature.4 These new regional models can provide useful information for politicians, economists and environmental man-agers (along with other interested people) and are important tools for assessing local and regional effects of global warming. Some of the recent research into models of greater complexity is also noted.
The final section of this chapter examines the relationship between scientific research and policies on global warming. Several scenarios generated by AGCMs giving some possible future changes in the Earth’s climate are presented. These scenarios are not scientific predictions (the latter depend on natural laws and con-trolled experimental conditions) nor are these scenarios mere weather forecasts. AGCMs’ scenarios are exploring possible climate futures and as we move further into the future the uncertainties grow and hence the forecasts become less reliable. Using a series of different, but realistic, scenarios, alternative types of policies and economic instruments are briefly considered. This then leads into a brief discus-sion on the relationship between scientific activity and the on-going political-economic debate on the policies to be used to counteract global warming.
The science of global warming – a concise guide
purpose of this section is to provide a concise guide to some of the major prob-lems in describing and explaining climate change.
Climate is a statistical average of meteorological data
At the outset it should be realized that climate is simply a statistical concept based on the averaging of meteorological phenomena (such as solar radiation, precipita-tion, temperature and atmospheric pressure) over a 35-year period. Obviously, a long consistent record of meteorological data is required for climatic statistics to be calculated. It should be noted that the land based meteorological records tend to be less reliable the older the record. This is, in part, due to different means of measuring the meteorological data. Reliable records for instrumented observa-tions also vary spatially. We have, for example, very little cover of meteorologi-cal conditions at sea or over lakes which together cover approximately 70 per cent of the Earth’s surface.
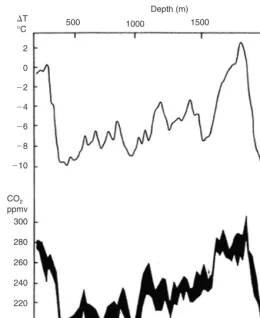
If we want to reconstruct past climates than we need to use non-instrumented measures of climate change. These methods include the use of tree rings and sea level rises as well as the more reliable measurement of methane and carbon dioxide trapped in air taken from ice cores in Antarctica.5 Using non-instrumented data we can get an idea of the way in which climate has changed over the last 160,000 years in the Quaternary period (Figure 2.1). The research indicates that the Earth’s mean surface temperature was closely related to the concentration of carbon dioxide and methane in the atmosphere.6
Using a mixture of instrumented and secondary data it is possible to illustrate the changing climate. The changing climate as measured by mean surface temper-ature for the Northern and Southern hemispheres as well as for the global mean surface temperature for about 200 years has been calculated (Jones 1985a and b). It will be observed (Figure 2.2) that there has been a ‘real warming of the globe of 0.3 degrees C to 0.6 degrees C over the period 1861–1989’. The pattern of climate change has differed in both timing and across geographical space. With regard to timing of global warming much of the warming has occurred in two periods – 1920–1940 and then 1980–2000. In particular the last decade of the twentieth century had the warmest years of the entire century.
Geographical variations in the pattern of warming are important. The North-ern hemisphere cooled between 1940s and the early 1970s whilst SouthNorth-ern hemi-sphere temperatures stayed nearly constant. As will be shown later, regional patterns of climate change are likely to differ considerably from the global average.7 The investigation into the regional patterns of climate change is an important aspect of current climatic research. These regional forecasts are very important for environmental managers as well as for local policy decision making.
captur-ing of geographical distributions of precipitation and surface temperature. Often the data is recorded at local scales and has to be upscaled to represent regional and global variation in the climate. When satellite and other remote sensing data are used then the problems of downscaling are also involved. Current research is attempting to develop even more robust methods to ensure that there is reason-able empirical validation for regional and local models based on global simula-tions and for validating global and regional models based on locally collected data.8
Despite the methodological problems concerned with data collection and scaling, by 1991 the scientific community could write with confidence: ‘There is a natural greenhouse effect which already keeps the Earth warmer than it would be otherwise be’ and, further:
Figure 2.1 CO2concentrations (bottom) and estimated temperature changes (top) during
that emissions resulting from human activities are substantially increasing the atmospheric concentrations of greenhouse gases: carbon dioxide, methane, chloroflurocarbons (CFCs) and nitrous oxide. These increases will enhance the greenhouse effect, resulting on average in additional warming of the Earth’s surface temperature.9
By 1996 attempts to quantify the human influence on global climate had been made (compared to 1990) and it was noted that ‘the balance of evidence suggests that there is a discernible human influence on global climate’.10 The enhanced greenhouse effect or global warming is now accepted by the vast majority of the scientific community as a matter of fact rather than as a hypothetical conjecture.
Causality of climate change: temporal and spatial scales
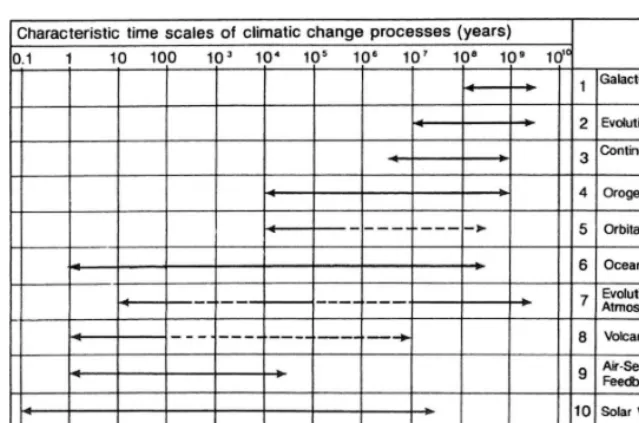
The nature and causes of climate change operate at different temporal and spatial scales.11Over the last 4.5 billion years the Earth’s history has witnessed changes in the energy flowing from the sun.12Alterations in the orbit of the Earth around the sun have also had an impact on the Earth’s climate.13 Similarly, the forma-tion, distribution and movement of the Earth’s plates (including the continents) alter both the oceanic currents and mountain chains. The changing composition of the atmosphere has also contributed to the earth’s changing climate. Clearly, there are many processes involved in explaining the climate change. These differ-ent processes operate at differdiffer-ent temporal and spatial scales, and often occur simultaneously, which makes any modelling effort extremely difficult – even if we could obtain reliable and detailed records. Wigley (1981), for example, has Figure 2.2 Global mean combined land–air and sea-surface temperatures, 1861–1989,
shown some of the characteristic time scales of climate change processes in years (Figure 2.3).
The climatic changes associated with the Quaternary and Holocene periods have been the subject of intensive palaeoclimate reconstruction and modelling.14 The data for such palaeoclimatic reconstruction includes inferences made from archaeological records, varve clays, tree-rings, lichenometry and lake sediments as well as radiocarbon and thermoluminescence dating techniques. Overall reli-ability of using different types of data to record climatic change is often improved by use of several techniques together (Roberts 1989). By piecing together the rel-evant data sets and exploring extreme climatic conditions such as those experi-enced 21,000 years BP and 6,000 years BP an opportunity to evaluate how models of climate change respond to large climatic forcings has been simulated.15 These simulations of past extreme climatic conditions are useful for evaluating how models of climate respond to large forcings, and ultimately provide a key credibility test for modelling future changes to the Earth’s climate.16
fossil fuels. This set of activities is causing concern amongst scientists and policy makers as they are definitely damaging the life chances of many other living species17 and may lead to our own extinction18 or, at least, impose significant costs on humans.
The remainder of this chapter will focus upon climate change over the last 200 years and will also examine the ways in which scientific modelling inter-relates with the economic dimensions of policy-making. At this scale of resolution (i.e. short-term) the astronomical and geological processes of climate change can be assumed constant and attention can be focused on short-term changes associated with the changing composition of greenhouse gases in the atmosphere.
Greenhouse gases
The greenhouse effect is a natural phenomenon that has been operating for mil-lions of years and without it the Earth would be too cold to support life as we know it. It is well established in both theory and measurement that the green-house gases (carbon dioxide, methane, nitrous oxide and chloroflurocarbons (CFCs)) in the atmosphere keep the Earth’s mean surface temperature at an average of 15 degrees C. Without the greenhouse effect, the mean surface tem-perature would be ⫺18 degrees C. The mean surface temperatures of Venus, Mars and Earth (477, ⫺47 and 15 degrees C respectively) are in agreement with those calculated on the basis of the greenhouse theory of climate change. The current concern over anthropogenic changes to the greenhouse gases in the Earth’s atmosphere has resulted in a long debate over the human activities and their influence on global warming which are added to the natural phenomenon of the greenhouse effect. This sub-section briefly describes the theory and evidence for the enhanced greenhouse gases which contribute to global warming.
As a cause of climatic change, the greenhouse gas theory has a relatively long lineage.19 In 1827, for example, Fourier20 suggested that the heat could be retained by the atmosphere and described the effect as acting in a manner similar to a hot house (greenhouse). In the 1860s Tyndall21 measured the capacity of water vapour, carbon dioxide and other gases to absorb heat. It was first sug-gested that carbonic acid (carbon dioxide) could influence the thermal properties of the atmosphere by about 4 degrees C in 1896.22Later, in 1938, Callendar23 demonstrated that carbon dioxide could account for a warmer climate. Sub-sequent laboratory experiments, simulations and field observations have corrobo-rated this theory of global warming.24 It should be noted that carbon dioxide is not the only greenhouse gas – water vapour, nitrous oxides, methane and other gases are also greenhouse gases. Each greenhouse gas has a different thermal warming potential.
suite of gases that are called greenhouse gases. The term greenhouse gas implies that the gases are radiatively active. The sun emits most of its energy at wave-lengths between 0.2 to 0.4 micro-, primarily in the ultraviolet, visible and near-infrared wavelengths. As the Earth is much cooler than the Sun it re-emits the energy it absorbs back to space and thereby maintains an energy balance. Much of this emission takes place at wavelengths longer than those for incoming solar radiation, generally from 4 to 100 micro-– these are termed long wave or infra-red radiation. Although water vapour, carbon dioxide and other greenhouse gases are inefficient absorbers of solar radiation, they are strong absorbers of long wave infra-red radiation. These greenhouse gases re-emit the absorbed long wave radiation in all directions as a function of the difference in local air temperature, which tends to be cooler than the Earth’s surface temperature. Obviously, some of this radiation is lost to space, but the remainder is emitted downwards, leading to a net trapping of long-wave radiation and hence a warming of the surface.25 The mixture of greenhouse gases and aerosols (airborne particles) that make up the Earth’s atmosphere is, therefore, central to understanding the short-term cli-matic changes of the Earth.
Whilst the greenhouse effect is a naturally occurring phenomenon it is anthro-pogenic changes to the composition of greenhouse gases that has caused concern in the scientific community, the public and policy makers. In particular the increase of some greenhouse gases from economic activity has caused many to ponder the ways in which we are altering the Earth’s climate. It is possible to measure the increase in the atmospheric concentrations of the more important greenhouse gases. Over the period 1975–1985 the following increases occurred: carbon dioxide (CO2) 4.6 per cent; methane (CH4) 11.05 per cent; nitrous oxide (N2O) 3.5 per cent and man-made chlorofluorocarbons (11 and CFC-12) 103 per cent and 101 per cent respectively.26The main sources of these gases have been identified as energy production (CO2 and CH4); industrial activities (CO2and CFCs); agriculture (CO2, N2O and CH4); and land clearances (CO2 and N2O). The concentrations of greenhouse gases are small, often measured in parts per million (ppmv) or per billion (ppbv) by volume, but the proportion of their warming effect is important (Table 2.1). Clearly, economic activity is adding ‘fuel’ to the natural processes of the greenhouse effect and causing global warming.
metabolism of plants and other organisms in the winter period. As the Northern hemisphere has the most land cover this winter slow down overawes the South-ern hemisphere summer production. The concentration of N2O is more erratic but also shows a growing trend as does the growth in the concentrations of atmospheric CFCs (Figure 2.4).
The possibility of greenhouse gases warming the Earth is both theoretically well founded and empirically demonstrated. Humankind’s activities are altering the natural vegetation cover of the Earth and these agricultural and urbanization activities, coupled with the increasing use of carbon-based fossil fuels, have been responsible for the dramatic rise in atmospheric greenhouse gases. The problem confronting both the scientific community and policy makers is to estimate what are the likely environmental, social and economic consequences of such unprece-dented changes to the atmosphere greenhouse gases in recorded history and devise a suite of policies to address these problems. One way of contributing to these forward-looking activities is to develop models of the global warming process. These models are calibrated and tested with relevant data; the models are then run forward to give a series of scenarios indicating possible climate change in the next 50 to 100 years (i.e. 2050 to 2100).
Table 2.1 1987 greenhouse gas concentrations, trends and degree of forcing relative to CO2
Gas Concentrations Observed trend Projected Existing Proportion of 1987 per year 1990 concentrations radiative total warming
(%) 2050 forcing (%) relative to CO2
CO2 348 ppmv * 0.46 400–600 ppmv 00,1 61.0
CH4 1.68 ppmv * 0.7–1.0 2.1–4 ppmv 00,21 15.0
N2O 0.31 ppmv * 0.2 0.35–0.45 00,206 4.0
ppmv
CFC-11 0.24 ppbv *10.3 0.41 ppbv 12,400 2.0
CCFC-12 0.42 ppbv *10.1 0.85 ppbv 15,800 7.0
CFC-113 38 pptv * 4.2 0.14 pptv 158,800 1.5
HCFC-22 0.10 ppbv * 6.2 0.94 ppbv 10,700 0.4
O3 10–100 ppbv * 0.0–1.0 15–50% — 0.11
Others — — — — 8.2
Figure 2.4 Concentrations of greenhouse gases measured in air at Cape Grim, Tasmania. Source: Moffatt (1992).
Scientific models of the enhanced greenhouse effect
Modelling the Earth’s solar energy balance
The Earth and all its surface ecosystems rely on energy from the sun. Much of this energy for atmospheric motions comes indirectly through radiative, sensible and latent heat transfers from the Earth’s surface. As noted above the mixture of greenhouse gases that makes up the Earth’s atmosphere is, therefore, central to our understanding of short-term climatic change. This solar derived energy drives the biogeochemical cycles such as the carbon, nitrogen and hydrological cycles. Solar energy also provides one of the vital inputs to the photosynthetic process. Without the inputs of solar energy life as we know it would not exist on planet Earth.
There are numerous models of the atmosphere and many of these are still undergoing further research and development. These models range from the very crude one-dimensional energy models of the 1960s through to the more complex three or four dimensional atmospheric general circulation models (AGCMs) cur-rently used in scientific research and policy discussion. This section describes the science underpinning these models by developing a simple, thermodynamically sound model of the greenhouse effect. More sophisticated versions of modelling global warming are described in the following sub-section.
The solar energy flux just above the Earth’s atmosphere is estimated as 1,372 W/m2 – where 1 Watt ⫽ 1 Joule/second. This energy flow varies because of solar activity (sun spots), the Earth’s distance from the sun and other variables. Nevertheless, despite these changes it is convenient to represent this input of energy as the solar constant:
Ws⫽1372..R2 (2.1)
where Wsis the amount of energy per time period delivered from the sun and R is the radius of the Earth.
In 24 hours the energy is distributed over the entire spheroid of the Earth (assumed to be a sphere) with an area of 4..R2. Hence, the average flux of solar energy reaching the Earth is:
1372..R2/4..R2⫽343(W/m2) (2.2)
and this is the solar flux (Ωs). This energy flux covers a large portion of the elec-tromagnetic spectrum.
remaining 69 per cent of the energy is absorbed by the Earths’ atmosphere and is usually re-radiated in the infra-red part of the electromagnetic spectrum.
Under steady-state conditions the Earth is in an energy balance: the amount of incoming solar flux is equal to the amount of energy reflected and re-radiated from the Earth:
Ωs⫽ ␣.Ωs⫹(1⫺␣).Ωs (2.3)
Ωe⫽Ωs⫺␣.Ωs⫽(1⫺␣).Ωs
where Ωe (W/m2) is the energy flux re-radiated from the Earth; Ωs is the incoming solar flux (equation 2.2) 343 W/m2and ␣is the albedo of the Earth (0.31).
Under steady-state conditions we can apply the Stefan-Boltzmann Law of Black-Body radiation. This law states that the energy flux radiation for a black body is a function of the surface temperature of that body raised to the fourth power:
Ω⫽ .T4 (2.4)
where Ω⫽energy flux (W/m2); ⫽Stefan-Boltzmann Constant (5.67⫻10–8 W/m2/K); T ⫽is the temperature in degrees Kelvin (to convert degrees Kelvin (K) to Celsius (C) use the formula K ⫽C ⫹273.15). By combining equations 2.3 and 2.4 the Earth’s average surface temperature is given as:
T ⫽(Ωe/)1/4⫽[(1⫺␣).Ωs/]1/4 (2.5)
By substituting the values of ␣ ⫽0.31 and Ωs⫽343 W/m2then equation 2.4 yields a value of: T ⫽255K (or ⫺18 degrees C).
The average temperature of the Earth would be too cold to support life. For-tunately, the real Earth surface temperature is not so low – it is approximately 33 degrees C higher than the temperature calculated by equation 2.4, or 15 degrees C. The discrepancy between the calculated and actual temperature is due, mainly, but not exclusively, to the presence of greenhouse gases.
aspect of a realistic model of the Earth’s changing climate. The model is, there-fore, a highly simplified view of the greenhouse effect. Nevertheless, the model does indicate very clearly the role of greenhouse gases in increasing the mean surface temperature of the Earth.
The early energy based models were useful analytical devices but do not treat the world as a three or four dimensional (x, y, z and t (time)) entity and there-fore cannot incorporate realistic land surface properties in anything but the crudest of ways. An accurate understanding and reliable prediction of the effect of the greenhouse gases requires consideration of the three dimensional nature of the Earth’s surface together with the known dynamics of the atmospheric and oceanic circulation. A fully developed AGCM would incorporate oceanic atmo-sphere interactions; details of the gaseous transfers between different species of vegetation; details of the albedo effect from dry and wet surfaces (including ice); cloud feedbacks as well as perturbations from volcanic emissions. To describe these missing processes in more detail lead us into a description of the more complex models known as atmospheric general circulation models (AGCMs).
Atmospheric general circulation models
It is not the purpose of this introductory chapter to describe in detail the ways in which AGCMs function. Elementary accounts of the procedures involved can be read in several texts.28Nevertheless, it is important to comprehend some of the problems involved in building AGCMs especially when policy decisions may be based on a misunderstanding of the strengths and weaknesses of the models.
solved for an hourly or half-hourly time-step and the model can be run for a long simulated time (e.g. 400 years) with each set of equations being solved every half an hour for every day for the length of the simulation. The early models ran at a ‘twilight’, with incoming solar radiation flowing at a low intensity every 24 hours. Today, however, the AGCMs can include diurnal and seasonal variation in incoming solar energy which drives the atmospheric system. Clearly, current AGCMs are complex and current research includes further coupling of the atmospheric system with oceanic general circulation models (OGCMs) to produce atmospheric ocean general circulation models (AOGCMs). More advanced research is developing environmental models of intermediate complex-ity (EMICs) as part of scientific understanding of the atmosphere, biosphere, hydrosphere, cryosphere and human interactions.30 Despite their complexity some EMICs do permit the evaluation of greenhouse gas mitigation proposals. The MIT integrated global system model, for example, permits an investigation into the multi-gas assessment of the Kyoto Protocol.31 Similarly, the Integrated Model to Assess the Greenhouse Effect (IMAGE) model is explicitly developed to explore the impact of greenhouse gases and sea-level rising on The Nether-lands.32
It should be stressed that any model is a simplification of real world physical, biological and chemical interactions. It should also be noted that different research groups of AGCM builders stress different interactions in their attempts to simplify, yet understand and predict, climatic changes due to increases in greenhouse gases. The feedback interactions between clouds and the Earth’s surface, for example, can be modelled in different ways. Similarly, the interac-tions of water and vegetation and their effect on the albedo are important feed-backs. Despite the different ways both in which AGCMs are built, the major feedbacks incorporated and the methods used for estimating the numerical values of the parameters, they give broadly similar results with regard to the temporal patterning of climate change.
Many early AGCMs were simply coupled to a single deep ocean, and it was clear that the oceans sequester heat in such a way as to give a new equilibrium temperature at 2 degrees C or an upper equilibrium temperature of 5.4 degrees C by 2030.33Similar results using different AGCMs have indicated that when a fully interactive ocean is incorporated into an atmospheric oceanic general circulation model (AOGCM) then there is significant improvement in modelling global tem-perature changes than observed in the early 1980 models. The incorporation of greenhouse gases and aerosols in AOGCMs has resulted in reasonable simulations of global annual mean warming from 1860–1990 (Figure 2.5).
satellite based Microwave Sounding Unit (MSU). By using an advanced AOGCM initialized with nineteenth century levels of CO2and driven (forced) by changes in both CO2and sulphur emissions it has been shown that ‘there is no serious inconsistency between the most recent model predictions and MSU-based trend estimates’.34It should be noted that the MSU record is less than 20 years old and hence it is difficult to make a strong statement on the significance of any differences in trends on these time scales for climatic purposes.
Whilst the advanced models of climate change are capturing the temporal aspect of global climate change they are less successful in capturing the spatial variations in both temperature and precipitation. An analysis of five early (pre-1990) AGCMs covering Australia was undertaken in 1989. The five different AGCMs predict the pattern of temperature change in Australia for summer and winter under a doubling of CO2 against the existing temperature in the same region. All the models show an increased warming throughout Australia by between 2 and 8 degrees C. When regional patterns are examined, however, there are significant regional differences in the predictions. During the summer season (December/January/February), for example, the GDF, GISS, NCAR and UKMO models’ output all have areas of increased temperature in common – although there are important regional differences. When precipitation is exam-ined all the models predict decreasing rainfall over some parts of Australia despite the fact all global models generally predict an intensification of the global hydro-Figure 2.5 Simulated global annual mean warming from 1860–1990 allowing for increases in greenhouse gases only (dashed curve) and greenhouse gases and sulphate aerosols (solid curve), compared with observed changes over the same period.
logical cycle and a global increase in precipitation.35Again, more recent research has made great improvements in the accuracy of the geographical variations in the predicted precipitation, pressure and temperature regimes at regional levels.36 These regional climate models (RCM) are based on 50 km grid squares and include 19 vertical levels. The Hadley Centre regional climate modelling system, for example, provides high resolution climate change predictions for a region generally consistent with the continental scale changes predicted in the AGCMs.37These regional simulations linked to the UKMO AGCM can be used to give an indication of the regional impact of global warming in small countries such as the UK when compared to the broad scale coverage of the earlier genera-tions of AGCM.38It can be argued that regional climate models are now provid-ing important information on the environmental impacts associated with global warming for use in regional planning – as long as the scenarios to be used in policy-making are cautiously interpreted.39
Scientists recognize that there are many uncertainties associated with the use of AGCMs for making scenarios of global warming. At least 17 broad classes of scientific uncertainties can be identified – 11 concern oceanic interactions and the other six are concerned with terrestrial ecosystem responses to a warmer Earth.40 Some of these problems have been examined and although the magni-tude of their impact is better understood some uncertainties still remain. The ter-restrial uncertainties include the rate of biomass recovery after disturbance; the dynamics of carbon storage in terrestrial ecosystems including the boreal and tundra systems; the burying rate of organic matter in coastal areas and especially estuaries.
winter months despite an overall global warming. The intricacies and uncertain-ties of the atmosphere-oceanic biosphere system (Earth system) are indeed complex and replete with uncertainties. Scientific research to further understand-ing of these feedback loop interactions is continuunderstand-ing.
The fact that uncertainties are identified is not a reason for delaying any policy prescriptions based on an inevitably incomplete knowledge of how complex systems interact. The physical-chemical conditions in the general circulation are reasonable well understood and the evidence of global warming is already observ-able. The longer we delay in making policy decisions then the greater the likeli-hood of global warming and, arguably, additional costs required to ameliorate the impacts of global warming. The recognition of the uncertainties and limitations of any model of global warming should be noted – as they are in the serious scientific literature and are acknowledged by many policy makers. Hence, in the development and use of scientific models, if we are not to mislead the public and its policy makers, eternal vigilance is required.42
Global warming: scenarios, potential impacts, policies
and the economic debate
Scenarios and potential impacts
A scenario is not a scientific prediction based upon laboratory controlled con-ditions but simply a projection of a future state of a system given certain assump-tions about its structure as embedded in a model of that system. As noted earlier there are several AGCMs and these are all in agreement over the fact that addi-tional greenhouse gases, including aerosols (and changes to the Earth’s ecosys-tems) are causing global warming.
In an attempt to explore the possible likely future consequences of global warming several scenarios have been developed using different AGCMs. The IPCC gives four basic scenarios. These are the business as usual (Scenario A) and three variants (Scenarios B, C and D) (Figure 2.6).
noted that the changes in emission scenarios take some time to produce an effect, as a result of the slowness with which both the atmospheric gas concentrations and the oceans respond.43
More recently the IPCC has provided some 40 emission scenarios.44The sce-narios are driven by complex changes in demography, social and economic devel-opment as well as energy technology. Four main ‘story lines’ (A1, A2, B1, B2) are presented as the basis of the forty scenarios. The A1 story line represents a world of rapid economic growth, a global population peaking in the mid twenty-first century then declining afterwards with the rapid introduction of efficient Figure 2.6 Four alternative scenarios of global warming.
energy technologies. Story line B1 is similar to A1 with regard to population change but with the introduction of clean resource efficient technologies and rapid changes towards a service based economy with reductions in material intensity. Story line B1 also suggests global solutions to environmental, economic and social aspects of sustainable development. Story line A2 represents a heterogeneous world with self-reliance and preservation of local identities. Fertility patterns slowly converge and technological and economic change is primarily regional and fragmented. Story line B2 focuses upon local solutions to social, economic and environmental sustainability problems. Local and regional environmental protection and social equity are also included in scenarios generated from this story line. It should be noted that none of the scenarios assumes surprises in the response of socio-economic institutions or environmental systems to global warming. Additionally, it should be mentioned that the scenarios do not include any implementation of the proposed reductions in greenhouse gases as noted in the Kyoto Protocol.
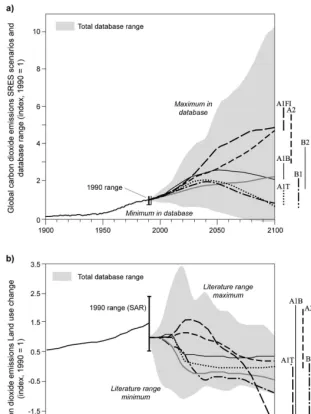
The variations in the global carbon dioxide emissions and land use changes under the 40 scenarios are presented in Figure 2.7. It will be observed that most of the global carbon dioxide emissions are within the IS92 scenarios (A, B, C and D) but the land use changes associated with the new scenarios are well beyond the IS92 range. This raises some important policy issues that will be discussed in the following section.
The potential impacts of global warming under ‘business as usual’ scenarios can have environmental, economic and social consequences. Some of the possible negative and positive impacts can be noted. These include:
• rising sea-levels;
• salinity in water supplies;
• water shortages and, paradoxically, flooding in other areas; • alterations to oceanic currents and fish supplies;
• increased intensity of tropical storms and wind damage to built structures and forests;
• changes to natural vegetation belts and to agricultural production;
• the risk of prolonged droughts in some areas is also possible, including areas where drought was not common e.g. eastern seaboard of UK;
• higher risk of fires in some regions;
• increase in ultra-violet exposure and risks of skin cancer;
• increase in malaria, dengue fever and other medical conditions including heat fatigue;
• more space cooling in some buildings and more heat required in higher lati-tudes and altilati-tudes;
• reduction of skiing in some regions and alterations to patterns of tourism.
have a regional component and that the current regional climate models will be essential for assisting planning to prevent the worst impacts of global warming. It will also be noted that these changes may, in some areas, have positive advantages as well as negative impacts.
Whether we wait for better predictions of global warming and more empirical evidence or begin preventative measures is not the question. Rather we must Figure 2.7 Global CO2emissions related to energy and industry and land use changes.