GREEN PERCEPTION, GREEN VALUE AND GREEN AWARENESS ON GREEN PURCHASE OF TOYOTA AGYA IN SURABAYA
Calvin Halim [email protected]
International Business Networking Faculty of Business and Economics University of Surabaya
Christina Rahardja Honantha
[email protected], [email protected] Faculty of Business and Economics University of Surabaya
Liliana Inggrit Wijaya [email protected]
Faculty of Business and Economics University of Surabaya
Abstract
Nowadays one of the key factors of developing tourism is to increase new business practices without disrupting the conservation of environment. This paper focuses on the consumer perception and preferences towards green marketing practices and product. This research is examined to identify and analyze the effect of green perception, green value, and green awareness on green purchase of Toyota Agya in Surabaya.
Type of this research is a quantitative research, and causal research. The data was analyzed by Multiple Linear Regression with SPSS 21.0 for windows. Sample characteristics which consumer who ever bought Toyota Agya in Surabaya for the past one year. The primary data is obtained from the questionnaires which was distributed to 135 respondents.
The result indicated that green perception, green value, and green awareness have a significant influence on green purchase of Toyota Agya in Surabaya.
Keywords: green perception, green value, green awareness, green purchase
Intisari
Perkembangan turisme akhir-akhir ini memperhatikan praktik-praktik dan peluang bisnis tanpa mengorbankan kelestarian lingkungan. Penelitian ini fokus pada persepi dan preferensi konsumen akan praktik pemasaran dan produk ramah lingkungan. Penelitian ini dilakukan untuk mengetahui pengaruh persepsi ramah lingkungan, nilai ramah lingkungan dan kesadaran ramah lingkungan terhadap pembelian produk ramah lingkungan merek otomotif yaitu Toyota Agya di Surabaya.
satu tahun terakhir. Data adalah data primer yang diperoleh dari kuesioner yang dibagikan kepada 135 responden.
Hasil penelitian ini menunjukkan bahwa aspek aspek persepsi ramah lingkungan, nilai ramah lingkungan dan kesadaran ramah lingkungan memiliki pengaruh yang signifikan terhadap pembelian produk ramah lingkungan Toyota Agya.
Kata kunci : persepsi ramah lingkungan, nilai ramah lingkungan dan kesadaran ramah lingkungan, pembelian produk ramah lingkungan
INTRODUCTION
Over the last three decades there has been increasing global concern over
the Environmental Pollution. Pollution occurs because the natural environment
does not know how to decompose the unnaturally generated elements on the other
hand; there is a lack of knowledge on the part of humans on how to decompose
these pollutants. (Irina Gray, 2008) Although pollution had been known to exist
for a very long time, it had seen the growth of the global proportions in the
beginning of Industrial revolution during 19th century. The industrial revolution
brought technological process such as discovery of oil and it is worldly used
throughout different industries. Technological process become one of the main
causes of serious deterioration of natural resources.
It is interesting that natural resources had been stored virtually untouched
in the Earth for millions of years. Vast amounts of these resources had been
exploited within a period of just a couple of hundred of years at unimaginable
rates, with all the waste from this exploitation going straight in to the environment
(air, water, land) and seriously damaging its natural processes. (Irina Gray, 2008)
At the same time, development of the natural resources led to the better
understanding of negative effects produced by pollution on the environment.
Environmental pollution is a problem both in developed and developing countries.
Factors such as population growth and urbanization demands the use of the
natural resources to the maximum (Irina Gray, 2008)
Some 100 physicals and 450 biological processes have been documented
by the Scientist as an effect of the climate changes. (1) Rainfall patterns will
East Asia will receive more precipitation. (3) Global warming will accelerate
hydrological cycle. Warmer air causes more water to evaporate. (4) Greater stress
on freshwater supplies around the world especially regions that receive
considerably less rain like Africa and South East Asia. (5) Sea level rise as the
quality of the water will be affected. (6) Wildlife and ecosystems will face
additional stress (7) New environmental conditions could affect food security (8)
Changes will harm human health (9) Settlements and infrastructures will need to
adapt (10) Extreme weather events will boost cost and will have a direct impact
to the world economy (Klaus Topfer, 2001)
Global warming also threatening island worldwide. Indonesia is the
world’s largest archipelago; it is already a significant emitter to greenhouse gases
due to deforestation, estimated at 2 million hectares per year and accounts for 85
per cent of the country’s annual greenhouse gas emissions. It is also a serious coal
producer and user in the region. The government of Indonesia knows how
important action against climate change due to the Global Warming is. No one
can escape from climate change in Indonesia. But the effects will be felt by the
poorest people, who are living in the most marginal areas that can easily hit by
flood or landside. (World Wildlife Fund 2007, retrieved December 3).
As the Global warming that cause climate changes is increasing every
time, people’s tend to shift their products to the eco-friendly products that produce
no harm to the planets. This paper need to investigate more of the customer
perception and preferences choose the Low Cost Green Car brands in Indonesia.
A survey conducted by Ipsos Business Consulting stated that the demand for Low
Cost Green Car has significant increase. However a Studied conducted by
Braimah and Tweneboah-Koduah (2011) found low level of awareness-towards
green marketing issues which affected that purchase decision of the consumers.
Toyota is the first company before Honda that mass produced hybrid
vehicle. It was Toyota Prius that launched in Japan back in the 1999. Toyota's
hybrid vehicles use only the electric motors, powered by the battery, while the
gas/petrol engine remains shut off. Although Toyota has mass produced hybrid
high price and it has high maintenance cost which is not suitable to Indonesian
market.
Toyota achieves the Best Global Green Brands in 2012, overcome Honda
on the third place. Toyota creates the environmental friendly strategy on all of
their stages, from operational, products, an advertising campaign as well as the
community. Toyota creating vehicles that are safe, practical and fun to drive
while at the same time ensuring customer cars and trucks are at the forefront of
environmental engineering. Toyota also limits the amount of energy and water
that they used to their operations process.
LITERATURE REVIEW AND RESEARCH HYPHOTESES Green Marketing
Michael Polonsky (1994) defined “green marketing as the marketing that
consists of all activities designed to generate and facilitate any exchanges
intended to satisfy human needs or wants, such that the satisfaction of these needs
and wants occurs, with minimal detrimental impact on the natural environment.”
Mintel (1995) found a significant gap between consumers concern and actual
green purchasing. It is found that still there are considerable barriers towards the
diffusion of more ecologically oriented consumption styles.
Antonio et al. (2009) suggested that due to environmental consciousness
that has evolved over time, studies on green consumerism will be the main focus
point in future leading to identifying the consumer attitudes, behaviors and
intentions. Braimah and Tweneboah-Koduah (2011) studied Ghanaian consumers
and have found low level of awareness towards green marketing issues which
affected that purchase decision of the consumers.
Enviromental friendly has been perceived as an opportunity by the
organizations to achieve their objectives (Keller, 1987; Shearer, 1990 in Mayank
& Amit, 2013). It was believed that organizations have moral obligation to serve
the society in more environmental friendly way (Davis 1992; Freeman; Liedtka,
1991; Keller, 1987; Shearer, 1990 in Mayank & Amit, 2013).
Consumers and manufacturers have directed their attention toward
environment friendly products that are presumed to be “green” or environment
friendly like low power consuming (energy-efficient) electrical appliances,
organic foods, lead free paints, recyclable paper, and phosphate free detergents
(Mayank & Amit,2013). While choosing enviromental friendly products,
customer tend to choose a product based on their perception about the products. It
wouldn’t be a surprised if each customer will select different products because
customer experience and perception towards the products.
Green purchase can be measured (Mayank & Amit, 2013) : (1) I consider
the ill effects of manufacturing and consumption on the natural environment; (2) I
prefer green products over conventional products; (3) I feel that green products
are priced higher as compared to conventional product; (4) I feel that price of
green product affects my purchase behavior.
Green Value
Green value refers to the preferences of customer to choose a products. It
has been always believed that the actions of individuals can be predicted by
attitudes. Consumer’s attitude is associated with the knowledge and personal
experience they possess ( Davidson, 1985 in Mayank and Amit, 2013). Green
consumer value can be measured (Mayank & Amit, 2013) : (1) It is important
that the products I use do not harm the environment; (2) I am concerned about
wasting the resources of our planet; (3) I would describe myself as
environmentally responsible.; (4) I consider the potential environmental impact of
my actions when making many of my decisions; (5) I am willing to be
inconvenienced in order to take actions that are more environmentally friendly;
(6) My purchase habits are affected by my concern for our environment.
Green Awareness
Awareness has hopeful association between consumer’s intention of
getting hold of the product and its familiarity (Rashid,2009). Means, that customer
know the functions as well as the purpose also details of each products that they
people. Green awareness can be measured (Mayank & Amit, 2013) :(1) I can buy
green products from time to time but I am not involved in any environmental
activities; (2) I do not buy green products. I believe that business and government
should be fixing environmental problems; (3) I am the least involved in
environmentalism. I believe that there is not much that an individual can do in
solving environmental problems. It should be the government and business which
should promote the environment.
Green Perception
Green perception is the act of understanding, or interpreting green
marketing concept. Each of customer will have a different view of it and
Additional benefit as it explained above will bring positive point of view towards
green marketing practices. Green perception can be measured (Mayank & Amit,
2013): (1) I buy only green products. I spend time and effort in environmental
activities such as recycling. I believe that an individual can do much to promote
the environment; (2) I am able to buy green products but I don’t have the time and
energy for environmental activities. I do not want to change my lifestyles to
promote the environment; (3) I can buy green products from time to time but I am
not involved in any environmental Activities; (4) I do not buy green products. I
believe that business and government should be fixing environmental problems;
(5) I am the least involved in environmentalism. I believe that there is not much
that an individual can do in solving environmental problems. It should be the
government and business which should promote the environment.
Research Hypotheses
According to Mayank & Amit (2013), when green values of each
individuals are changed, so it will affect the purchasing behavior of green
products. there is moderate positive correlation between preference of green
products and green values of the customers. This implies that there is impact of
other factors also on green purchase behavior.
Consumers aware of the environment issues problem, customer will
changes their purchase behavior towards green products. This implies that there is
impact of green awareness also on purchase decision towards green products
(Mayank & Amit, 2013).
H2 : Green awareness is positively related to the purchase of green products
Marketing campaigns on green products can help companies in increasing
product brand awareness and building positive corporate image in the minds of
the customers (Adkins 2004; Varadarajan and Menon 1988). This implies that
there is impact of green perception also on purchase decision towards green
products (Mayank & Amit, 2013).
H3 : Green perception is positively related to the purchase of green products
RESEARCH METHODOLOGY
This research uses a causal research which includes in the type of
conclusive research by using the quantitative approach. According to Hair et al.
(1995), “causal relationship is dependence relationship between two or more
variable in which the researcher clearly specify that one or more variable cause or
create an outcome represented by at least one other variable must meet the
requirement for causation”. This research has a purpose to prove specific
hypotheses of green value, green awareness, and green perception affect towards
the Purchase of green products with brand of Toyota Agya in Surabaya.
This research use several primary data, which is obtained directly from the
source which is questionnaire. The questionnaire will be answered by the
respondents in Surabaya. The scale in this research is use the likert interval scale
which has the same range and homogenous with different value in each number.
Questionnaire that given to the respondent is closed ended questions, that is the
answer of the questionnaire is restricted using alternative answer of numerical
scale. The type of the scale is use the five-point scale.
The target characteristic of the population is the Toyota Agya owner in Surabaya.
The population of this research is male or female whose age is ranged from 17
years old and domiciled in Surabaya. The researcher choose 17 because it is
expected they can fill the questionnaire well. There are also some criteria which
include that the respondents own Toyota Agya in Surabaya for the past 1 year.
With all of these criteria, the researcher could expect that respondents will
understand the question provided the questionnaires and can give the most
objectives answer about the question itself.
The analysis of this research is Multiple Linier Regression, that is a statistical
technique that simultaneously develops a mathematical relationship between two
or more independent variables and interval-scaled dependent variable. It involves
a single dependent variable and two or more independent variables. The questions
raised in the context of this regression can also be answered via multiple
regression by considering additional independent variables (Malhotra, 2010:577).
RESULT AND DISCUSSION
After the result of data processing is claimed as both valid and reliable, researcher
describes the research data which found 100% respondents are as the criteria as
explain before. The researcher also analyze further about the mean value and
standard deviation of each statements. Afterwards, measurement model of the
study is done which obtained from the processing of the data using SPSS
software. In first running, the result explains the classical assumption of multiple
linear regression.
Table 1
The Result of Multicollinearity test
Variable
Colinierity Statistics
Tolerance VIF
Green Perception (X1) 0,769 1,300
Green Value (X2) 0,731 1,368
Green Awareness (X3) 0,819 1,220
Source: data processed by SPSS 20.0 for Windows
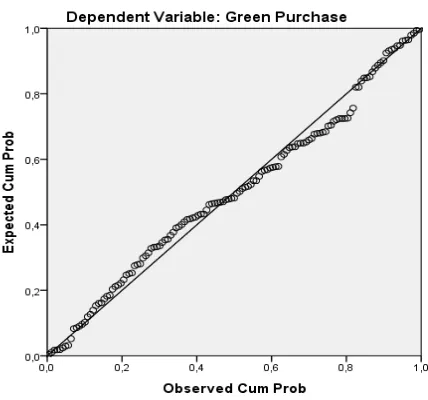
Source: data processed by SPSS 20.0 for Windows Figure 2. Scatter plot graphic
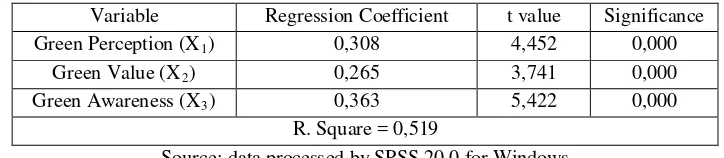
Table 2
The Result of Multiple Linear Regression
Variable Regression Coefficient t value Significance
Green Perception (X1) 0,308 4,452 0,000
Green Value (X2) 0,265 3,741 0,000
Green Awareness (X3) 0,363 5,422 0,000
R. Square = 0,519
Source: data processed by SPSS 20.0 for Windows
The strength of association in multiple regressions is measured by the square of
the multiple correlation coefficient, R2, which also called the coefficient of
multiple determination. If the coefficient determinant (R2) is 0,519 so the green
green value and green awareness variable is relate to the change of the green
purchase variable about 51,9% and the rest about 48,1% caused by other variables
like green trust and green satisfaction that has not been entangled in this research.
The partial regression coefficient, b1, denotes the change in the predict value, �,
per unit change in X1 when other independent variables, X2 to Xk, are held
constant. t test aim to prove the hypothesis that the variable of green perception,
green value, and green awareness partially related to the green purchase of Toyota
Agya significantly. If the significance value below 0,05, thus the variable is
related partially.
Table 3 The Result of t Test
Variable t value Significance Explanation
Green Perception (X1) 4,452 0,000 Significant
Green Value (X2) 3,741 0,000 Significant
Green Awareness (X3) 5,422 0,000 Significant
Source: data processed by SPSS 20.0 for Windows
The F test is used to test the null hypothesis that coefficient of multiple
determination in the population, R2 is zero. F test examines to prove that the
regression model is congruence to the data that used. Variable is related
significantly if the F test value is below 0,05.
Table 4 The result of F test
Sources Sum of Squares Mean Square F Significance
Regression 13,756 4,585
47,059 0,000
Residual 12,764 0,097
Total 26,520
Source: data processed by SPSS 20.0 for Windows
Based on the result on the hypotheses testing, it can be concluded that there is
positive influence between green perception variable; green value; green
proven, this condition is line with previous study conduct by Mayank & Amit
(2013).
Hypothesis 1, it can be concluded that the green perception is positively
related to green purchase. This proves that hypothesis 1 is generally acceptable,
and is consistent with the previous researches that conduct by Mayank & Amit
(2013). This also proves research study that stated, there is impact of green
perception also on purchase decision towards green products (Mayank & Amit,
2013). Consumers changed their buying behavior and purchase products they
considered green (Ottman 1993). This is because related marketing campaigns on
green products can help companies in increasing product brand awareness and
building positive corporate image in the minds of the customers (Adkins 2004;
Varadarajan and Menon 1988). When there is perception of green products in
each of customers, respondent are likely to choose the green products than non
green products. Green perception variable has t count of 4,452 and significance
value of 0,000 which is below 0,05, therefore green perception variable positively
related to the green purchase. If the green perception is increase, thus green
purchase of Toyota Agya consumer will significantly increase.
Hypothesis 2, it can be concluded that the green value is positively related
to green purchase. This proves that hypothesis 2 is generally acceptable, and is
consistent with the previous researches that conduct by Mayank & Amit (2013).
This also proves research study that stated that Green value is occur when
consumer get the importance or usefulness of the green practices. (Rokeach,
1973). In addition when green values of each individuals are changed, so it will
affect the purchasing behavior of green products. It shows that t count of 3,741
and significance value of 0,000 which is below 0,05, therefore green value
variable positively related to the green purchase. If the green value is increase,
thus green purchase of Toyota Agya consumer will significantly increase.
Hypothesis 3, it can be concluded that the green awareness is positively
related to green purchase. This proves that hypothesis 3 is generally acceptable,
and is consistent with the previous researches that conduct by Mayank & Amit
(2013). This also proves research study that stated there is impact of green
2013). In addition Chris (2008) show that consumers were beginning to have a
more sustainable life , become more environments friendly and be concerned
about their health. If they aware of the environment issues problem, customer will
changes their purchase behavior towards green products.It shows that t value of
5,422 and significance value of 0,000 which is below 0,05, therefore green
awareness variable positively related to the green purchase. If the green awareness
is increase, thus green purchase of Toyota Agya consumer will significantly
increase.
CONCLUSION AND RECOMMENDATION
Based on the result on the hypotheses test, it can be obtained a conclusion that
from 3 main hypothesis were developed, 3 of them are proven. The following
explanation tends to be specific as follow.
1. Green value is positively related to the purchase of Toyota Agya in Surabaya
2. Green awareness is positively related to the purchase of Toyota Agya in
Surabaya
3. Green perception is positively related to the purchase of Toyota Agya in
Surabaya
The finding of this result also provides suggestions to Toyota. The finding of
this result also provides suggestions to Toyota
a. First, Toyota needs to work harder to promote about the green products for
example put green label on every products that they launch in order to
increase customer awareness and perception. Toyota need to tell the customer
about the advantages using the green products, thus customer awareness can
change towards a green products. As the customer aware of it, customer
perception might change and tend to choose green products than conventional
products.
b. Second, Toyota should provide a green education booth in every Toyota car
exhibition to educate consumer about environmental issue problems. That
will feel responsible to evolve in any environmental activities and switch the
products that they have to be more environmental friendly.
c. Third, Toyota need to always care about the green product that being offered
to all consumers or any people for example by applying Quality Control that
focusing on green technologies and parts used to build Low Cost Green Car
(LCGC). Since every people will do evaluation of the product that bring trust
to buy green car, it is become important point for Toyota to always consider
about the advantages of the green product.
In the end, this study has a limitation. This limitation can open up opportunities
for further research in the future.
a. First, this study can be done in other city. Other study can enlarge the object of
this research, therefore it can be apply on the other green products.
b. Second, the study can be replicated at a larger scale of products to get more
insights into the behavior of consumers and understand more about green
REFERENCES
Antonio, C., Sergio, R., Francisco, M. J., 2009. Characteristics of Research on Green Marketing. Business Strategy and the Environment. Vol. 18, pp. 223-239.
Chen & Chai, 2010. A Study of Attitude towards the Environment and Green Products: Consumers’ Perspective. Journal of Management Science and Engineering.
Choi & Zhang, 2013. A Study of Green Supply Chain Management and Business Performance in China. Journal of Green Marketing.
Davidson, A. R., Yantis, S., Norwood, M. and Montano, D. E., 1985. Amount of Information about the Attittude Object and Attitude Behavior Consistency. Journal of Personality and Social Psychology, Vol. 49, No. 5, pp. 1184-1198.
Davis, Joel J., 1992. Ethics and Environmental Marketing. Journal of Business Ethics. Vol. 11, No. 2, pp. 81-87.
Freeman, R. E. and Liedtka. J., 1991. Corporate Social Responsibility: A Critical Approach. Business Horizons. Vol. 34, No. 4, pp. 92-98.
Gurau, C. and Ranchhod, A., 2005. International green marketing: A comparative study of British and Romanian firms. International Marketing Review, 22(5), 547-561.
Hair, J. F., Jr., Anderson, R. E., Tatham, R. L., & Black, W. C., 1995. Multivariate Data Analysis. New Jersey:Prentice-Hall
Hermann, A., 2007. The Influence of price fairness on customer satisfaction: an empirical test in the context of automobile purchases. Journal of Product & Brand Management, 16, 49-58.
Kassaye, W. W., 2001. Green dilemma. Marketing Intelligence & Planning, 19 (6), 444-55.
Keller, G. M., 1987 Industry and the Environment: Toward a New Philosophy. Vital Speeches. Vol. 54, No. 7, pp. 154-157.
Krause, D., 1993. Environmental consciousness: An empirical study. J. Environ. Behav. 25(1), 126-142.
Mayank & Amit, 2013. A Study of Consumer Perception and Preferences in India. Electronic Green Journal. Vol 36, (1). pp. 1-19.
Malhotra, Naresh K. 2010, Marketing Research, An Applied Orientation. Fifth edition, Pearson.
Ottman, J., 1992. Sometimes consumers will pay more to go green. Marketing News (July 6), 16.
Porter, M. E., and Claas van der Linde., 1995. Green and Competitive: Ending the Stalemate. Harvard Business Review, September-October (1995), pp.119-134.
Renfro, L. A., 2010. Green Business Operations and Green Marketing. Gatton Student Research Publication. Vol. 2, No. 2.
Robert, L. Brennan., 2003. Coefficients and Indices in Generalizability Theory. Center for Advanced Studies in Measurement and Assessment, 28 - 29
Shearer, Jeffery W., 1990. Business and the New Environmental Imperative. Business Quarterly. Vol. 54, No. 3, pp. 48-52.
Soonthonsmai, V., 2007. Environmental or green marketing as global competitive edge: Concept, synthesis, and implication. EABR (Business) and ETLC (Teaching) Conference Proceeding, Venice, Italy.
Spruyt, A., Hermans, D., Houwer, J. D., Vandekerckhove, J, and Eelen, P., 2007. On the Predictive Validity of Indirect Attitude Measures: Prediction of Consumer Choice Behavior on the Basis of Affective Priming in the Picture-Picture Naming Task. Journal of Experimental Social
Psychology, Vol. 43, No. 4, pp. 599-610
Sugiyono, 2008. Metode Penelitian Kunatitatif Kualitatif dan R&D. Alfabeta, Bandung
Uma, Sekaran, 2000. Research Methods for Business: A Skill-building Approach. Third Ed. New York: John Wiley & Sons, Inc., p. 288.
Weiner, J. L. and Doescher, T.A., 1991. A Framework for Promoting Cooperation. Journal of Marketing, Vol. 55, pp. 38-47.
Zeithaml, V., Parasuraman, A. & Malhotra, A., 2002. Service Quality Delivery Through Web Sites: A Critical Review of Extant Knowledge. Journal of the Academy of Marketing Science, vol. 30, Issue 4, pp.362--‐375.
http://www.washingtonpost.com/blogs/wonkblog/wp/2013/07/09/you-cant-deny-global-warming-after-seeing-this-graph/ downloaded February 2015
http://www.livestrong.com/article/157564-examples-of-green-products/ downloaded February 2015
http://www.petrolprices.com/green-guide downloaded February 2015
http://oto.detik.com/read/2014/08/19/172537/2666680/1596/keuntungan-menggunakan-mobil-ramah-lingkungan downloaded February 2015
http://tips-otomotif-terbaru.blogspot.com/2013/10/macam-macam-mobil-murah-ramah-lingkungan downloaded February 2015
http://www.toyota global.com/innovation/environmental_technology/hybrid downloaded February 2015
http://banten.antaranews.com/berita/20452/survei-permintaan-mobil-ramah-lingkungan-melesat downloaded February 2015
http://www.petrolprices.com/green-guide downloaded February 2015
http://www.ucsusa.org/clean_vehicles/why-clean-cars/air-pollution-and-health/cars-trucks-air-pollution downloaded February 2015
http://oto.detik.com/read/2014/08/19/172537/2666680/1596/keuntungan-menggunakan-mobil-ramah-lingkungan downloaded February 2015
http://www.washingtonpost.com/business/capitalbusiness/newbreakthroughs-in-green-car-technology-not-all-about-hybrids-and-electrics downloaded February 2015
http://gaptex.com/pengertian-lcgc downloaded February 2015