Manuscript received March 2017, revised June 2017 Copyright © 2017 Universitas Muhammadiyah Yogyakarta - All rights reserved
Radiosonde Transmitter Meisei iMS-100 Study as Observation on
Air at Meteorology Station Klas I Depati Amir Pangkalpinang
Fardhan Arkan
*1, Demson Nababan
21,2Department of Electrical Engineering, University of Bangka Belitung
Kampus Terpadu Balun Ijuk Merawang Kabupaten Bangka, Bangka Belitung, Indonesia *Corresponding author, e-mail: [email protected]
Abstract – Radiosonde is one of the high technologi tools and useful for aeronautical. In radiosonde have several censor like air temperature, air pressure, air damp, vapor point, direction and air speed. Data from measure result will be receive by supervise station in earth surface. Information will be collected by sub area air upstairs in Meteorology Stasion Klas I Depati Amir Pangkalpinang. Observation was doing at 00.00 UTC (07.00 am) and at 12.00 UTC (07.00 pm). Transmitter in this observation is GPS Radiosonde iMS-100.Result shows that the radiosonde can work well at air pressure of 20 to 1000 hPa. Copyright © 2017 Universitas Muhammadiyah Yogyakarta- All rights reserved.
Keywords: Radiosonde, Transmitter, Weather, GPS
I.
Introduction
Weather and climate have an important role in the field of transportation. Bad weather conditions can cause aircraft accident, it will incur additional costs caused by it. Therefore, required a technology to obtain information about the condition of the atmosphere so that plane accident can be avoided. Information about the atmosphere above the earth's surface can be observed with various ways and by various methods. Wrong by using radiosonde method [1].
Radiosonde is one of the most useful high-tech tools for aeronautics. Inside this radiosonde there are several sensors such as air temperature, air pressure, humidity, dew point, direction and wind speed. Radiosonde uses a hot air balloon filled with hydrogen gas and launched into the atmosphere [2]. The measurement data will be received by the observation station on the surface of the earth [3]-[6]. This information will be collected by the airspace at the agency for meteorology, climatology, and geophysics. Weather element data generated from observations of weather elements will be forwarded to ATC (Air Traffic Control) to support
the smoothness and safety of existing flight.
This observation aim to find out the working principle of radiosonde equipment operation and to know the average daily value from 29 May 2017 to 6 July 2017 at the Meteorological Station of Class I Depati Amir Pangkalpinang.
II.
Fundamental Theory
II.1. Operational Amplifier (Op-Amp)
Operational Amplifier (commonly known as Op-Amp) is an electronic component composed of resistors, diodes, and transistors. The buffers of the Op-Amp are arranged in an integrated circuit or commonly known as Integrated Circuit (IC). Op-Amp in it application is commonly used as an amplifier [7].
Figure 1. OP-Amp Circuit
II.2. Global Positioning System (GPS)
According to (winardi, 2016) Global Positiioning System (GPS) is a system to determine the location of the earth surface with the help of synchronization of satellite signals. This system uses 24 satellites that transmit microwave signals to the earth. This signal is acceptable to the instrument received by the receiver on the surface, and is used to determine the location, speed, direction and time. Systems similar to GPD include GLONASS Russia, Galileo EU, IRNSS India [8].
Figure 2. How satellite determine the position The GPS system, whose real name is the NAVSTART GPS (Navigation Staelite Timing and Ranging Global Positioning System), have three segments: satellite, controller and receiver. GPS satellite orbiting the earth, with orbits and fixed positions (exact coordinates), totaling 24 pieces of which 21 are active and the remaining 3 are reserves.
To be able to know the position then needed a tool called GPS reciever that serves to receive signals sent from GPS satellite. The position converted to a point known as a way-point will be the latitude and longitude coordinates of the position or location.
II.3. Electromagnetic Wave
Electromagnetic wave are wave that have electrical properties and magnetic properties simultaneously. Radio wave are part of the electromagnetic wave in the radio frequency spectrum. The transmission of electromagnetic wave in space is as a transverse wave.
Wave are characterized by wavelength and frequency. The wavelength (λ) is related to the frequency (ƒ) and velocity (ѵ) shown in Equation 1.
(1)
Where,
λ =
Wavelength (m)
c = Propagation speed of light (m/s)
ƒ = Frecuency (Hz)
II.4. Antenna
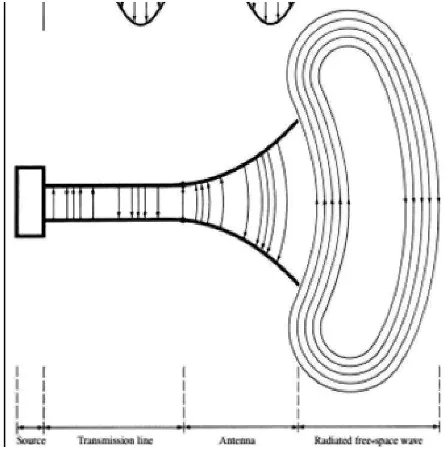
Antenna is defined as a metal device (eg a conductor or wire rod) that serves to radiate or receive radio wave. IEEE Standard 145-1983 define is antenna or aerial as a device that serves to radiate and receive radio wave. In other word the antenna is a transfer structure between the free space and the guide medium, as shown in Figure 3.
The guide medium or transmission line may be a coaxial cable or a waveguide, and guide medium used to carry electromagnetic energy from transmitter to antenna, or from the antenna to the receiver [9].
Copyright © 2017 Universitas Muhammadiyah Yogyakarta - All rights reserved Journal of Electrical Technology UMY, Vol. 1, No. 2
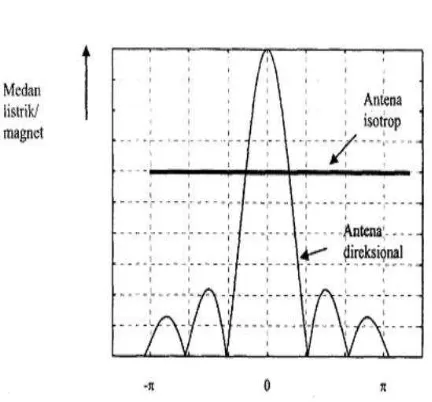
II.5. Unidirectional Antenna
Unidirectional antenna is an antenna that concentrates energy in a certain direction [10]. If the same transmit power as the isotropic antenna is used, there will be a comparison of the electric magnetic field between the isotropic antenna and the directional antenna as shown in figure. 4.
.
Gambar 4. Comparison of Electric Field Distribution on Isotrop Antenna and Directional
III.
Results and Discussion
III.1. Transmiter
The transmitter used in the upper air observations is radiosonde. Radiosonde is a tool used in weather balloons that measure various atmospheric parameter and transmit data to a fixed receiver. The transmitter used in this observation is the Radiosonde iMS-100 GPS flown in a Totex-Japan 500/600 gram air balloon. By using hydrogen gas to fly the air balloon.
In radiosonde systems flown into the upper air already contains radio transmitters working 400.3 MHz, batteries, temperature sensors, humidity sensors and pressure sensors. This equipment is flown every 00:00 UTC (07.00 WIB) and 12.00 UTC (19.00 WIB). This equipment will transmit elevation data, temperature, direction and wind density, humidity and air pressure from the atmosphere to the earth. sending the weather information data will stop typing the blown air balloon.Transmitter has dimensions of 155 x 87 x 87 mm with a weight of 150 grams.
Figure 5. Radiosonde iMS-100
III.2. Receiver Outdoor
Receivers used in air observations consist of indoor units and outdoor units. The outdor unit consists of yagi antenna, GPS antenna, and amplifier. This antenna is used to receive top weather information sent by radiosonde that is acceptable under all conditions. This antenna is installed open space and has a minimum height of 10 meters from the ground and protected from trees and builds to avoid communication disturbances between the transmitter and receiver.
Figure 6. GPS Radiosonde antenna
III.3. Receiver Indoor
Indoor receiver consists of GPS Sonde Receiver which has frequencies 400 - 406 MHz. GPS Sonde Receiver can work with AC voltage 100-230 Volt with a maximum power of 70 Watt. In GPS Sonde Receiver also has a LAN output port (Local Area Network) connected to the CPU Server.
GPS sonde Receiver is connected to CPU Server using LAN cable and RS232C cable. Data will be processed on this server so as to generate top weather data. GPS Sonde Receiver has dimensions of 370 x 150 x 450 mm weighing 11.7 Kilograms.
Figure 7. Receiver Indoor
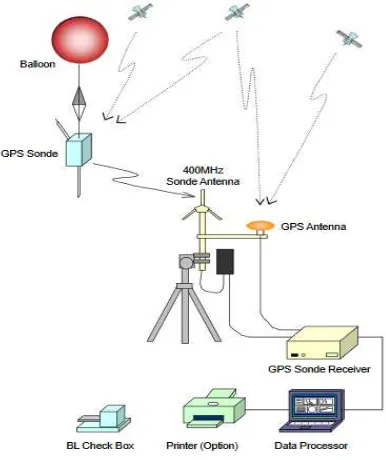
III.4. Block Diagram of Upper Air Observation Work System
This observation process started with the release of the air balloon along with the radiosonde already installed by scanning the observation equipment code into the Meisei GPS Sonde Observation System (MOSS) system.
Copyright © 2017 Universitas Muhammadiyah Yogyakarta - All rights reserved Journal of Electrical Technology UMY, Vol. 1, No. 2 During the observation, the process will run
automatically by the sounde receiver that is integrated with the computer device to display weather data.
System tool is divided into three parts of GPS Sonde which in it already installed temperature sensors, humidity, air pressure and wind speed. Receiver outdoor as a data receiver that will forward to the receiver indoor, there is a 400 MHz antenna and GPS Antenna. The receiver indoor will display password data on the server computer.
III.5. Analysis of Radiosonde Data of Upper Temperature Based
On the data of the average day temperature indicated in figure 9 it can be said that the value of the average temperature of the upper air at 00.00 UTC can be said to be too significant against the air pressure. Minimum temperature achieved occurred at air pressure at 100 hPaie -77.35ºC while the maximum temperature occurs at a pressure of 1000 hPa air of 25.74ºC. So if the greater the air pressure then the temperature will rise.
Figure 9. Graph of average daily temperature values from 29 May to 6 July 2017 at 00:00 UTC
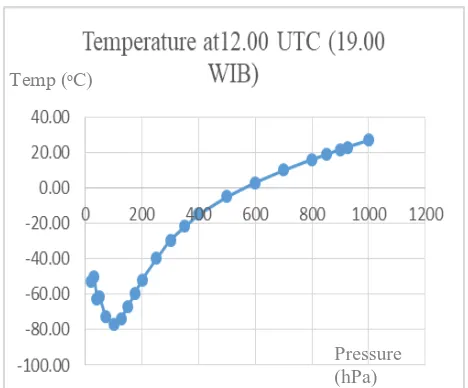
Figure 10. Graph of average value of temperature daily on 29 May until 6 July 2017 at 12.00 UTC
Based on the data of mean day temperature results shown in figure 10 it can be said that the value of the average temperature of the upper air at 12.00 UTC can be said to be too significant to the air pressure. The minimum temperature achieved occurs at air pressure at 100 hPaie -77.13ºC while the maximum temperature occurs at air pressure of 1000 hPaie 26.75ºC. The higher the air balloon up the smaller the air pressure resulting in lower temperature.
III.6. Radiosonde Data Analysis Upper Humidity
Figure 11 shows the graph of average daily humidity value at 00.00 UTC.
Figure 11. Graph of average daily humidity value at 00.00 UTC
Pressure (hPa)
Temp (ᵒC)
Pressure (hPa)
Temp (ᵒC)
Hum (%)
Based on the data value of the results of the average humidity shown in Figure 11 can be said that the humidity that occurred at 00:00 UTC is very humid. Where minimal humidity occurs at 250 hPa air pressure is 44.50% while maximum humidity occurs at a pressure of 1000 hPa of 89.54%. The greater the air pressure the greater the moisture.
Figure 12. Graph of average daily humidity value from 29 May to 6 July at 12:00 UTC
Based on the data value of the results of the average humidity shown in Figure 12 can be said humidity that occurs at 00:00 UTC is very humid. Where minimal humidity occurs at 250 hPa air pressure is 39.50% while maximum humidity occurs at a pressure of 1000 hPaie 81.15%. So if the air pressure gets bigger the air humidity will be great too.
III.7. Radiosonde Data Analysis Upper Air Density
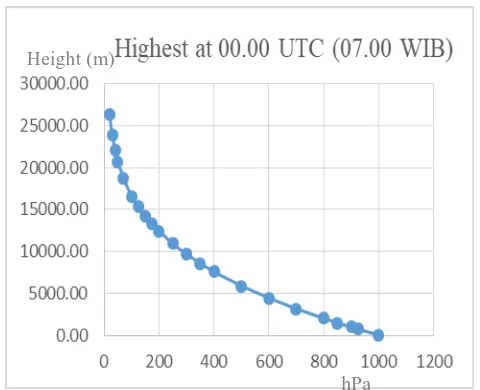
Figure 13 shows the Graph of average daily altitude values from 29 May to 6 July at 00:00 UTC.
Based on the data of average yield value shown by figure 13 it can be said that the height reached radiosonde highest reach 26.364 m. It can also be said that the higher the radiosonde the lower the pressure the air gets. It can also be seen the highest altitude at 26,364 m with 20 hPa air pressure and the highest air pressure reaching 1000 hPa.
Figure 13. Graph of average daily altitude values from 29 May to 6 July at 00:00 UTC
Figure 14. Average value graph daily altitude on the 29th of May until 6 july at 12:00 UTC
Based on the data of the average yield value shown by figure 14 it can be said that the highest attainable radiosonde reaches 25.875 m. It can also be seen the highest altitude at 26,364 m with 20 hPa air pressure and the highest air pressure reaching 1000 hPa. So the higher the radiosonde fly the lower air pressure.
III.8. Radiosonde Data Analysis Wind Speed
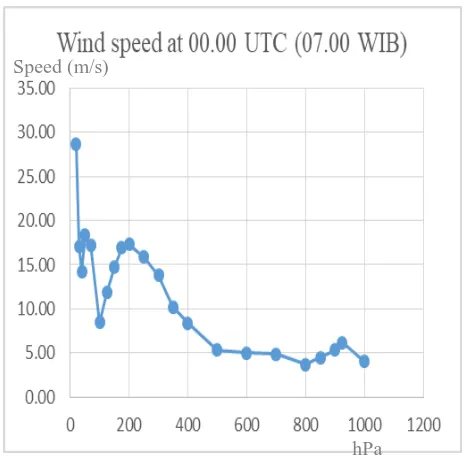
Figure 15 shows the of average daily wind velocity value from 29 May to 6 July 2017 at 00:00 UTC.
hPa Hum (%)
Height (m)
hPa
Copyright © 2017 Universitas Muhammadiyah Yogyakarta - All rights reserved Journal of Electrical Technology UMY, Vol. 1, No. 2 Figure 15. Graph of average daily wind velocity
value from 29 May to 6 July 2017 at 00:00 UTC
Based on the data value of the average daily output shown in figure 15 it can be said that wind speed is very different every air pressure. The maximum average wind speed occurs at 20 hPa air pressure of 28.67 m/s, while the minimum mean wind speed occurs at 800 hPa air pressure of 3.69 m/s. So the greater the pressure then the wind is getting smaller.
Figure 16. Average value graph daily wind speed on the 29th of May until 6 july at 12:00 UTC
Based on the data value of the average daily output shown in Figure 16 it can be said that the wind speed is very different every air pressure. The
maximum average wind speed occurs at 20 hPa air pressure of 26.77 m/s, while the minimum mean
1. Radiosonde transmitter iMS-100 can work well at air pressure of 20 to 1000 hPa.
2. At the air observation at 00:00 UTC (07.00 WIB) obtained minimum temperature is -77.350C and maximum temperature 25,740C. The lowest air humidity is 44.50% and the highest is 89.54%. The height reached radiosonde is 26.364 m. While the minimum wind speed of 3.69 m/s and a maximum of lowest air humidity is 39.50% and the highest is 81.15%. While the minimum wind speed is 3.15 m/s and maximum 26.77 m/s.
References
[1] Zuhal, Zhanggischan. 2004. Prinsip Dasar Elektronika. Jakarta: PT. Gramedia Pustaka Utama. [2] Nash, J. 2007. Introduction to upper air
measurements with radiosondes and other in situ observing systems. Integrated Ground-based Observing Systems Applications for Climate, [3] Meteorology and Civil Protection. Italy.
[4] Fujita, M.. et al. Differential GPS Radiosonde Observation System. Meisei Electric Co., Ltd.. Japan.
[5] Malik, et al. Development and Production of GPS based Radiosonde. New Delhi: Instruments Division, India Meteorological Department.
[6] Ermawan. E. 2009.“Jurnal Sains Nusantara”, Profil
Vertikal Suhu Atmosfer Diatas Indonesia Berbasis Hasil Analisis Data Satelit, Formosat-3/Cosmic, vol.7, no.1,pp. 176-200.
Speed (m/s)
hPa
Speed (m/s)
[7] Siregar, Plato M. 2010. Slide Kuliah, "Instrumentasi Meteorologi Bab 9: Radiosonde". Prodi Meteorologi, ITB, Bandung.
[8] Prawirowardoyo. Susilo. 1996. "Meteorologi", ITB, Bandung.
[9] Ndsstudios. 2008. RAOB Displays and Parameters. http:// www.raob.com/display.php diakses 2 November 2017.
[10] Mutaqqin, Andi Syahid. Dkk. 2010. Analisis Data Rawinsonde Dengan Aplikasi RAOB 5.7. Departemen Geofisika dan Meteorologi : Institut Pertanian Bogor.Raymond McLeod Jr. and George
P. Schell, “Management Information Systems, Ninth Edition”, Prentice Hall, 2003.
Authors’ information
Fardhan Arkan Received B.Sc degree
from Department of Electrical
Engineering Universitas
Muhammadiyah Yogyakarta in 2000, M.Eng. degree from Department of Electrical Engineering, Universitas Andalas, Padang, Indonesia in 2014. Fardhan Arkan, M.Eng. is a Lecturer in Department of Electrical Engineering, Universitas Bangka Belitung, Indonesia. His research interests are in electronics, telecommunications, and its applications