The Relationship between Logistics and Economic Development
in Indonesia: Analysis of Time Series Data
Mohammad Reza1,2
Abstract: This paper investigates the relationship between logistics and economic development in Indonesia using time series data on traffic volume and economic growth for the period from 1988 to 2010. Literature reviews were conducted to find the most applicable econometric model. The data of cargo volume that travels through sea, air and rail is used as the logistics index, while GDP is used for the economic index. The time series data was tested using stationarity and co-integration tests. Granger causality tests were employed, and then a proposed logistic model is presented. This study showed that logistics play an important role in supporting and sustaining economic growth, in a form where the economic growth is the significant demand-pull effect towards logistics. Although the model is developed in the context of Indonesia, the overall statistical analysis can be generalized to other developing economies. Based on the model, this paper presented the importance of sustaining economic development with regards continuously improving the logistics infrastructure.
Keywords: Logistics, GDP, economic growth, logistic model, time series.
Introduction
Logistics pl→ys →n import→nt p→rt in → country’s
economy, where rapidly developing economy intuit-tively supports the logistics development. For this reason, developing countries have given considerable attention to the development of logistics. With this linkage, logistics is expected to grow in line with the economic development and vice versa.
As one of the largest developing economies, Indone-sian economic development is a subject worth ex-ploring. Up until 2012, Indonesian economy has grown at an average of 5% per year since the post monetary crisis in 1998, and has reached its peak at 6.5% in 2012. The latest GDP data show that Indonesian GDP reached 1.124 billion USD in 2011, with the current forecast, it can reach a GDP value of 1.542 billion in 2015. With this current trend, the economy will keep growing for the subsequent years.
Related to Indonesian economic development, an inquiry of whether the Indonesian logistics infrastructure can meet the demand of the economic development is an issue worth investigating. One of the biggest challenges faced by Indonesia would be the overwhelming demand of improving the logistics infrastructure, while at the same time to move away from the use of its colonial infrastructure.
1 Faculty of Graduate Studies, Logistic Management Program, Chulalongkorn University, 254 Phayathai Road, Pathumwan, Bangkok Thailand. 10330.
2 United Nations Economic Commisions for Asia and the Pacific, S-3182, United Nations, New York, NY, 10017. Email: [email protected]
In accordance with the relationship between logistics and economic development rate of change, policies and action plans can be prepared to reach a synchro-nization point between logistics development and the
Indonesi→’s r→pidly growing economy. The findings would be useful to estimate how close is the relation-ship, in order to finally get something useful as a tool to plan the long–term development of Indonesian national economy. This paper will try to introduce an econometric model, to stress the importance of sus-taining economic development with regards conti-nuously improving the logistics infrastructure.
Literature Review
Several studies have been attempted to present the linkages between logistics and economic growth, from the perspective of logistics management re-searchers and development economists, as described in the paragraphs below.
Liu [7] has done research on the relationship between the logistics industry development and eco-nomic growth in China using the grey analysis me-thod, by using GDP as dependent variable, and seve-ral logistics industry indicators, namely: logistics in-dustry added value, total employment in the logistics industry, new fixed assets investment, freight volu-me, freight turnover as the independent variables.
different trend in different stages, spotting potential saturation point, and estimating the elasticity coefficient.
Huang et al. [5] performed an analysis of the relationship between logistics development and GDP growth in China. Their research used the traffic turnover volume as the index of logistics scale and GDP as the economic growth index. Their time series data from which the correlation was tested by using a statistical regression method was then used for Granger causality tests. Sun [9], used similar time series methodology to analyze Tianjin Province in China, using port capacity and total value of import & export as indexes.
Xie and Luo [10] performed similar research as Huang et al. [5] focusing on Hunan Province in China using cointegration tests and causality tests. It uses GDP as the most common economic indicator
with freight volume →nd →dded v→lue of Hun→n’s
tertiary industry as indexes. The research was also extended by means of performing stability analysis by using cumulative sum tests and Hansen tests.
Chen [1] did a similar research as Shao and Zheng [8] by adopting a logistic growth curve model by focusing on Jiangsu Province in China, and found that the logistics industry was closely related with the growth of national economy.
Wang [11] did a research combining the method used by Huang et al. [5] namely stationarity, co-integration, and Granger causality test; and the method used by Chen [1] by using logistic regression analysis.
Gopal [3] presented his result by comparing graphical similarities between nominal GDP growth and external trade growth trends in Southeast Asia. His research is presented by presenting two separate phenomena without correlating them. On one hand there already exists research on mapping the similarities of logistics growth and GDP growth; as there are research on the relationship between logistics infrastructure and economic growth in a particular region.
Gopal [3] argued that there is quite a high interest of readership to make a case for developing logistics infrastructure (ports, roads, trade facilitation, etc.). While Huang et al. [5], Chen [1], and Liu [7] has presented an idea that a mathematical and/or economic model can be built. Models that were built for analyzing the relationship between logistics infrastructure and economic growth in China or in Chinese provinces, can be be modified of improved for analyzing Indonesia.
Methods
Data Selection
Selection of a Representative Indexes
The challenge of this study is to collect the data and to select representative indexes. With regards to the logistics index, in the beginning, it is practically difficult to get an index that can reflect the logistics volume or scale because of the broad concept of logistics. The aspect of logistics of physical items covers the field of material handling, inventory, transportation, warehousing. Perhaps it can be seen that the intersecting point on all the aspect is the cargo or the goods itself. Therefore in this research, the author will use traffic or cargo volume as the logistics index.
GDP is used as the economic indicator index, as it is a well-accepted indicator of the national economic development. GDP is the value of all goods and services produced within a country. The GDP time series annual data have been adjusted by using pur-chasing power parity (PPP) calculation to take into account relative costs and inflation, rather than by using the nominal GDP of which it uses government official exchange rates of a given year which may distort the real differences in income.
Data Availability
The original data for this research are taken from the Indonesian Bureau of Statistics. Indonesian GDP is well recorded since 1967, while the logistics volume data of sea, rail, and air are recorded later, from 1988, 1987, and 2003, respectively. Due to the limitation of the data, there will be two types of analysis in this paper. First, the research will combine the sea and rail logistics volume starting from 1988 to 2010, and then will combine all the three logistics medium of sea, rail, and air starting from the latest available data from 2003.
Data Analysis
Time Series Analysis
Figure 1. The growing tendency of the lnCargo and lnGDP
Figure 2. First-order difference of lnCargo and lnGDP where stationarity can vi visually seen.
Results and Discussion
Stationarity Test
It can be seen from Figure 1 that there is a growing trend of both the logistics and economic indexes, whereby the growth tendency and the pace of change are quite consistent with each other. This indicates that between them, there is potentially a strong correlation. In addition, as shown in Figure 2, their first-order difference are found to be stationary. Both from the graph and the table, it can be confirmed that economic growth and logistics are in a form of first-order stationary sequence.
Cointegration Test
The cointegration test between logistics and econo-mic growth is actually a test for a long-term stable relationship between the two variables. This paper will test the basic correlation, by using Engle-Granger and Johansen test. The results are avai-lable in Table 2, 3 and 4.
As can be seen from the Table 2, 3 and 4, there is a cointegration between regional logistics and econo-mic growth. In other words both it indicates that there is a long-term stable relationship between the two variables.
Table 1. Stationarity test result for the lnGDP and lnCargo
Variable ADF
Test Value
Critical Value
5%
Critical Value
10%
Finding
lnGDP -2.460 -3.60 -3.24 Non stationary lnCargo -2.670 -3.60 -3.24 Non stationary DlnGDP -3.033* -3.00 -2.63 Stationary DlnCargo -5.429** -3.00 -2.63 Stationary DDlnGDP -4.239* -3.60 -3.24 Stationary DDlnCargo -3.474* -3.60 -3.24 Stationary *) Acceptable up to 5%
**) Acceptable up to 1%
Table 2. Correlation relationship of the two variables
Variable lnGDP lnCargo
lnGDP 1 0.9391
lnCargo 0.9391 1
Table 3. Engle Granger two-step coointegration tests Critic→l V→lue t-Statistic p-value ADF Test Result -2.193962 0.0304
1% -2.685718
5% -1.959071
10% -1.607456
Table 4. Johansen coointegration test
Hypthesized Number of CEs
Eigenvalue Statistic Critical Value
Probability
None 0.353886 12.42462 12.3209 0.048 At most 1 0.168439 3.689024 4.12990 0.065
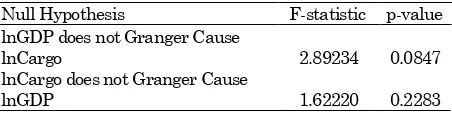
Table 5. Granger Causality for a single lag variable
Null Hypothesis F-statistic p-value
lnGDP does not Granger Cause
lnCargo 5.00243 0.0375
lnCargo does not Granger Cause
lnGDP 1.26270 0.2751
Table 6. Granger causality for a double lag variable
Null Hypothesis F-statistic p-value
lnGDP does not Granger Cause
lnCargo 2.89234 0.0847
lnCargo does not Granger Cause
lnGDP 1.62220 0.2283
Granger Causality Test
According to the principle of Granger causality test, we can test two assumptions whether the cargo leads to economic growth or economic growth leads to the improvement of cargo turnover.
Causality is tested in lag order of one and two. The one and two time lag is chosen in order to check whether one in index influence another in the following year or the following two years. The two variables Granger causality is shown in Table 5. In a single lag, at the 5 % level of significance, lnGDP is found to Granger cause lnCargo. In a double lag, at the 10% level of significance, lnGDP is also found 19
20 21 22 23 24 25 26 27 28
88 90 92 94 96 98 00 02 04 06 08 10
Granger cause lnCargo. While the other way around in both lag orders, lnCargo does not lnGDP.
Therefore, from this test we can conclude that, the time series data constitute significant one-way cau-sality from lnGDP towards lnCargo. This conclusion means that economic growth is the significant demand-pull effect towards logistics.
Proposed Model
From the Granger causality tests, we can see that the economic growth influence the growth in the Indonesian logistics sector. We can then select an appropriate mathematical model to describe the relationship between the logistics and economic growth. From the sea and rail cargo volume and GDP growth trend from 1998 to 2010 displayed in Figure 1, we can see the significant positive corre-lation between cargo volume and GDP, with a potential of a non-linear trend that may show an S-curve-like trend. Therefore the statistical description between the cargo volume and GDP is best approximated by using a logistic model.
Based on the S-curve-like characteristics and with reference to previous research, we can use the logis-tics curve to try to fit the relationship. The proposed theoretical equation is presented as follows:
⁄ (1)
Where u is upper bound constant, while a and b are the coefficients. The interesting characteristic of a logistic curve is that the rise is primarily slow and then gradually accelerating, when it is accelerated to some point, the growth rate is gradually stagnant then finally reached a horizontal line. To use easily the parameter estimation method of the linear model, the equation (1) is transformed into equations as below:
(2)
(3)
(4)
We then transform ( ⁄ ⁄ ), ln a =a’ and
ln b = b’, while u is the upper bound value where we
will use Indonesian forecasted GDP in 2015 of 1,542 billion as the constant upper bound value. This 2015 GDP number was chosen because Indonesian GDP growth can not grow to infinity considering its dependence on non-renewable resources, its depen-dence foreign investment, and its relation to the logistics sector. When we transform equation (4), we then have a linear equation (5) as below:
(5)
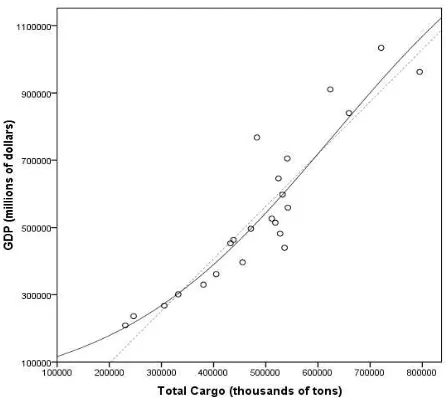
Figure 3. Scatter Graph between GDP and Logistics Volume with the estimated regression line (Solid line: Lo-gistic regression; Dotted line: linear regression)
After running the numbers of logistics volume starting from 1988 to 2010 and Indonesian annual GDP using statistical software, it yields the equation (6) below:
(6)
After running the statistical test we obtain, R2= .874,
adjusted R2= .868, showing the goodness of fit is very
high. x and y Student’s t-test is 2545958.41 and 5.0332, respectively, where both t-test numbers are acceptable up to 0.0001 level of significance. While F= 145.7793, a highly accepted number.
On the basis of coefficient of determination R2 and
inferential statistics tests, the logistic regression equation (6) fits very well. Comparison of the result between linear and logistic regression is displayed in Figure 3, it can be seen, to some extent that even visually the logistic regression fits better than the linear one.
Marginal Analysis
The result from the equation (6) satisfies the condition of: 0<b<1, lnb<0, box>0, and (1/u+abx) 2>0, then we could conclude that the change (dy/dx>0) will be positive. In other words, the growth in the logistics sector will go along with the GDP growth. To analyze the magnitude of the contribution, we differentiate (dy/dx) of equation (1), to become:
(7)
|
The result from equation (7) above means that the GDP will increase 1.753 million dollars, for each unit freight volume increase (in thousands of tons).
Elasticity
To analyze the elasticity we try to get elasticity coefficient of the Indonesian logistics industry on GDP on the basis of logistics model of equation (1):
(8)
To become:
(9)
The el→sticity coefficient ξ denotes the GDP r→te of
change as the freight volume increases by 1%, under the condition that bx>0, (1/u+abx)>0, 0<b<1, lnb<0,
→nd ξ>0. In other words, el→sticity equ→tion (9) →↓ove
represents the trend of GDP in accordance to the logistics industry. According to the latest 2010
st→tistic→l d→t→, we c→n c→lcul→te ξ2010= 1.259, which
means that, using the logistic model, when the freight volume will increase 1% it contributes to 1.259% of GDP growth.
Inflection Point Analysis
From the marginal analysis, we can see that logistics industry impact is always positive (dy/dx>0). It is then worth investigating to find the inflection point by finding the double derivative (d2y/dx2) of the model. We differentiate equation (7), to become:
(
)
(10)According to (d2y/dx2=0) we get x=596543, which is the inflection point where the maximum GDP occurs. This means that when the freight volume is less than 596543, the GDP growth will increase as the freight volume increases. In the same manner, when the freight volume is higher than 596543, the GDP growth will decrease as the freight volume increases.
Indonesian freight volume in 2010 is 721138, which was higher than the inflection point. In addition, one example where decline occurred when the freight vo-lume decreases from 794900 in 2009 to 721138 in 2010. From the marginality analysis the growth in freight volume still plays a positive part in the GDP growth. At the current stage, combining the margi-nal amargi-nalysis and the inflection point amargi-nalysis, the
rate of economic growth is still positive along with the freight volume growth. As presented in the S-curve model, the growth rate however, will gradually become slower.
The point of maximum growth, however, has passed. According to the model, the maximum growth where (d2y/dx2=0) with x=596543, occurred somewhere in the second half of the year 2006. The peak growth in 2006 was 1.539% for every 1% freight volume in-crease, while the growth in 2010 declined to the rate of 1.259%. Therefore, a timely decision to invest in the logistics infrastructure as a result of the gain from economic growth, is mathematically justified.
Conclusion
Based on the time series data analysis of this paper and the logistic model proposed, it can be seen that there is a strong relationship between logistics deve-lopment and economic growth. Indonesia is located between very important trade routes, of which it will take the greatest advantage of the important geogra-phic position and seize the opportunities of the rising consumer and the producer market to develop modern logistics industry.
Many efforts have been proposed and have been undertaken like creation of domestic economic corri-dors, national logistics integration plan, and west-east sea corridor pendulum. All those efforts have the potential to boost traffic of domestic and interna-tional goods, and would potentially contribute to-wards economic growth. The Indonesian government has released an Indonesian Logistics Blueprint; these plans need to be executed as scheduled (Indonesian Cabinet Secretariat [6]). With support of the statistical data above, there is a risk of capacity saturation of logistics services. Government, with private partnership, must unite to develop the logistic infrastructure and foster logistics industry. These infrastructures do not only cover physical infrastructure of building roads, bridges, ports, and airports; but also implements fast logistics turnaround with support of Information Technology and educates more logistics talents and supply chain experts.
According to the empirical model, we can conclude that the logistics industry contributes greatly to the Indonesian economic growth. The contribution of the logistics industry to economic growth shows a different trend in different stages. Currently Indo-nesian GDP is showing a quite steady growth with strong resilience, despite the global economic slowdown which started in 2008. When relating it to the logistic growth, it can be seen that there is a potency of a stagnant growth, even up to the stage of declining growth. The tendency can be seen when the relationship between GDP and logistics volume is represented in the logistic regression where it was shown by using the elasticity and inflection point analysis that the point of maximum growth has passed. The future development of logistics industry may risk being in stagnant or even negative growth phase if the relatively rapid growth of the Indonesian economy does not translate to investments in physical logistics and supporting infrastructure.
With the mathematical model presented in the ana-lysis, contribution of the logistics development to-wards the proportion of economic growth can offer a useful insight. However, it needs to be noted that, cargo volume, which was used as the logistics index in this paper is only one of many available potential indicators. The use of other data such as, logistics in-dustry added value, total employment in the logistics industry, new fixed asset investment, freight turnover should also be taken into account, even though collecting the data for these indicators may be quite challenging, in comparison to collecting the cargo volume data. In addition, the cargo volume, does not cover the road cargo volume which may potentially play a quite significant part in domestic and international land border trade.
References
1. Chen, Y., Empirical Analysis on the Effects of Logistics Industry on Economic Growth in Jiangsu Province, International Conference on Industrial Engineering and Engineering Mana-gement, Beijing, China, 3-5 September, IEEE, 2011, pp. 1454-1457.
2. Cui G., and Li X., Research on the Relationship between the Regional Logistics and Economic Development Based on the Model VAR, Inter-national Conference on Management Science and Industrial Engineering, Harbin, China, 8-11 January, IEEE, 2011, pp. 120-124.
3. Gopal, R., Overview of Port Logistics Infrastruc-ture Development in ASEAN, in 10th ASEAN Shipping and Ports, Jakarta, Indonesia, 30 May 2012, available at: http://www.slideshare.net/
FrostandSullivan/frost-sullivan-overview-of-port-logistics-infrastructure-development-in-asean (accessed 1 October 2012).
4. Gujarati, D. N., Basic Econometrics, Internatio-nal Edition - 5th ed. McGraw-Hill Higher Educa-tion, 2008.
5. Huang W., Li W., and Liu W., Analysis of the Dynamic Relation between Logistics Develop-ment and GDP Growth in China, International Conference on Service Operations and Logistics, and Informatics, Shanghai, China, 21-23 June, IEEE, 2006, pp.153-157.
6. Indonesian Cabinet Secretariat, Indonesian Lo-gistics Blueprint (in Bahasa Indonesia), Jakarta, Indonesia, available at: http://www.ekon.go.id/ pages/sislognas/cetak-biru-pengembangan-sistem-logistik-nasional, accessed 1 October 2012.
7. Liu, S., A Research on the Relationship of Logistics Industry Development and Economic Growth of China, International Business Re-search, Canadian Center of Science and Edu-cation, 2(3), 2010, Toronto, Canada, pp 197-200. 8. Shao, Y., and Zheng, J., Research on the Effects
of Logistics Industry on Economic Growth in Jilin Province in China, Canadian Social Science, 7(6), 2011, pp. 134-137.
9. Sun, Y., Empirical Analysis of Beijing logistics Industry's GDP Contribution to the National Economy, First International Workshop on Database Technology and Applications, Wuhan, Hubei, China, 25-26 April 2009, pp. 53-56. 10.Xie, C., and Luo, D., Empirical Studies on the
Relationship Between Logistics Development and the Economic Growth of Tertiary Industry of Hunan Province, Finance and Economics De-partment, Hunan University of Technology, Zhu-zhou, Hunan, China, 2010, pp. 102-107, available at: http://www.seiofbluemountain.com/upload/ product/201007/2010wlhy02a3.pdf (accessed 1 October 2012).
11.Wang, A., Empirical Study on the Interaction Relationship of Regional Logistics and Regional Economic Growth, International Conference on Business Management and Electronic Informa-tion, Guangzhou, China, 13-15 May 2011, pp. 603-606.
12.Wooldridge, J., Introductory Econometrics: A Modern Approach, 4th Edition, South-Western, 2008.