Lecture Notes in Electrical Engineering
Volume 349
Board of Series editors
Leopoldo Angrisani, Napoli, Italy Marco Arteaga, Coyoacán, México Samarjit Chakraborty, München, Germany Jiming Chen, Hangzhou, P.R. China Tan Kay Chen, Singapore, Singapore Rüdiger Dillmann, Karlsruhe, Germany Haibin Duan, Beijing, China
Gianluigi Ferrari, Parma, Italy Manuel Ferre, Madrid, Spain Sandra Hirche, München, Germany Faryar Jabbari, Irvine, USA Janusz Kacprzyk, Warsaw, Poland Alaa Khamis, New Cairo City, Egypt Torsten Kroeger, Stanford, USA Tan Cher Ming, Singapore, Singapore Wolfgang Minker, Ulm, Germany Pradeep Misra, Dayton, USA Sebastian Möller, Berlin, Germany
Subhas Mukhopadyay, Palmerston, New Zealand Cun-Zheng Ning, Tempe, USA
Toyoaki Nishida, Sakyo-ku, Japan Bijaya Ketan Panigrahi, New Delhi, India Federica Pascucci, Roma, Italy
Tariq Samad, Minneapolis, USA
Gan Woon Seng, Nanyang Avenue, Singapore Germano Veiga, Porto, Portugal
Haitao Wu, Beijing, China
Mitsuo Gen
·
Kuinam J. Kim
Xiaoxia Huang
·
Yabe Hiroshi
Editors
Industrial Engineering,
Management Science
and Applications 2015
Editors
Library of Congress Control Number: 2015938793
Springer Heidelberg New York Dordrecht London
c
Springer-Verlag Berlin Heidelberg 2015
This work is subject to copyright. All rights are reserved by the Publisher, whether the whole or part of the material is concerned, specifically the rights of translation, reprinting, reuse of illustrations, recitation, broad-casting, reproduction on microfilms or in any other physical way, and transmission or information storage and retrieval, electronic adaptation, computer software, or by similar or dissimilar methodology now known or hereafter developed.
The use of general descriptive names, registered names, trademarks, service marks, etc. in this publication does not imply, even in the absence of a specific statement, that such names are exempt from the relevant protective laws and regulations and therefore free for general use.
The publisher, the authors and the editors are safe to assume that the advice and information in this book are believed to be true and accurate at the date of publication. Neither the publisher nor the authors or the editors give a warranty, express or implied, with respect to the material contained herein or for any errors or omissions that may have been made.
Printed on acid-free paper
Preface
This LNEE volume contains the papers presented at the International Conference on Industrial Engineering, Management Science and Applications (ICIMSA2015) which was held in Tokyo, Japan on May 26-28, 2015.
ICIMSA2015 received over 350 paper submissions from various countries. After a rigorous peer-review process, 114 full-length papers were accepted for presentation at the conference. This is intended for maintaining the high standards of the conference proceedings.
The conference is intended to bring together the researchers and technologists work-ing in different aspects of Industrial Engineerwork-ing, Management Science and Applica-tions. In addition to the contributed papers, internationally known experts from several countries were invited to deliver Keynote speeches at ICIMSA2015.
Much of the credit of the success of the conference is due to the topic coordina-tors who have devoted their expertise and experience in promoting and in general co-ordination of the activities for the organization and operation of the conference. The coordinators of various session topics have devoted a considerable time and energy in soliciting papers from relevant researchers for presentation at the conference. The Ses-sion Chairs of the different sesSes-sion played important role in conducting the proceedings of the session in a timely and efficient manner.
On behalf of the Organizing Committee, we would like to thank Springer LNEE for publishing the proceedings of ICIMSA2015. We also would like to express our sincere and grateful thanks to our Program Committee and Reviewers for providing extra help in the review process. The quality of a refereed volume depends mainly on the expertise and dedication of the reviewers.
VI Preface
invitation letters and assisting in the various stages of the editorial work. Finally we would like to thank our organization committee for their several months of hard work in sorting out manuscripts from our authors.
We look forward to seeing all of you next year at ICIMSA2016 in Korea.
Organizing Committee
General Chairs
Mitsuo Gen Fuzzy Logic Systems Institute and Tokyo
University of Science, Japan
Xiaoxia Huang University of Science and Technology Beijing,
China
Kuinam J. Kim Institute of Creative Advanced Technologies,
Science and Engineering, Republic of Korea
Yabe Hiroshi Tokyo University of Science, Japan
Steering Committee
Nikolai Joukov Chair of IEEE CS STCOS, USA
Borko Furht Florida Atlantic University, USA
Bezalel Gavish Southern Methodist University, USA
Kin Fun Li University of Victoria, Canada
Publicity Chairs
Dan (Dong-Seong) Kim University of Canterbury, New Zealand
Workshop Chairs
Kuinam J. Kim Kyonggi University, Republic of Korea
VIII Organizing Committee
Financial Chairs
Kyoungho Choi Institute of Creative Advanced Technologies,
Science and Engineering, Republic of Korea
Program Chairs
Adel Hejaaji Engineering Services Management Limited
[ESM LTD] ESSEX, UK
Organizers and Supporters
Institute of Creative Advanced Technologies, Science and Engineering (iCatse) Chinese Management Science Society (CMSS)
Korean Industry Security Forum (KISF) Korea Information Assurance Society (KIAS) Kyonggi University
University of Science and Technology Beijing Tokyo University of Science
River Publishers
Program Committee
Chil-Chyuan Kuo Ming Chi University of Technology, Taiwan
Suksan Prombanpong King Mongkut’s University of Technology
Thonburi, Thailand
Ramayah Thurasamy Universiti Sains Malaysia, Malaysia
Siana Halim Petra Christian University, Indonesia
Yves De Smet Université Libre de Bruxelles, Belgium
Marco Aiello University of Groningen, The Netherlands
Catalina Lucía Alberto Universidad Nacional de Córdoba, Argentina
Llewellyn C.M. TANG University of Nottingham Ningbo China, China
M. Birasnav New York Institute of Technology, USA
Enslin Johannes van Rooyen Tshwane University of Technology, South Africa
Supachart Iamratanakul Kasetsart University, Thailand
Luciana Hazin Alencar Universidade Federal de Pernambuco, Brazil
Jui-Sheng Chou National Taiwan University of Science and
Technology, Taiwan
Shimpei Matsumoto Hiroshima Institute of Technology, Japan
Ahm Shamsuzzoha University of Vaasa, Finland
Minghai Jiao Northeastern University, China
Organizing Committee IX
Ahm shamsuzzoha Sultan Qaboos University, Oman
Seren OZMEHMET TASAN Dokuz Eylul University, Turkey
Yoshinobu Tamura Yamaguchi University, Japan
António Grilo Faculdade de Ciências e Tecnologia da
Universidade Nova de Lisboa, Portugal
Fabrizio Maria Maggi University of Tartu, Estonia
V. Cruz Machado Universidade Nova de Lisboa, Portugal
Md Mamun Habib Universiti Utara Malaysia, Malaysia
Kittisak Jermsittiparsert Rangsit University, Thailand
Adel Hejaaji Engineering Services Management Limited
[ESM LTD] ESSEX, UK
Ulrich Reimer University of applied sciences St. Gallen,
Switzerland
Hardeep Singh Ferozepur College of Engg & Technology, India
Fatemeh Almasi Amirkabir University of Technology
(Tehran polytechnic), Iran
Yiliu Liu Norwegian University of Science and Technology,
Norway
Ryo HARUNA Kanazawa Gakuin University, Japan
Ilias Santouridis Technological Educational Institute (TEI) of
Thessaly, Greece
Purit Thanakijkasem King Mongkut’s University of Technology
Thonburi, Thailand
Chun-Cheng Lin National Chiao Tung University, Taiwan
Michel ALDANONDO Toulouse University - Mines Albi -, France
Jinho Lee Korea Naval Academy, Republic of Korea
Mojahid F. Saeed Osman King Fahd University of Petroleum and Minerals,
Saudi Arabia
Jaekyung Yang Chonbuk National University, Republic of Korea
Suprakash Gupta Indian Institute of Technology (B H U), India
Alejandro Escudero-Santana Universidad de Sevilla, Spain
RIKA AMPUH HADIGUNA Andalas University, Indonesia
Andreas Dewald University of Erlangen, Germany
Kit Fai Pun The University of the West Indies, West Indies
Abdol S. SOOFI University of Wisconsin-Platteville, USA
El-Houssaine AGHEZZAF Ghent University, Belgium
Chompoonoot Kasemset Chiang Mai University, Thailand
Ana Paula Ferreira Barroso Universidade Nova de Lisboa, Portugal
Virgínia Helena Arimateia
de Campos Machado Universidade Nova de Lisboa, Portugal
Contents
Regional Location Decision for Thai Garment Industry:
An AEC Perspective. . . . 1
Walailak Atthirawong, Wariya Panprung
Key Performance Indicators for Sustainable Campus Assessment:
A Case of Andalas University . . . . 11
Elita Amrina, Febriza Imansuri
Minimum Partial Encryption for JPEG/JPEG2000 Medical Image
Protection. . . 19 Seong Min Yoo, Jun Hoo Park, Jae Cheol Ryou
The Optimal Hedging Strategy for Commodity Processors
in Supply Chain. . . 27 Ehsan Bolandifar, Zhong Chen
Application of MFCA and Dynamic Programming in Operations
Improvement: A Case Study . . . . 35
Atchara Songkham, Chompoonoot Kasemset
Value Analysis of Coco Board for Production Sustainability. . . . 45
Marianne B. Calayag
Effect of Temperature on the Colour and TSS Removal of Batik Dye
Wastes in an Integrated Biological and Filtration Treatment System. . . . 55
N.A. Ramlee, M.N. Mohd Rodhi, S.F. Abdul Manaf, F. Hamzah, A. Anuar, A. Datu Brandah
A Multi-agent Approach for Production Management. . . . 65
Ana Paula M. Tanajura, Valdir Leanderson C. Oliveira, Herman Lepikson
Design of Experiment for Predicting Residual Stresses in Gas Tungsten
Arc Welding Process. . . . 77
XII Contents
Hands-on Industrial Process Modelling Using the MATLAB System
Identification Toolbox. . . . 85
Abubakar Sadiq Bappah
Model Based Design of Finger Exoskeleton for Post Stroke Rehabilitation
Using a Slotted Link Cam with Lead Screw Mechanism . . . . 95
Mohd Nor Azmi Bin Ab Patar, Takashi Komeda, Jamaluddin Mahmud, Cheng Yee Low
Quantile Estimation Using a Combination of Stratified Sampling
and Control Variates. . . 105 Marvin K. Nakayama
A Simulation-Based Analysis for Inter Release Problem in Airport
Baggage Handling Systems . . . . 115
James T. Lin, Irene Liou, Chun-Chih Chiu
A New Two-Phase Approach for Petri Net Based Modeling
of Scheduling Problems . . . . 125
Reggie Davidrajuh
Simulation and Analysis of Impulse Faults in Power Transformer. . . . 135
Kaveri Bhuyan, Saibal Chatterjee, Anwesa Yadav, Sarita Bansal, Sanat Kumar Paul
The Online Study Design for Different Study Location Environment,
Using ICT and Social Methodology Tool . . . 143 Platt Pangthong, Phudinan Singkamfu
Telematics Technology Development Forecasting: The Patent Analysis
and Technology Life Cycle Perspective. . . . 149
Shu-Hao Chang, Chin-Yuan Fan
Empirical Study of Collaborative Learning Knowledge Management
System for Thai Students. . . . 159
Krittawaya Thongkoo, Chiraporn Thongkhu
Factors for Enterprise Resource Planning System Selection to Support
Information Management of Manufacturers. . . . 165
Porntida Kaewkamol
Low Level of Licensing Activities by Universities in Japan . . . 173 Shigenori Hata, Kumiko Miyazaki
Analysing Industry Clustering to Develop Competitive Advantage
Contents XIII
University-Industry Linkages (UILs) and Research Collaborations:
Case of Thailand’s National Research Universities (NRUs). . . . 189
Naparat Siripitakchai, Kumiko Miyazaki
Factors Affecting the Use of Information Technology for Collaboration
among Government, Educational and Tourism Small Business Sectors. . . . . 199
Kannika Daungcharone
How Managerial Capabilities of Entrepreneur Leverage Innovative
Capability of SMEs: A Perspective of TIM . . . 207 Qingrui Xu, Siyu Liu, Zhiyan Wu
Definition of Complex Hurst and Fractional Analysis for Stock
Market Fluctuation. . . . 215
Qing Zou, Yufan Hu, Jun Steed Huang
Water Cycle and Artificial Bee Colony Based Algorithms for Optimal
Order Allocation Problem with Mixed Quantity Discount Scheme. . . . 229
Chanikarn Praepanichawat, Charoenchai Khompatraporn, Chorkaew Jaturanonda, Chiranya Chotyakul
The Management of Assessment and Allocation of Marshalling Yards
and Designation Their Catchment Areas. . . . 241
Juraj Camaj, Jana Lalinská, Jaroslav Masek
Improving Vehicle Routing Decision for Travel Agency in Chonburi,
Thailand. . . 251 Tantikorn Pichpibul
Differential Evolution Algorithm for Storage Location
Assignment Problem. . . . 259
Warisa Wisittipanich, Pongsakorn Meesuk
Master Production Scheduling for the Production Planning
in the Pharmaceutical Industry. . . . 267
Sivinee Wattitham, Tuanjai Somboonwiwat, Suksan Prombanpong
A Hybrid Genetic Algorithm for Simultaneous Scheduling of Machines
and AGVs in FMS. . . . 277
James T. Lin, Chun-Chih Chiu, Yu-Hsiang Chang, Hung-Ming Chen
Collaborative Agents Supporting Tactical Planning Activities – An
Industrial Application . . . 287 Ana Paula M. Tanajura, Pinar Öztürk, Herman Lepikson
Minimizing Makespan Using Node Based Coincidence Algorithm
in the Permutation Flowshop Scheduling Problem. . . . 303
XIV Contents
An Inventory System of Packaging Materials: Case Study at PT. Djambi
Waras Jujuhan . . . . 313
Nilda Tri Putri, Jonrinaldi, Y.R. Risa Noviani
A Pattern In Formgiving Design: Giving Priority To a Principle Solution
in Industrial Design Situation . . . . 331
Rusmadiah Anwar, Shahriman Zainal Abidin, Oskar Hasdinor Hassan
Simulation of Logistic Operations. . . 341
Jana Lalinská, Kendra Martin, ˇCamaj Juraj
Contracting Decisions in Project Management – An Outline
of the Dedicated Decision Support System. . . 347 Tomasz Błaszczyk, Paweł Błaszczyk
Factory Logistics Improvement Projects: Case Northern Thailand . . . . 357
Sakgasem Ramingwong, Apichat Sopadang, Korrakot Yaibuathet Tippayawong
Enhancing Project Funding Decision Quality . . . . 363
Ofer Zwikael, Ying-Yi Chih
Software Project Team Selection Based on Enterprise Social Networks. . . . . 375
Panos Fitsilis, Vassilios Gerogiannis, Leonidas Anthopoulos
Study on the Agriculture Information Cloud Architecture
and Application. . . . 385
Peng Qing, Ming Ye, Guangyuan Liu
Enhanced Value Stream Mapping: Potentials and Feasibility of IT
Support through Manufacturing Execution Systems . . . . 393
Markus Philipp Roessler, Ina Kleeberg, Moritz Kreder, Joachim Metternich, Klaus Schuetzer
Automatic Oil Palm Detection and Identification from Multi-scale
Clustering and Normalized Cross Correlation . . . . 403
Teerawut Wong-in, Tonphong Kaewkongka, Nagul Cooharojananone, Rajalida Lipikorn
A Comparison Approach for Accuracy Feature of Requirements
Prioritization Models . . . . 411
Jenjira Jaimunk, Pradorn Sureephong
A Novel Approach on Operation and Maintenance Guideline
Contents XV
Rutting Load Equivalency Factors of Heavy Vehicles Operating
in the Sothern Part of Malaysian Peninsula. . . . 429
Osama Mahmoud Yassenn, Intan Rohani Endut, Mohamed Ahmed Hafez, Siti Zaharah Ishak
Enhancing Virtual Manipulatives for After-School Tutoring
in the Subtraction Unit. . . . 439
Wen-Chung Shih
Implementing an Information System Development Simulation
in an Industrial Engineering Class: A Case Study . . . 451 Sakgasit Ramingwong, Lachana Ramingwong
Exploring the ISO 14001 Environmental Management System (EMS) towards SMEs Organizational Performance: Case Study of Southern
Malaysia Furniture Manufacturers . . . . 459
A.H. Nor Aziati, Ng Seow Chian, Abdul Talib Bon, Y. Ngadiman, M.F. Ahmad
Happy Workers Work Happy? The Perspective of Frontline
Service Workers . . . . 473
Wan-Jung Hsiao
Analyzing Cargo Loss Severity of Electronics Products
with Decision Tree. . . . 477
Mu-Chen Chen, Pei-Ju Wu, Chih-Kai Tsau
A Comparison of Inventory Management between Decentralized
and Centralized Distribution Networks with Backorder . . . . 485
Kanokwan Singha, Parthana Parthanadee, Jirachai Buddhakulsomsiri
A Study on Hong Kong Rice Supply Chain Risk Management
with Value Chain Analysis. . . . 491
Anthony Lam, Tao Zhang, Kin Keung Lai
The Role of Product Development to Drive Product Success:
An Updated Review and Meta-Analysis. . . . 501
Yosephine Suharyanti, Subagyo, Nur Aini Masruroh, Indra Bastian
Management Practices of Thai Silk Product . . . . 511
Kanogkan Leerojanaprapa, Walailak Atthirawong
Fuzzy Multi-objective Supplier Selection Problem:
Possibilistic Programming Approach. . . 521 Dicky Fatrias, Ahmad Syafruddin Indrapriyatna, Difana Meilani
Value Adding and Improving Factors of Thai Long Steel Supply Chain
for ASEAN Economic Community. . . . 531
XVI Contents
Analysis of Causal Competitive Factors of Thai Iron and Steel Supply
Chain by DEMATEL Method. . . . 541
Supattra Rattanavijit, Tuanjai Somboonwiwat, Charoenchai Khompatraporn
Combining Balanced Scorecard and Data Envelopment Analysis to Design Performance Measurement for Supply Chain Actor
and Regulator: A Case Study in Innovative Product in Indonesia . . . . 551
Elisa kusrini, Subagyo, Nur Aini Masruroh
A Study of Consumers’ Post Consumption Behaviour for Mobile Phone
in Indonesia. . . 563 Siti Mahsanah Budijati, Subagyo, Muhammad Arif Wibisono,
Nur Aini Masruroh
Green Supply Chain Assessment to Operations Improvement
for Can Packaging Industry. . . . 575
Tuanjai Somboonwiwat, Tuangyot Supeekit, Patiyut Punta
Selection of Digital Marketing Channels: Application of Modern
Portfolio Theory . . . . 585
Tomás Frausto-da-Silva, António Grilo, Virgílio Cruz-Machado
The Effect of Stockout Cause and Brand Equity on Consumer Preference
in Online Retailing . . . . 599
Jun Ding, Qiang Lu, Xianghua Chu
Development of a Remote Controlled Mobile Robot for Toy Application
Using RF Module in PIC Microcontroller . . . . 609
Rionel Belen Caldo, Donabel D. Abuan, Elmer P. Dadios
Generalized Space Fourier Transform Method for the Analysis
of Electrical Machines . . . . 617
Ankita Dwivedi, S.K. Singh, R.K. Srivastava
Product Attribute Analysis for Customer Involvement
in Value Creation . . . . 629
Risdiyono
Influence of Gender of Customers on Service Quality . . . . 639
S. Valli Devasena
The Service Quality of Indonesia’s Logistics Service Provider
in Preparation for ASEAN Economic Community. . . 647 Mahendrawathi ER, Thananya Wasusri, Hanim Maria Astuti,
Contents XVII
Effects on Physical and Mechanical Properties of Thermochemical
Treated Kenaf (Hibiscus Cannabinus) Fibres Composite Board. . . . 657
Mohamad Nurul Azman Mohammad Taib, Mohd Ariff Jamaludin, Masitah Abu Kassim
Design Process Using Lean Six Sigma to Reduce the Receiving
Discrepancy Report of ACE Logistics. . . . 665
Jervie Bersamin, Roselyn Drio, Ariane Lanel Lacibal, Camille Manalastas, Sheily Mendoza, Ghil Michael Danico Orallo, Carl Timmothy Tan
A Study on Carbon Emission Effects of Foreign Direct Investment
in Secondary Industry of Shandong Province . . . 675 Bin Xiong, Meng-jiao Wang
An Evaluation Performance of Log Periodic Dipole Antenna
Based on the Parameter of Flux Density of the Solar Radio Burst Event. . . . 685
Z.S. Hamidi, N.N.M. Shariff
Attitude and Opinion of Bicycle-Helmet Signal. . . . 693
Pattama Longani, Orawit Thinnukool, Anusorn Yodjaiphet
Real Time Customer Satisfaction Index. . . . 701
Afizan Azman, Luwe Cheng Wong, Mohd Fikri Azli, Siti Zainab, Kirbana Jai Raman, Sumendra Yogarayan
FLC-Based Indoor Air Quality Assessment for ASHRAE Standard
Conformance. . . 711 Rionel Belen Caldo
Artificial Intelligent System to Stop Bots from Playing Online Games. . . . 719
Gagandeep Singh, Pooja Choudhary, Vikrant Sharma
Multi-lane Detection Based on Original Omni-Directional Images. . . . 727
Chuanxiang Li, Bin Dai, Tao Wu
A Framework for Text Classification Using Intuitionistic Fuzzy Sets. . . . 737
Peerasak Intarapaiboon
An Adaptive Incremental Fuzzy TSK Controller Combined
with Evolutionary Optimization . . . . 747
Niusha Shafiabady, Rajprasad K. Rajkumar, Dino Isa, J. Michael Menke, M.A. Nima Vakilian
Ground Grid Integrity Testing Using Matlab Fuzzy Logic Toolbox . . . 759 Bryan M. Dimayuga, Kevin Martin E. Jaron, Alexander T. Montero,
Mark Kenneth Z. Peros, Rionel Belen Caldo
Filtering as a Tool of Diversity in Ensemble of Classifiers . . . . 767
XVIII Contents
Mining High Utility Patterns in Different Time Periods. . . . 779
Show-Jane Yen, Yue-Shi Lee
Content Based Image Retrieval Using Fuzzy Texton and Shearlet
Transform . . . . 791
Sudhakar Putheti, P.R. Krishna Prasad, Srinivasa Reddy Edara
Assessing Lean Implementation . . . . 803
Timo Schröders, Virgílio Cruz-Machado
Concealing ofAl2(SO4)3Stain by Spray Coating Process. . . . 813
Chachsanun Srisoy, Suksan Prombanpong
Developing Interfaces Based on Services to the Cloud Manufacturing:
Plug and Produce . . . . 821
Eduardo Cardoso Moraes, Herman Augusto Lepikson, Armando Walter Colombo
Optimization of Teflon Spraying Process for Non-stick Coating
Application. . . . 833
Oraphan Poonkwan, Viboon Tangwarodomnukun, Suksan Prombanpong
Multidimensional Process Analytical System for Manufacturing
Management . . . . 841
Poonphon Suesaowaluk
The Design of Machine Cluster for Loading and Unloading Slider
in the Hard Disk Drive Manufacturing . . . 849 Amarin Wongsetti, Suksan Prombanpong
A Study of Downloading Game Applications. . . . 859
Long-Sheng Chen, Chen-Wei Yen
Explicating the Trends of China’s Logistics Services for Electronic
Commerce . . . . 871
Mu-Chen Chen, Pei-Ju Wu, Wei-Hua Xiong
Measuring Customer Relationship Marketing Outcomes in the Greek
Banking Sector . . . . 881
Ilias Santouridis, Melania Stoumbou
Analysis of Websites of Top Global Logistics Providers by a Trust
Building Framework. . . . 891
Lachana Ramingwong, Sakgasit Ramingwong
An Empirical-Based Construction of the Multi-purpose Process
Reference Model for Hospital Supply Chain. . . . 901
Contents XIX
Smartphone Based Healthcare Platform and Challenges. . . . 913
Bofan Song, Bingwen Yu, Dan Zhu, Wei Jin, Ying Mu
Operating Rooms Decision Optimization Integrating Surgery Planning
and Nurse Rostering. . . . 919
Siyu Wang, Changyue Ma, Wei Xiang
Linking Hospital Supply Chain Processes and Performance to Identify
Key Performance Indicator. . . 927 Tuangyot Supeekit, Tuanjai Somboonwiwat, Duangpun Kritchanchai
Kansei’s Physiological Measurement in Small-Medium Sized Enterprises
Using Profile of Mood States and Heart Rate . . . 939 Mirwan Ushada, Tsuyoshi Okayama, Nafis Khuriyati, Atris Suyantohadi
Investigation of Customer and Technical Requirements for Designing an Ergonomics Notebook Soft Case Using Quality Function Deployment
(QFD) Approach. . . . 949
Hilma Raimona Zadry, Defri Arif Irfansyah
Demographic Characteristics in Correlation with Household
Electricity Use. . . . 959
Lusi Susanti, Prima Fithri, Karin Bestarina
Central Composite Design for the Experiments with Replicate Runs
at Factorial and Axial Points. . . 969 Haeil Ahn
A Software Trustworthiness Measure Based on the Decompositions
of Trustworthy Attributes and Its Validation. . . . 981
Hongwei Tao, Yixiang Chen, Jianmin Pang
Review Relationship TPM as Mediator between TQM and Business
Performance . . . . 991
M.F. Ahmad, A.H. Nor Aziati, Abdul Talib Bon, Y. Ngadiman, Shiau Wei Chan
Theoretical Review of Critical Factors that Impact on Global Human Resource Practices: Case on Multinational Companies in Emerging
Economies . . . . 997
Muhammad Mehmood Aslam, Syed Shaheer Hassan Rizvi, Asif Hameed
Ranking Measures for Sustaining Quality Excellence Practices:
An Empirical Investigation . . . .1009 Mehran Doulatabadi, Sha’ri Mohd Yusof
Software Reliability Analysis Considering the Fault Detection Trends
for Big Data on Cloud Computing . . . .1021
XX Contents
Effect of Vibration Transmissibility on Fatigue Lifetime of Electronic
Devices. . . .1031
Liu Yang, Ying Chen, Zenghui Yuan, Liqun Chen
Reliability Importance of the Channels in Safety
Instrumented Systems . . . .1041
Yiliu Liu, Mary Ann Lundteigen
Fatigue Damage Ratios for Heavy Vehicles Operating in the Southern
Part of Malaysian Peninsula . . . .1055 Osama Mahmoud Yassenn, Intan Rohani Endut, Mohamed Ahmed Hafez,
Siti Zaharah Ishak, Nurul Elma Kordi
Process Reliability Modeling Based on Nonlinear
Correlation Analysis. . . .1065
Chuanliang Zhang, Wei Dai, Yu Zhao
Identification of Public Awareness in Preventive Maintenance
for Personal Automobile. . . .1073
Y. Ngadiman, A.H. Nor Aziati, Abdul Talib Bon, M.F. Ahmad, Raja Zuraidah Raja Mohd Rasi, Martin Yaw Swee Hock
A Novel Analysis of Clinical Data and Image Processing Algorithms
in Detection of Cervical Cancer. . . .1091
Abhishek Das, Avijit Kar, Debasis Bhattacharyya
© Springer-Verlag Berlin Heidelberg 2015
M. Gen et al. (eds.), Industrial Engineering, Management Science and Applications 2015,
313 Lecture Notes in Electrical Engineering 349, DOI: 10.1007/978-3-662-47200-2_34
An Inventory System of Packaging Materials:
Case Study at PT. Djambi Waras Jujuhan
Nilda Tri Putri, Jonrinaldi, and Y.R. Risa Noviani
Department of Industrial Engineering, Faculty of Engineering, Andalas University, Padang 25163, Indonesia
[email protected], [email protected]
Abstract. PT Djambi Waras Jujuhan is one of Crumb Rubber Factory which is
inseparable of inventory problems. It needs packaging materials for production process, especially in packaging process. Currently, PT Djambi Waras Jujuhan has the problems in controlling inventory system of packaging materials because of one supplier only supplying materials, variation of lead time, high minimum stocks of packaging materials and pile up in the storage. The aim of the research is to propose an inventory system of packaging materials to improve inventory performance considering variations of lead time. The inventory system we proposed consists of four steps. The first step is calculating Inventory Turnover (ITO) to identify how the performance level of the existing inventory system. The second step is determining aggregate planning of packaging materials, classifying packaging materials using ABC analysis and testing distribution of lead time. The third step is determining economic order quantity and order interval, safety stock and reorder point. The fourth step is calculating total annual inventory cost considering safety stock and variation of lead time. Sensitivity analysis is performed to see the effects of changes of input parameters to the decision variables and total inventory cost. Based on analysis we have done, current inventory system of packaging materials at PT Djambi Waras Jujuhan has not been efficient yet that we can see from the value of inventory turnover. From 38 types of packaging materials, 18 types of packaging materials have the value of inventory turnover more than 1 and 20 types have the value of inventory turnover less than 1. The inventory system we proposes in this paper can save 78,46% of total current inventory cost that is Rp.320.728.188,-. Therefore, the inventory system considering variation of lead time we proposed at PT Djambi Waras Jujuhan has increased the inventory performance.
1
Introduction
314 N.T. Putri, Jonrinaldi, and Y.R. Risa Noviani
smoothness whole operation of the company in the right quantity, right quality and lowest possible cost.
Inventory problems can be influenced by several parameters such as demand, lead time, holding costs, ordering cost, back order costs and price, which often vary in the real situation. Deterministic models are not sensitive for these changes. To cope their variations, especially variations of lead time and demand, the probabilistic model is characterized by the presence of safety stock that is an important part of the company inventory policies. Safety stock be able to meet the demand during lead time [1,2].
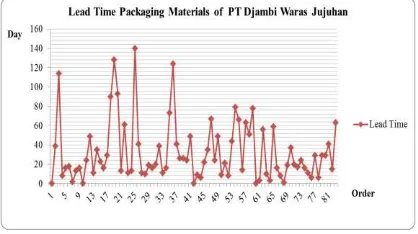
PT Djambi Waras Jujuhan is one of Crumb Rubber Factory that produces natural rubber balles into products such as: SIR-10, SIR-20 and SIR-20 CV. The company needs packaging materials for packaging process. And the company had difficulty to control the packaging materials inventory because the company has only one supplier, varying demand and lead time which varies from 1 day, 3 days, 5 days until more than 1 month, the packaging materials ordered the last period came periodically, minimum stock of packaging materials in warehouses is quite high. Because the existing inventory system for packaging materials in the company has not yet precise and optimal, so the packaging material is damaged and pill up in warehouses. This situation happened because of the size specification of the packaging materials that has been holding in previous period by the company no longer fit the size specifications set by the consumer (buyer), so that situation has explained before happened and the company is loss. Figure 1, 2, and 3 showed the variation of the finished product demand, variation of lead time, and one of the packaging materials inventory.
Fig. 1. Graph of Product Demand (SIR) in PT Djambi Waras Jujuhan
An Inventory System of Packaging Materials: Case Study at PT. Djambi Waras Jujuhan 315
Fig. 3. Graph of Label Bridgestone SIR 20 Plastic Inventory
Examples for safety stock of Label Bridgestone SIR 20 Plastic is 30,000 sheets and changed in October 2013 to be 7000 sheets, though this type of packaging material start in November 2012 until in July 2013 are not used. That type of packaging material used on August 28th, 2013 was 400 sheets. It was concluded that this type of packaging material has a lot of stock and long stored in the warehouse. As a result of too much storage, there are some packaging material that discarded due to damage such as Plastic bags SIR R 20/35 SEU damaged amount of 654 sheets or approximately 27.25 kg and removed from the warehouse on April 10, 2013. In addition, there are some packaging material have not been established safety stock to be provided by the company to cope with demand fluctuations or variations. For example: Label SMPT C 20 UG230 SIR Plastic, Red Plastic, etc.
Consequences that must be accepted by the company because inventory system still doesn’t optimal or appropriate is the high inventory cost and inventory policy for safety stock is not accurate that will increase the risk of losses in the future. Now, company management has not been too considering the consequences. Based on the issues that have been disclosed and supporting data of this research to be done so this research to improve the existing inventory system is needs by evaluate inventory system with considering variations of lead time, so the company can make appropriate planning of when order time, optimal quantity order and how much safety stock should be provided for a certain period to anticipate variations of lead time so that inventory cost can be minimized.
2
Literature
2.1 Inventory
316 N.T. Putri, Jonrinaldi, and Y.R. Risa Noviani
2.1.1 InventoryCosts
According to reference [1] the elements contained in the inventory can be divided into four groups, that is:
1. Ordering Costs
2. Inventory carrying costs/stock holding cost (%)
According to Tersine (1994), holding costs are typically at intervals of 20-40% of the investment companies [8].
3. Shortage costs/out of stock cost). 4. Capacity associated costs
2.1.2 ABCAnalysis
ABC Analysis is the method to classification material into group based on materials usage during the period of time (price per unit multiplied by the volume of material usage in period of time). ABC classification is using principle 80-20 or Pareto law which about 80% of the total inventory of material represented or represented by 20% of material inventory. Use of ABC analysis is to establish the engineering priority, purchase priority, security, recharging system (replenishment systems), and investment decisions and also can be applied in the company that have various types of inventory materials with different using value.
2.1.3 ProbabilisticModels
This model considers all variables have values that are uncertain and one or more variable is a random variable. Parameters such as demand, lead time, inventory costs are varies in the real condition. And deterministic models are not sensitive to such things. The equation used to determine the total inventory cost is using equations Economic Order Interval (EOI)-Multiple Items. The equation is as follows:
1. Total Inventory Cost
∑ ∑ (1)
2. Optimum Order Interval (T*)
∑ (2)
3. Maximum Inventory each items (Ei)
(3)
where:
Ri = Demand or requirement per item Pi = Purchasing cost per item
An Inventory System of Packa
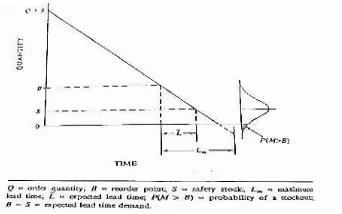
When the lead time vari time that the minimum lead minimum or maximum lim point based on a minimum time based on the results evaluated statistically, so in The solution in this case is s difference is the demand du a constant demand during le
Fig. 4. Constant De
If the lead time is norm reorder point is as follows:
where:
aging Materials: Case Study at PT. Djambi Waras Jujuhan
ies, reorder point policies that may set the lead time is d time, the average lead time or maximum lead time. Wit mit, then the reorder point should be different. If the reor lead time then tend not sufficient, and if the maximum l obtained is excessive inventory levels, so it can not n practice the reorder point based on the average lead ti similar to variation demand and constant lead time. The ba uring lead time probability distribution is obtained by add ead time. This case can be seen in Figure 4
emand and Variable Lead Time (Source: Tersine, 1994)
mal distribution, the formulations are used to optimize
mand per period
on of demand during lead time on of lead time
me in the period
s
step of the modeling system in validation the invent Two important issues in the sensitivity analysis are
optimal solutions generated to changes in the input value big error occurs (loss of profits or savings).
318 N.T. Putri, Jonrinaldi, and Y.R. Risa Noviani
3
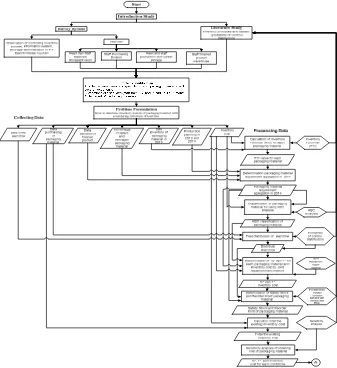
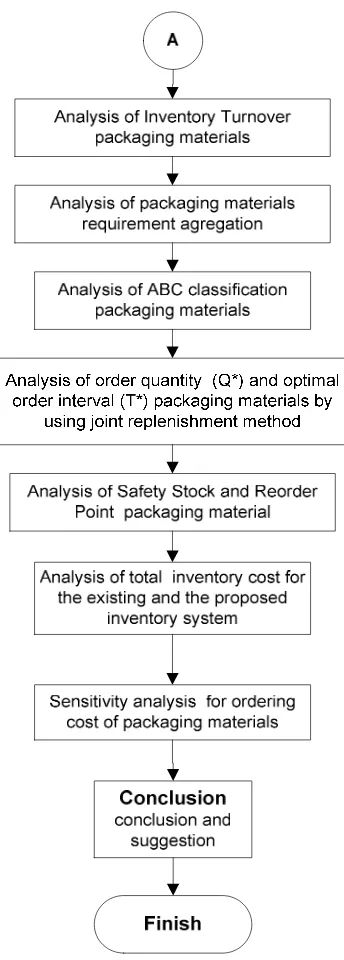
Research Methodology
Research methodology is structured for problems can be resolved with better and more focused. The steps are shown in the flowchart in Figure 5.
An Inventory System of Packaging Materials: Case Study at PT. Djambi Waras Jujuhan 319
320 N.T. Putri, Jonrinaldi, and Y.R. Risa Noviani
4
Results and Discussion
4.1 Data Collection
The data collected are as follows:
1. Data demand of finished products in 2013 2. Plan production in 2013 and 2014
3. Data supplies packaging materials in 2013 4. Component inventory cost of packaging materials 5. Percentage of defect or damaged packaging materials 6. Data oerder lead time of packaging materials 7. Data purchase of packaging materials.
Ordering costs of packaging material can be seen in Table 1, and transportation cost and PPN can be seen in Table 2, the percentage of defect packaging materials can be seen in Table 3, and data lead time can be seen in Table 4.
Table 1. Ordering Costs of Packaging Materials
(Source: Materials Storage and Purchasing Division of PT Djambi Waras Jujuhan)
Table 2. Transportation Costs of Packaging Materials
(Source: Purchasing Division of PT Djambi Waras Jujuhan)
Number Component Cost
1 Make PR from storage and buy sheet (@Rp. 1000) Rp 6.000 2 Make an coverring letter (3 pieces) @Rp. 1000) Rp 3.000 3 Goods Receiving Report 6 pieces (@Rp. 1000) Rp 6.000 4 Communication Fee via Telephone and email Rp 30.925
5 Administration Fee Rp 72.565
6 Goods Receiving Fee Rp 206.360 324.850 Rp Total
Number Component Cost
An Inventory System of Packaging Materials: Case Study at PT. Djambi Waras Jujuhan 321
Table 3. Percentage Defect of Packaging Material
(Source: Finished Product Warehouse of PT Djambi Waras Jujuhan)
Table 4. Order Lead Time of Packaging Materials
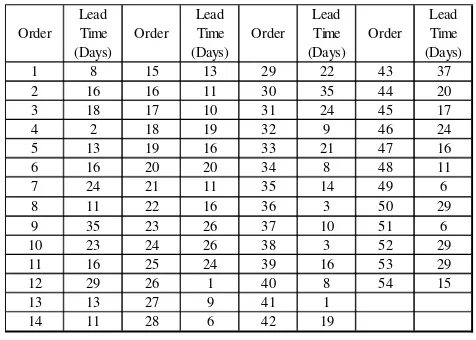
(Source: Purchasing Division of PT Djambi Waras Jujuhan)
Number Code Type of Packaging Material Unit Percentage (%)
1 PLS-0001 Plastic Bag SIR 10 SEUR Kg 3%
2 PLS-0002 Plastic Bag SIR 20 SEUR Kg 3%
3 PLS-0003 Plastic Bag SIR 20 SEUVK Kg 3%
4 PLS-0071 Bridgeston Plastic SIR 20 Sheet 3%
5 PLS-0074 Good Year Plastic SIR 20 NOLO Sheet 3% 6 PLS-0075 Good Year Plastic SIR 20 SEUNOVOLO Sheet 3% 7 PLS-0076 Good Year Plastic SIR 10 NIMBO Sheet 3% 8 PLS-0077 Good Year Plastic SIR 20 SEUCVNIVCO Sheet 3%
9 PLS-0093 Plastic SIR 10 Sheet 3%
10 PLS-0099 SMPT Plastic C UG230SIR20 Sheet 3%
11 PLS-0163 Shrink Wrapped Plastic 0,25mm x 165 mm x252 mm Kg 5%
12 PLS-0189 Blank Plastic SIR 20 SEU Sheet 5%
13 PLS-0195 Blueprint Plastic 0,14mm x 145 x 870 cm Kg 5% 14 PLS-0199 Blueprint Plastic 0,10 mm x 140 x 160 cm Kg 3% 15 PLS-0202 Gyo Plastic SR 20 SEUCOOPER TIRE Sheet 3% 16 PLS-0223 Blank Plastic 0,1 x 140 x 160 cm Kg 3% 17 PLS-0225 White Blank Plastic 0,1 mm x 125 x 160 cm Kg 3%
18 PLS-0230 Trapping Band Plastic SMPT Rol 3%
19 PLS-0253 Wire Plastic MB 0,2mm x 90 x 271 cm Kg 3% 20 PLS-0296 Red Plastic 0,14 mm x 146 x 340 cm Kg 3% 21 PLS-0297 Red Plastic 0,14 mm x 146 x 370 cm Kg 3% 22 PLS-0302 Blue Plastic 0,1 mm x 140 x 170 cm Kg 3% 23 PLS-0312 Blue Plastic 0,1 mm x 110 x 150 cm Kg 3%
24 PLS-0326 Sumtomom Plastic Sheet 3%
322 N.T. Putri, Jonrinaldi, and Y.R. Risa Noviani
4.2 Results
The following are the results of the calculations have been carrying out.
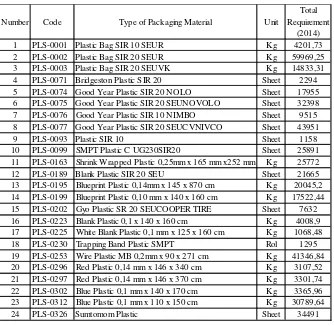
Table 5. Summary of Packaging Material Requirements 2014
Table 6. Summary of ABC Classification Based on Usage Value / Demand Packaging
Materials
Data collected amount of 80 data and after testing data distribution, data can only 54 data. This happened because there are some data that is too extreme like ordering
Number Code Type of Packaging Material Unit
Total Requirement
(2014) 1 PLS-0001 Plastic Bag SIR 10 SEUR Kg 4201,73 2 PLS-0002 Plastic Bag SIR 20 SEUR Kg 59969,25 3 PLS-0003 Plastic Bag SIR 20 SEUVK Kg 14833,31 4 PLS-0071 Bridgeston Plastic SIR 20 Sheet 2294 5 PLS-0074 Good Year Plastic SIR 20 NOLO Sheet 17955 6 PLS-0075 Good Year Plastic SIR 20 SEUNOVOLO Sheet 32398 7 PLS-0076 Good Year Plastic SIR 10 NIMBO Sheet 9515 8 PLS-0077 Good Year Plastic SIR 20 SEUCVNIVCO Sheet 43951
9 PLS-0093 Plastic SIR 10 Sheet 1158
10 PLS-0099 SMPT Plastic C UG230SIR20 Sheet 25891 11 PLS-0163 Shrink Wrapped Plastic 0,25mm x 165 mm x252 mm Kg 25772 12 PLS-0189 Blank Plastic SIR 20 SEU Sheet 21665 13 PLS-0195 Blueprint Plastic 0,14mm x 145 x 870 cm Kg 20045,2 14 PLS-0199 Blueprint Plastic 0,10 mm x 140 x 160 cm Kg 17522,44 15 PLS-0202 Gyo Plastic SR 20 SEUCOOPER TIRE Sheet 7632 16 PLS-0223 Blank Plastic 0,1 x 140 x 160 cm Kg 4008,9 17 PLS-0225 White Blank Plastic 0,1 mm x 125 x 160 cm Kg 1068,48 18 PLS-0230 Trapping Band Plastic SMPT Rol 1295 19 PLS-0253 Wire Plastic MB 0,2mm x 90 x 271 cm Kg 41346,84 20 PLS-0296 Red Plastic 0,14 mm x 146 x 340 cm Kg 3107,52 21 PLS-0297 Red Plastic 0,14 mm x 146 x 370 cm Kg 3301,74 22 PLS-0302 Blue Plastic 0,1 mm x 140 x 170 cm Kg 3365,96 23 PLS-0312 Blue Plastic 0,1 mm x 110 x 150 cm Kg 30789,64
24 PLS-0326 Sumtomom Plastic Sheet 34491
An Inventory System of Packaging Materials: Case Study at PT. Djambi Waras Jujuhan 323
lead time is more than 1 month and out of the control limits I-MR control chart. Distribution of lead time obtained is a normal distribution with a mean = 16.2 days (0,044 years) and standard deviation = 8.97 days (0,025 years).
Determination of Q * and T * packaging material the proposed system (2014) by using joint replenishment method
Code material = PLS-0002
Type of material = Plastic Bag SIR 20 SEU R
Unit = kg
Class = A
Total requirement (Ri) = 59.969,25 kg Price per unit (Pi) = Rp. 27.940, - S = ordering cost for 1x order = Rp. 324.850, - k = fraction of holding cost = 0,24
Step to determination Q * and T * are as follows:
Step 1: Calculate annual demand (PiRi)
PiRi = Rp. 27 940, - x 59969.25 kg = Rp. 1.675.540.845, -
Step 2: Total annual demand = Rp. 4.894.941.013, - Step 3: Economic Order Interval (EOI)
2
∑ 0,24 . 4.894.941.013 0,02 2 . 324.850 7 0 8,58
That included in Group AB.
Step 4: Optimal Order Quantity (Q *) Q * = Ri x Q * = 59.969,25 kg x 0,02
= 1.410,28 kg per order
Step 5: Ordering cost (TCp) Group AB
. 324.850 7 0
0,01 . 13.968.562,
Step 6: Holding cost (TCs) Group AB
2
0,01 0,24
2 . 4.894.941.013 . 13.813.571,
Step 7: Total Inventory Cost
TC = TCP + TCS
= Rp.13.968.562,- + Rp.13.813.571,- = Rp. 27.782.133, -
324 N.T. Putri, Jonrinaldi, and Y.R. Risa Noviani
Code material = PLS-0001
Type of material = Plastik Kantong SIR 10 SEU R
Class = B
Total demand in 2014 (D) = 4201,73 kg = 16.2 days = 0,044 years = 8.97 day = 0,025 years
SS =
= 2,33 x 4.201,73 kg x 0,025 = 240,59 kg
B =
= (4201,73 kg x 0,044 years) + 240,59 kg = 427,08 kg
Table 7. Summary of Inventory Cost Comparison between The Existing and The Proposed
Inventory System in 2013
Table 8. Summary Inventory Costs of The Proposed System with Considering Safety Stock
(SS) in 2014
Sensitivity analysis performed two conditions of ordering cost are: Initial condition = Rp. 324 850, -
Condition 1 booking fee up to 30% = Rp. 422 305, - Condition 2 booking fee rise 50% = Rp. 487 275, -
component of inventory system
existing inventory system
proposed inventory system ordering cost Rp 5,522,455 Rp 16,892,214 holding cost Rp 403,234,152 Rp 71,136,205 total inventory cost Rp 408,756,607 Rp 88,028,419 save Rp 320,728,188
% save 78.46%
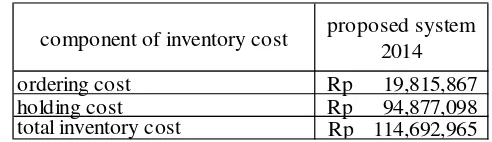
component of inventory cost proposed system 2014
ordering cost Rp 19,815,867
holding cost Rp 94,877,098
An Inventory System of Packaging Materials: Case Study at PT. Djambi Waras Jujuhan 325
Table 9. Summary of Inventory Cost Comparison between Initial Condition, Condition 1 and 2
4.3 Analysis
4.3.1 Analysis ofInventory Turnover(ITO) of PackagingMaterials
The purpose of determination ITO value was to know how quickly turnover of packaging materials in the company and how much the company invested to inventory. Inventory management of the company will be efficient if ITO value more higher. Based on the results that have been obtained from 38 types of packaging material, just only 18 types of packaging material that has ITO value > 1, its means that 18 types of packaging material is changed at least once time for a year. For example, Plastic Bag SIR 20 SEU Plastic have ITO value = 10.28 x turn of the year,
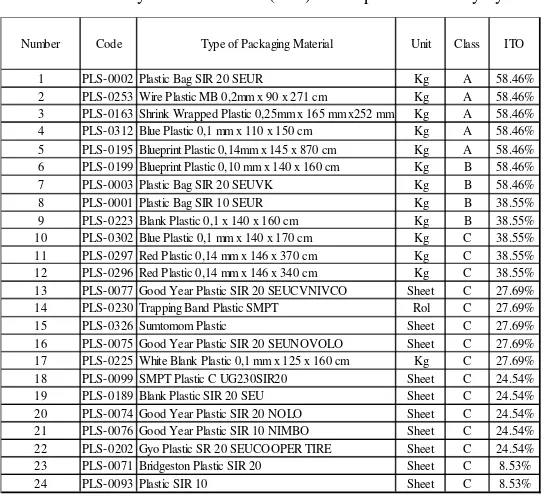
Table 10. Inventory Turnover Value (ITO) of Proposed Inventory System condition 1 condition 2
Number Code Type of Packaging Material Unit Class ITO
1 PLS-0002 Plastic Bag SIR 20 SEUR Kg A 58.46% 2 PLS-0253 Wire Plastic MB 0,2mm x 90 x 271 cm Kg A 58.46% 3 PLS-0163 Shrink Wrapped Plastic 0,25mm x 165 mm x252 mm Kg A 58.46% 4 PLS-0312 Blue Plastic 0,1 mm x 110 x 150 cm Kg A 58.46% 5 PLS-0195 Blueprint Plastic 0,14mm x 145 x 870 cm Kg A 58.46% 6 PLS-0199 Blueprint Plastic 0,10 mm x 140 x 160 cm Kg B 58.46% 7 PLS-0003 Plastic Bag SIR 20 SEUVK Kg B 58.46% 8 PLS-0001 Plastic Bag SIR 10 SEUR Kg B 38.55% 9 PLS-0223 Blank Plastic 0,1 x 140 x 160 cm Kg B 38.55% 10 PLS-0302 Blue Plastic 0,1 mm x 140 x 170 cm Kg C 38.55% 11 PLS-0297 Red Plastic 0,14 mm x 146 x 370 cm Kg C 38.55% 12 PLS-0296 Red Plastic 0,14 mm x 146 x 340 cm Kg C 38.55% 13 PLS-0077 Good Year Plastic SIR 20 SEUCVNIVCO Sheet C 27.69% 14 PLS-0230 Trapping Band Plastic SMPT Rol C 27.69% 15 PLS-0326 Sumtomom Plastic Sheet C 27.69% 16 PLS-0075 Good Year Plastic SIR 20 SEUNOVOLO Sheet C 27.69% 17 PLS-0225 White Blank Plastic 0,1 mm x 125 x 160 cm Kg C 27.69% 18 PLS-0099 SMPT Plastic C UG230SIR20 Sheet C 24.54% 19 PLS-0189 Blank Plastic SIR 20 SEU Sheet C 24.54% 20 PLS-0074 Good Year Plastic SIR 20 NOLO Sheet C 24.54% 21 PLS-0076 Good Year Plastic SIR 10 NIMBO Sheet C 24.54% 22 PLS-0202 Gyo Plastic SR 20 SEUCOOPER TIRE Sheet C 24.54% 23 PLS-0071 Bridgeston Plastic SIR 20 Sheet C 8.53%
326 N.T. Putri, Jonrinaldi, and Y.R. Risa Noviani
its mean that packing material turn over 10 times a year and inventory control for this packaging materials quite good compared with other types of packaging materials. Meanwhile, 20 types of packaging material has ITO value <1 and ITO value = 0 as Label Good Year 10 VK / Nevo Plastic, Pink Plastic 0.1 x 150 x 880 cm, etc. That is happened because packaging materials not changed in one year.
If ITO value of the existing inventory system compared with the proposed inventory system in Table 5.1, so ITO value of the existing inventory system is still not optimal or it can be concluded that inventory turnover is still relatively slow if it compared with the proposed inventory system has been considering with variations of lead time. Based on these conditions, the company should improve the existing inventory system and implement the proposed inventory system that can reduce average inventory of packaging materials in warehouses. So turnover of packaging materials can be faster than the previous inventory system.
4.3.2 Analysis ofPackagingMaterialRequirementsAggregation
Existing packaging material requirements planning is still not well arranged and has not been integrated with the demand of finished product, it still based on previous usage, so the risk of stock out or over stock becomes larger. To solve this problem, the company must plan for packaging material in 2014 so that the risks can be minimized.
Packaging material requirements planning is done based on production plan in 2014. The result of this packaging material requirements planning is aggregation of packaging materials. Packaging material requirements planning has been undertaken to consider the percentage of defects or damage of the packaging material during the production process or after production during for a year. Production planning of packaging material in 2014 use for another step for evaluation and give recommendations inventory system for this company.
4.3.3 Analysis ofABCClassificationPackagingMaterials
Condition of packaging material inventory systems in PT Djambi Waras Jujuhan still not grouping and ordering process in the company is done if inventory of packaging material has reached the minimum stock. So, if there are several types of packaging material has reached the minimum stock of packaging materials will be immediately ordered to suppliers. In this research, packaging materials will be grouped into three classes using the ABC analysis.
Data packaging materials in that company amounted to 38 types. But just only 24 types are used and classify by ABC Analysis because only 24 types of packaging material that has required in the year 2014. Packaging materials are not grouped into packaging material requirements planning in 2014, the inventory system is specific policy based on historical data of the company.
An Inventory System of Packaging Materials: Case Study at PT. Djambi Waras Jujuhan 327
The high demand value of packaging material is influenced by price per unit and the number of demand for a year. If price and amount of usage per year increase, so packaging material can classify into A class. And if one of two factors that mentioned before is low, so possibility of the packaging material can classify into B or C class. The situation also happened of packaging material in PT Djambi Waras Jujuhan. For example, Plastic Bag SIR 10 SEU has a high price but low annual usage for a year, so this type classify into C class.
The results of ABC classification will be using for packaging material inventory system in PT Djambi Waras Jujuhan in 2014. A class of packaging materials should be given the main focus in the Materials Storage and Purchasing Division. Although B and C class are focus of attention quite normal and enough, but for certain types of packaging material still needs to be given more attention than the other types that are same class because there is a packaging material that has a rapid rate of usage in the class. The results of ABC classification is also used as the basis for ordering process the packaging material to suppliers.
4.3.4 Analysis of Optimal Order Quantity (Q*) Order Interval (T*) of PackagingMaterialsby UsingJointReplenishmentModels
Order interval for every group is different. The differences happened are because of the influence from purchasing cost, ordering cost, fraction of holding cost and requirement of packaging material. The higher of demand and purchasing cost, so order interval will be smaller. This means that company is increasingly often an order to the supplier. For example, the actual order interval C order 1 that is 59 days so actual order frequency is 11 times not 10.95 times as the result of the calculation. This is done so that demand can be met during the year.
Thus, in the decision-making process should consider order interval and order frequency so that a more optimal decisions compared just only one factor to consider. For example, when a decision is taken only consider order interval there was a risk that order made by the optimal quantity will exceed demand for a year, and it will increase order and holding cost. This problem happens if packaging materials has great demand. Optimal order quantity (Q *) is different for every item in the group, depending on the needs of the packaging materials and purchasing cost. Q * will be greater if demand is high and purchasing cost of packaging materials is low. Conversely, if purchasing cost of packaging materials is high so Q * will become smaller. Recommended for the proposed system, the company would choose the actual order frequency because the company only adds one order.
328 N.T. Putri, Jonrinaldi, and Y.R. Risa Noviani
Safety stock provided by the company is still greater when compared with the results of calculations performed, but this time the SS policy is much better than the company's policy before the month of October 2013 as the SS set is much larger than the current inventory system. Reorder Point (B) packaging materials are obtained from calculations carried out amounted to two times of the safety stock is obtained. This occurs because the service level that is 99% larger.
4.3.6 Analysis of Current and Proposed InventorySystem
Calculation of total inventory cost for the the existing and the proposed inventory system 2013 was conducted to determine the proposed inventory system is feasible to be implemented or not. The proposed inventory system that given was feasible to implement because: a) it can save total inventory costs up to 78.46% or Rp.320.728.188,- from total inventory cost of the existing inventory system, b) ordering costs of the proposed inventory system is greater than the existing inventory system because ordering frecuency more often done by considering the optimal quantity of packaging material, purchasing of packaging materials, ordering costs holding costs, c) holding costs of the proposed inventory system is smaller than the existing inventory system because average inventory and safety stock packaging materials is smaller than the existing inventory system. In the existing inventory system, average inventory and safety stock is higher when it compared with the the proposed system, its meaning that company save many packaging materials that resulted turnover of stock to be slow.
4.3.7 Sensitivity Analysis for Ordering Cost of Packaging Materials
Based on result from calculation, it showed that condition 1 when ordering costs increased up to 30%, so total inventory costs increased up to 14.56%. Meanwhile, the condition 2 ordering costs increased up to 50% so the total inventory cost increased up to 22.72%. It can be concluded that the response given the optimal solution or the total inventory costs if ordering costs chaged so total inventory costs chages less than increase of ordering costs, this can be interpreted that propose or recommendations inventory system feasible to implement in the company. In addition, if ordering costs increase so order interval and order quantity will be increasing too. That mean, time period between the previous order to the next order increases because ordering quantity increase or it can be said ordering frequency reduced for a year.
5
Conclusions and Suggestions
5.1 Conclusions
Conclusions derived from this research include the following:
An Inventory System of Packaging Materials: Case Study at PT. Djambi Waras Jujuhan 329
the the proposed inventory system of order class AB has a value of ITO = 58.46 x turn of the year, order class BC has a value of ITO = 38.55 x turn of the year, order class C 1 has a value of ITO = 27.69 x turn of the year, order class C 2 has a value of ITO = 24.54 x turn of the year, and order class C 3 has a value of ITO = 8.53 x turn of the year. This happens because the company has an average inventory and safety stock is high. Solution for this problem is the company can reduce the average inventory in the warehouse so risk of damage or change the size specifications of packaging materials can be minimized.
2. Proposal or recommendation packaging materials inventory systems will give for the the existing inventory system, are:
a. Planning or aggregation of packaging material needs for a year using a production plan that has been made by considering the percentage of defect packaging materials.
b. Grouping of packaging materials using ABC analysis based on rate of using criteria ordering process and the controlling.
c. Determination of the optimal order quantity (Q*), optimal order interval (T*), and frequency ordering (f) by using Joint Replenishment Method.
d. Determination of safety stock and reorder point of packaging materials by considering variations of lead time.
e. Calculate the total inventory costs during for a year.
5.2 Suggestions
Suggestions given to the company and further research are:
1. The company may implement the packing material inventory systems is the proposed that the the existing inventory system becomes more accurate and optimal.
2. Future research could design an application or information system for inventory planning of packaging materials, so that company can plan packaging materials inventory system for the next period to more easily and quickly and also can be used by stakeholders. In addition, data inventory or inventory reports more accessible.
3. Future research may develop or make a new model inventory system of packaging materials which more appropriate and more sensitive if one of the components inventory system in the company changes, so optimal solutions that result by the model more optimal.
330 N.T. Putri, Jonrinaldi, and Y.R. Risa Noviani
References
1. Assauri, S.: Production and Operations Management. Revised Edition 2008. Economic Faculty of Indonesia University, Jakarta (2008)
2. Bowersox, D.J.: Logistics Management. Systems Integration - Management Physical Distribution Systems and Materials Management, vol. 1. Bumi Aksara, Jakarta (2002) 3. Daellenbach, H.G.: Systems and Decision Making: A Management Science Approach. John
Wiley & Sons Ltd., England (1995)
4. Fogarty, et al.: Production and Inventory Management, 2nd edn. South - Western Publishing Co., Ohio (1991)
5. Gaspers, V.: Production Planning and Inventory Control: Based Integrated Systems Approach Towards MRP II and JIT Manufacturing 21. PT Gramedia Pustaka Utama, Jakarta (1998)
6. Isaac, A.: Operation Manajemen, 1st edn. Graha Ilmu, Yogyakarta (2010)
7. Walpole, R.E., Myers, R.H.: Probability & Statistics for Engineers and Scientists, 4th edn. Bandung Institute of Technology, Bandung (1995)
3/1/2017 Lecture Notes in Electrical Engineering
http://www.scimagojr.com/journalsearch.php?q=19700186822&tip=sid&clean=0 1/3
Scimago Journal & Country Rank
Home Journal Rankings Country Rankings Viz Tools Help About Us
Lecture Notes in Electrical Engineering
Enter Journal Title, ISSN or Publisher Name
Quartiles
The set of journals have been ranked according to their SJR and divided into four equal groups, four quartiles. Q1 (green) comprises the quarter of the journals with the highest values, Q2 (yellow) the second highest values, Q3 (orange) the third highest values and Q4 (red) the lowest values.
Category Year Quartile
Industrial and Manufacturing Engineering 2008 Q4
Industrial and Manufacturing Engineering 2009 Q3
Industrial and Manufacturing Engineering 2010 Q3
Industrial and Manufacturing Engineering 2011 Q3
SJR
The SJR is a size-independent prestige indicator that ranks journals by their 'average prestige per article'. It is based on the idea that 'all citations are not created equal'. SJR is a measure of scienti c in uence of journals that accounts for both the number of citations received by a journal and the importance or prestige of the journals where such citations come from It measures the scienti c in uence of the average article in a journal, it expresses how central to the global
Citations per document
This indicator counts the number of citations received by documents from a journal and divides them by the total number of documents published in that journal. The chart shows the evolution of the average number of times documents published in a journal in the past two, three and four years have been cited in the current year. The two years line is equivalent to journal impact factor
™ (Thomson Reuters) metric.
Cites per document Year Value
Cites / Doc. (4 years) 2008 0.023
Cites / Doc. (4 years) 2009 0.119
Cites / Doc. (4 years) 2010 0.098
Cites / Doc. (4 years) 2011 0.144
Cites / Doc. (4 years) 2012 0.107
Cites / Doc. (4 years) 2013 0.099
Cites / Doc. (4 years) 2014 0.078
Cites / Doc. (4 years) 2015 0.055
Cites / Doc. (3 years) 2008 0.023
Total Cites Self-Cites
Evolution of the total number of citations and journal's self-citations received by a journal's published
documents during the three previous years.
Journal Self-citation is de ned as the number of citation from a journal citing article to articles published by the same journal.
2008 2009 2010 2011 2012 2013 2014 2015
Industrial and Manufacturing Engineering
2008 2009 2010 2011 2012 2013 2014 2015 0.1
3/1/2017 Lecture Notes in Electrical Engineering
http://www.scimagojr.com/journalsearch.php?q=19700186822&tip=sid&clean=0 2/3
Developed by:
Powered by:
Follow us on
Scimago Lab
, Copyright 2007-2016. Data Source:
Scopus®
Cites / Doc. (3 years) 2009 0.119
Cites Year Value
External Cites per Doc Cites per Doc
Evolution of the number of total citation per document and external citation per document (i.e. journal self-citations removed) received by a journal's published documents during the three previous years. External citations are calculated by subtracting the number of self-citations from the total number of citations received by the journal’s documents.
Cites Year Value
% International Collaboration
International Collaboration accounts for the articles that have been produced by researchers from several countries. The chart shows the ratio of a journal's documents signed by researchers from more than one country; that is including more than one country address.
Year International Collaboration
2008 9.44
Citable documents Non-citable documents
Not every article in a journal is considered primary research and therefore "citable", this chart shows the ratio of a journal's articles including substantial research (research articles, conference papers and reviews) in three year windows vs. those documents other than research articles, reviews and conference papers.
Documents Year Value
Cited documents Uncited documents
Ratio of a journal's items, grouped in three years windows, that have been cited at least once vs. those not cited during the following year.
Documents Year Value
<a href="http://www.scimagojr.com/journalsearch.php?q=19700186822&tip=sid&exact=no" title="SCImago Journal & Country Rank"><img border="0" src="http://www.scimagojr.com/journal_img.php?id=19700186822" alt="SCImago Journal & Country Rank" /></a>
2008 2009 2010 2011 2012 2013 2014 2015 0
0.07 0.14 0.21
2008 2009 2010 2011 2012 2013 2014 2015 3
6 9 12
2008 2009 2010 2011 2012 2013 2014 2015 0
9k 18k
2008 2009 2010 2011 2012 2013 2014 2015 0
3/1/2017 Scopus preview - Scopus - Lecture Notes in Electrical Engineering
https://www.scopus.com/sourceid/19700186822?origin=sbrowse 1/2
(/home.uri?zone=TopNavBar&origin=sourceinfo)
Source details
Feedback (https://help.elsevier.com/app/ask_scopus/p/8150) Compare sourcesLecture Notes in Electrical Engineering
Set document alert
Scopus coverage years: from 2007 to 2016 Publisher: Springer Verlag
ISSN: 1876-1100 E-ISSN: 1876-1119
Subject area: Engineering: Industrial and Manufacturing Engineering
Visit Scopus Journal Metrics
CiteScore CiteScore rank & trend Scopus content coverage
Calculated on 31 May, 2016
*CiteScore includes all available document types View CiteScore
Percentile: 24th Rank: #221/295
CiteScoreTracker 2016
Last updated on 07 February, 20170.07
=Citation Count 2016
Documents 2013 - 2015 =
920 Citations to date
13460 Documents to date
Metrics displaying this icon are compiled according to Snowball Metrics ↗ (http://www.snowballmetrics.com/), a collaboration between industry and academia.
Updated monthly
Terms and conditions (https://www.elsevier.com/locate/termsandconditions) Privacy policy (https://www.elsevier.com/locate/privacypolicy) Copyright © 2017 Elsevier B.V (https://www.elsevier.com). All rights reserved. Scopus® is a registered trademark of Elsevier B.V.
Cookies are set by this site. To decline them or learn more, visit our Cookies page (https://help.elsevier.com/app/answers/detail/a_id/ 2964 /p/8150/).
3/1/2017 Scopus preview - Scopus - Author details (Putri, Nilda Tri)
https://www.scopus.com/authid/detail.uri?authorId=53864158100 1/2
The Scopus Author Identifier assigns a unique number to groups of documents written by the same author via an algorithm that matches authorship based on a certain criteria. If a document cannot be confidently matched with an author identifier, it is grouped separately. In this case, you may see more than 1 entry for the same author.
Author details
Putri, Nilda Tri
Universitas Andalas, Department of Industrial Engineering, Padang, Indonesia
Author ID: 53864158100
Other name formats: Putri, N. T.
About Scopus Author Identifier | View potential author matches
Co-authors: Follow this Author Receive emails w hen this author publishes new articles
Get citation alerts
Lecture Notes in Electrical Engineering
IEEE International Conference on Industrial Engineering and Engineering Management
IOP Conference Series: Materials Science and Engineering
View More
Show Related Affiliations Print | E-mail
10
0 total citations by 0 document
17
Business, Management and Accounting , Engineering View More
10
documentsExport all | Add all to list | Set document alert | Set document feed
10 Documents | 17 co-authors
View in search results format Sort on:Date Cited by ...
Redesign of thresher machine for farmers using rapid
upper limb assessment (RULA) method Putri, N.T.,Susanti, L.,Tito, A.,Sutanto, A. 2016 IEEE InternationalConference on Industrial Engineering and Engineering Management
Show abstract | Related documents
The role of an organizational culture and individual towards knowledge management practice in cement industry
Putri, N.T.,Kurnia, S. 2016 2016 IEEE International
Conference on Management of Innovation and Technology, ICMIT 2016
Show abstract | Related documents
Comparison of Quality Engineering Practices in Malaysian and Indonesian Automotive Related Companies
Putri, N.T., Sha'Ri Mohd, Y., Irianto, D.
2016 IOP Conference Series: Materials Science and Engineering
Show abstract | Related documents
Design of quality system documentation in hydrotiller production unit as improvement of quality management system in small and medium enterprise
Putri, N.T.,Retha, F.,
Yusof, S.M. 2016 International Journal ofProductivity and Quality Management
Show abstract | Related documents
Facility layout design on the agricultural machinery
industry Putri, N.T.,Fithri, P.,Taufik, M. 2015 Lecture Notes inEngineering and Computer Science
Show abstract | Related documents
An inventory system of packaging materials: Case study
at PT. Djambi Waras Jujuhan Putri, N.T.,Jonrinaldi,Risa Noviani, Y.R. 2015 Lecture Notes inElectrical Engineering
Show abstract | Related documents
The effect of TQM implementation towards productivity of employees using Structural Equation Modeling (SEM) analysis method in PT XYZ
Putri, N.T.,Darma, H.S. 2014 ICMIT 2014 - 2014 IEEE
The Delphi hierarchy process-based study of quality engineering in Malaysia and Indonesia automotive companies
Strategic road performance model: An approach to
sustainable facilities management Kamil, I.,Alias, B.,Mohammed, A.H., Putri, N.T.,Meilani, D.
2014 Jurnal Teknologi
Show abstract | Related documents