Leveraging LSTM for rapid intensifications prediction of tropical cyclones
Yun Li 1*, Ruixin Yang 1, Chaowei Yang 1, Manzhu Yu1, Fei Hu1, Yongyao Jiang1
1Department of Geography & Geoinformation Science, George Mason University, 4400 University Drive, Fairfax, VA - (yli38, ryang, cyang3, myu7, fhu, yjiang8)@gmu.edu
KEY WORDS: rapid intensification prediction, tropical cyclones, LSTM, deep learning, class imbalanced problem
ABSTRACT:
Tropical cyclones (TCs) usually cause severe damages and destructions. TC intensity forecasting helps people prepare for the extreme weather and could save lives and properties. Rapid Intensifications (RI) of TCs are the major error sources of TC intensity forecasting. A large number of factors, such as sea surface temperature and wind shear, affect the RI processes of TCs. Quite a lot of work have been done to identify the combination of conditions most favorable to RI. In this study, deep learning method is utilized to combine conditions for RI prediction of TCs. Experiments show that the long short-term memory (LSTM) network provides the ability to leverage past conditions to predict TC rapid intensifications.
1. INTRODUCATION
Tropical cyclones (TCs), as one of the most dangerous natural disasters, threaten life and health of human beings and cause enormous economic loss. If the TC intensity can be predicted accurately, the potential damage caused by these storms can be significantly reduced. However, TC intensity forecasting, especially rapid intensification (RI), remains a challenge (DeMaria 1996, Rappaport et al. 2009, Yang 2016) because multiple factors control TC intensify changes. As defined, TC intensity is measured by the maximum wind. A TC undergoes RI if its intensity has increased at least 30 knots (15.4 m/s) over the past 24 hours (Kaplan and DeMaria 2003). A lot of studies have been conducted to learn factors favorable to TC rapid intensifications (DeMaria, Knaff and Sampson 2007).Those factors include but not limited to warm ocean eddies (Hong et al. 2000), the contraction of an outer eyewall (Lee and Bell 2007), an environment with low vertical shear (Frank and Ritchie 2001) interactions between the upper-level trough and a TC (DeMaria 1996).
Traditional statistical analysis methods usually focus on only one type of factors to find the relationship between TC intensity changes and the selected factors. Those factors fall into three main categories: ocean characteristics, inner-core processes, and environmental interactions (Yang, Tang and Kafatos 2007). Holliday and Thompson (Holliday and Thompson 1979) found that a deep layer of warm water, the development at night time, and a small eye size were favorable for northwest Pacific RI typhoons. This kind of method is know
-to-community to discover hidden relationships in vast amount of data. Yang et al. (Yang et al. 2007) leveraged the associations rule technique to automatically examine all possible combinations of frequent condition set to detect multiple conditions that may lead to RI. For example, for the whole Atlantic hurricanes across 1980 to 2003, Yang et al. (2007) discovered a combination related to high RIP is (LAT = H, LON = L, PD12 = H, POT = H, PSLV = H, REFC = L). However, to apply association rule to analysis intensity change, TC parameter values should be converted from real number to
binary ranges at first. Much information is lost during this process that the mined results can only illuminate TC intensity changes but cannot be directly used for TC intensity prediction.
As one of the most useful data mining techniques, neural network has been significantly improved in recent years. Deep learning (LeCun, Bengio and Hinton 2015), also known as deep structured learning, is proposed to improve performance of neural network and has been widely used in multiple research areas, such as image processing and object detection. Different network architectures are designed to address certain kind of problem, in which Long-Short Term-Memory (LSTM) model can predict value based on history information (Hochreiter and Schmidhuber 1997). The LSTM model inspires us to do a research that predict TC intensity changes based on parameters values of past hours. The goal of this study is to use the LSTM network to explore multiple geophysical characteristics that are associated with rapidly intensifying TCs.
The outline of this paper is as follows. In section 2, the datasets for this study and the LSTM model are introduced. Section 3 discusses data preprocessing method and strategies to overcome the imbalanced data problem. Section 4 describes the experiments of studies of rapid intensification. Section 5 discusses the potential improvement of the learning result for TC intensity change.
2. DATA AND METHOD
2.1 Data set
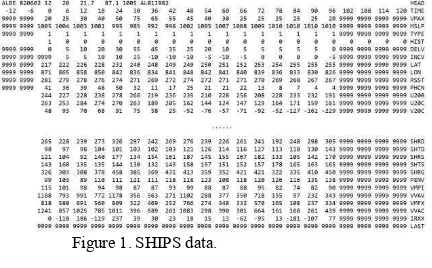
SHIPS (DeMaria and Kaplan 1994) database is chosen for this study as it contains most well-known environmental predictors relevant to TC intensity changes, such as Reynolds SST (sea surface temperature), SLP (sea level pressure). These predictor values are from reanalysis fields as well as satellite derived variable values and stored as a text file in ASCII format. TCs are listed in temporal sequences in the file and each TC consists of multiple lines that each line stores values of a certain parameter (variable, feature, or attribute) during the storm life span. 47 predictor values are recorded up to 120 hours from the initial time of storm at 6 hour intervals. Figure 1 shows part of records of Hurricane ALBE happened on July 02, 1982 in the text file. In our study, TCs happened during 1982 to 2013 are selected for study.
2.2 Long short-term memory network
Recurrent neural network (RNN) is a class of artificial neural network designed to process sequential input (Graves 2012). In a traditional neural network, all inputs are assumed independent of each other, but for some tasks, traditional neural network cannot make full use of valuable information. For example, to predict the next word in a sentence, multiple words come before it provides useful hints. To predict the number of passengers of an airport in the following months, passenger information in the past months are good references. RNN is designed to address such problems. It is called recurrent because the same function is performed on every element in the sequential input. RNNs are supposed to have memory as the networks capture all the information that has been calculated so far. In theory, RNNs can make use of all information in the sequence, but, in practice they are limited to looking back only a few steps because traditional RNNs are trained using Backpropagation Through Time (BPTT) which is simple but causes the vanishing gradient problem (Pascanu, Mikolov and Bengio 2013). The bad effect of vanishing gradient is that long memory cannot be utilized for prediction. The Long Short-Term Memory (LSTM) network (Schmidhuber 2015), as a special type of RNN, improved traditional RNN by introducing cell state to keep memory and overcome the vanishing gradient problem. Fundamentally, LSTM does not have different architecture from RNN, but it computes the hidden state with three types of gate, which are input gate, forget gate and update gate. Those gates work together to decide what to keep in and erase from memory.
nput
update layer creates an update to the cell state. It turns out that LSTM network are very efficient at utilizing long-term dependencies.
Figure 1. SHIPS data.
3. DATA PROCESSING
3.1 Convert TCs in SHIPS database to RI/Non-RI cases
As described in the data set part, each TC in the SHIPS database consists of multiple lines and each line records one environmental parameter or TC attribute during the life span of storm. In order to predict TC rapid intensity change, those lines should be converted to multiple records and each record contains environmental parameters and TC attributes in a time step. According to the definition of RI, if the maximum wind
Most previous studies worked on mining pattern from parameters at a time step for prediction. In order to leverage LSTM network to predict rapid intensifications based on predictors in several past time steps, SHIPS files should be further processed to TC intensity cases. A threshold T is predefined, and for each record of a TC, the record and its previous T time steps records are combined as a TC intensity case. If the selected record is a RI record, the TC intensity case is marked as RI, vice versa. Importantly, since some predictors values are missing in the SHIPS file, for each TC, those values should be interpolated using mean value.
3.2 Unbalanced data
After preprocessing, the number of RI cases are much less than that of UNRI cases. If these cases are used to train a classification model directly, take binary classification for example, a model fit the train data would assign all data to the majority class to achieve higher accuracy. The reason is that accuracy is measured by the number of cases with the accurate labels divided by the total number of cases. If the dataset is highly imbalanced, the accuracy would be higher if all cases are assigned to the majority class. However, in such case for the minority class, the accuracy would be zero. It is known as a class imbalanced problem (Li, Liu and Hu 2010). Nevertheless, detecting minority class plays an important role in most situations, such as fraud transaction detection, crawler detection and RI prediction in our study.
A lot of methods has been proposed to solve the imbalanced class problem (He and Garcia 2009). They fall into two main approaches, including data-based approaches and model-fit approaches. In Data-based approaches, either majority train data can be undersampled or minority data can be oversampled (Ganganwar 2012). Undersampling means reducing majority class in the train data. It works well when a large amount of train data is available, or it causes the learner missing valuable information. In our study, we only have 9401 UNRI cases and 462 RI cases in total, it is unsuitable to apply undersampling to balance train data. Oppositely, oversampling works by enlarging minority class in the train data but it increases the risk of overfitting. Multiple methods have been proposed to solve the imbalanced problem. One of them is EasyEnsemble, in which the majority class are independently sampled to generate several subsets and then these subsets are combined with all the minority class data to train multiple classifier for classification.
Model fitting approaches modify component in the learning algorithm to overcome the bad effect of imbalanced data (Ganganwar 2012). For example, loss function calculates the difference between predicted value and the true value. The more difference between predict value and true value, the more loss caused by the trained model. Loss function is used to adjust parameter weighs to improve the accuracy or other metric. One method is applying class-specific weights in the loss function, that is assigning larger weight to the minority class. Binary classification can also be changed to a one class classifier problem, learning the boundary for one class and treating the other class as outliers. In our case, RI cases can be viewed as outliers.
4. EXPERIMENTS 4.1 Workflow and Metrics
In the data preparation step, the original 1982-2013 SHIPS data records 169 TCs in total. Missing parameter values are complemented by the open source software ski-learn. Then those TCs are converted to 462 RI and 9401 UNRI cases, 70% of which are chosen as train data and the left are test data. The deep learning library Keras (https://github.com/fchollet/keras) is used to train a LSTM network to predict RI.
To evaluate the performance of trained model, in addition to accuracy, two custom metrics, POD (Probability Of Detection) and FAR (False Alarm Ratio), are introduced to compare the predict values and true values. These two metrics are widely used in atmosphere science and the definitions by Wilks (Wilks 1995) are as follows:
POD: the ratio of warned events to total events.
FAR: the ratio of warnings without an event to total warnings
Accuracy is the difference between predicted values and true values. It gives a general idea about learner performance. The range of POD and FAR is 0 to 1, the larger POD is, the better a learner is. The larger FAR is, the worse a learn is.
Table 1 lists four outcomes for evaluating learner performance. The combination of them can be used to calculate accuracy, POD and FAR shown in following equations.
True
Perdition RI UNRI
RI True Positive
(TP) False Positive (FP) UNRI False Negative
(FN) True (TN) Negative Table 1. Confusion matrix.
(1)
(2)
(3)
4.2 Learn from imbalanced data
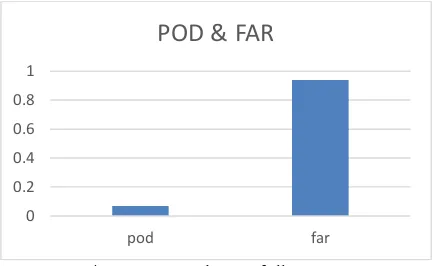
In this experiment, train data are directly learned by the LSTM model without assigning different weights to RI and UNRI class. Figures 2 and 3 shows the evaluation result of test data. The accuracy of total cases is higher than 0.95. However, all the RI cases are classified as UNRI class. POD is 0 since none of RI cases are predicted accurately by the model. It seems good that far is zero, but besides FP is equal to 0, TP is also 0.
Figure 2. Accuracy of all cases and RI cases.
Figure 3. POD and FAR of all cases.
4.3 Assign different class weights to RI/UNRI class
The network structure is same as that created in experiment 1. The only difference is that the imbalanced data problem is token into account in this model. The class weights of UNRI and RI are set to 1 and 20.37 separately according to the number of RI cases in the train data. Although accuracy of total cases decrease, the accuracy of RI cases is significantly improved (Figure 4). However, POD value (0.07) is too small and FAR value (0.94) is too large since many UNRI cases are predicted as RI class in the learned model (Figure 5).
Figure 4. Accuracy of all cases and RI cases.
0
0.2 0.4 0.6 0.8 1
Total RI
Accuracy
0 0.2 0.4 0.6 0.8 1
pod far
POD & FAR
0 0.2 0.4 0.6 0.8 1
Total RI
Figure 5. POD and FAR of all cases.
4.4 Adjust class weights of RI/UNRI class
Based on the initial class weights set in experiment 1 and 2, the weight of UNRI class is set to 1 and RI class weight is adjusted from 1 to 29. As the increase of RI weight, total accuracy decreases from 1 to nearly 0.5, but the accuracy of RI prediction increase from 0 to almost 1. Furthermore, FAR increases significantly as POD increases. Although most RI event can be predicted but quite a large number of RI warning are wrong. From figure 6 and 7, when RI class weight is set to 11, there is a trad-off between accuracy, FAR and POD. However, the FAR is also relatively too large to meet the goal set by NOAA (Gall et al. 2013).
Figure 6. Accuracy of all cases and RI cases.
Figure 7. POD and FAR of all cases.
the result is not good as expected, the result could provide guidance for TC intensity forecasting research using deep learning. In our study, different class weights are assigned to RI/ UNRI cases to optimize the loss function. The loss function can be further improved by introducing different misclassification weights. Another potential improvement on this work is to use SMOTE (He and Garcia 2009) to resample train data to solve the imbalance data problem. In addition, some environmental parameters and TC attributes should be filtered out to avoid overfit problem.
REFERENCES
DeMaria, M., 1996. The effect of vertical shear on tropical cyclone intensity change. Journal of the atmospheric sciences, 53, 2076-2088.
DeMaria, M. & J. Kaplan, 1994. A statistical hurricane intensity prediction scheme (SHIPS) for the Atlantic basin. Weather and Forecasting, 9, 209-220.
DeMaria, M., J. Knaff & C. Sampson, 2007. Evaluation of long-term trends in tropical cyclone intensity forecasts. Meteorology and Atmospheric Physics, 97, 19.
Frank, W. M. & E. A. Ritchie, 2001. Effects of vertical wind shear on the intensity and structure of numerically simulated hurricanes.
Monthly weather review, 129, 2249-2269.
Gall, R., J. Franklin, F. Marks, E. N. Rappaport & F. Toepfer, 2013. The hurricane forecast improvement project. Bulletin of the American Meteorological Society, 94, 329-343.
Ganganwar, V., 2012. An overview of classification algorithms for imbalanced datasets. International Journal of Emerging Technology and Advanced Engineering, 2, 42-47.
Graves, A., 2012. Supervised sequence labelling with recurrent neural networks. Springer.
He, H. & E. A. Garcia, 2009. Learning from imbalanced data. IEEE Transactions on knowledge and data engineering, 21, 1263-1284. Hochreiter, S. & J. Schmidhuber, 1997. Long short-term memory.
Neural computation, 9, 1735-1780.
Holliday, C. R. & A. H. Thompson, 1979. Climatological characteristics of rapidly intensifying typhoons. Monthly Weather Review, 107, 1022-1034.
Hong, X., S. W. Chang, S. Raman, L. K. Shay & R. Hodur, 2000. The interaction between Hurricane Opal (1995) and a warm core ring in the Gulf of Mexico. Monthly Weather Review, 128, 1347-1365.
Kaplan, J. & M. DeMaria, 2003. Large-scale characteristics of rapidly intensifying tropical cyclones in the North Atlantic basin.
Weather and forecasting, 18, 1093-1108.
LeCun, Y., Y. Bengio & G. Hinton, 2015. Deep learning. Nature, 521, 436-444.
Lee, W. C. & M. M. Bell, 2007. Rapid intensification, eyewall 0
0.2 0.4 0.6 0.8 1
pod far
POD & FAR
0 0.5 1 1.5
1 3 5 7 9 11 13 15 17 19 21 23 25 27 29
Accuracy
Total RI
0 0.5 1
1 3 5 7 9 11 13 15 17 19 21 23 25 27 29
POD & FAR
Li, D.-C., C.-W. Liu & S. C. Hu, 2010. A learning method for the class imbalance problem with medical data sets. Computers in biology and medicine, 40, 509-518.
Pascanu, R., T. Mikolov & Y. Bengio, 2013. On the difficulty of training recurrent neural networks. In International Conference on Machine Learning, 1310-1318.
Rappaport, E. N., J. L. Franklin, L. A. Avila, S. R. Baig, J. L. Beven, E. S. Blake, C. A. Burr, J.-G. Jiing, C. A. Juckins & R. D. Knabb, 2009. Advances and challenges at the National Hurricane Center. Weather and Forecasting, 24, 395-419.
Schmidhuber, J., 2015. Deep learning in neural networks: An overview. Neural networks, 61, 85-117.
Wilks, D. S., 1995. Statistical methods in the atmospheric sciences: An introduction. Academic Press.
Yang, R., 2016. A Systematic Classification Investigation of Rapid Intensification of Atlantic Tropical Cyclones with the SHIPS Database. Weather and Forecasting, 31, 495-513. Yang, R., J. Tang & M. Kafatos, 2007. Improved associated conditions in rapid intensifications of tropical cyclones.