A Thesis for the Degree of Ph.D. in Engineering
Design and Fabrication of a Tooth-Inspired Tactile
Sensor for the Detection of Multidirectional Force
February 2019
Graduate School of Science and Technology
Keio University
i
ABSTRACT
Demands on tactile sensors have been increasing rapidly. When they are thin and flexible, they can be attached to arbitrary surfaces and contribute to enhance precision in monitoring and handling objects. A capacitive-type tactile sensor with liquid dielectric is proposed to achieve both high accuracy and flexibility. There also are demands for tactile sensors that can detect multidirectional load in a narrow space. For such applications, the tactile sensors cannot have shapes of a sheet or a pad as reported in many of the previous work. Thus, in this thesis, a tactile sensor that has a three-dimensional format and can detect multi-directional force is designed and demonstrated, which is inspired by the anatomy of a tooth.
Chapter 1 summarizes background of the research. Tactile sensors are thoroughly surveyed, among which the highly accurate and flexible tactile sensor is detailed. The objective of this work is explicitly described.
Chapter 2 illustrates the design strategy of the sensor device. The inspiration of the design of the sensor, which is a tooth, is discussed.
Chapter 3 explains the design of the sensor device. The sensor consisted of a center pole that acts like a tooth, which can sense the direction of light touch or pressure applied on its enamel. The bottom of the center pole is equipped with four strain gauges, whose resistances change according to the movement of the center pole.
Chapter 4 illustrates the fabrication and assembly processes of the sensor device. The center pole is made of stainless-steel and is plugged into an acrylic base, just like a tooth that is plugged in the alveolar bone. The assembly process allows the sensor to have the strain gauges in a three-dimensional manner, which support the pole and detect the shear force applied to the pole.
Chapter 5 describes the experimental results. The sensitivity of the sensor device per unit 1 mm displacement is deduced to be -0.016 mm-1, while sensitivity per unit 1 N load is
-0.313 N-1. The sensor is verified to be capable of detecting the magnitude and direction of the
multidirectional load.
ii
ACKNOWLEDGEMENT
First, I must give my high, respectful gratitude to my supervisor, Prof. Dr. Norihisa Miki for his guidance, supervision and help throughout this project. I have learned a lot throughout my seven years in Miki Laboratory, with many challenging yet valuable experiences in order to complete this task.
I would like to thank the members of Miki Laboratory from 2011 to 2017, for their guidance and support in fabricating the device for this project, in writing thesis and journals, in assisting me in my studies and improving my Japanese language skills, as well as in conducting my daily life in Japan. I also should like to express my gratitude to Ms. Iza Husna for her help and guidance in designing the measurement systems for my project. My deepest appreciation also goes to Assoc. Prof. Dr. Kenjiro Takemura, Assoc. Prof. Dr. Hiroaki Onoe, and Assist. Prof. Dr. Takeo Kato for their guidance in writing this dissertation. I am indebted to Mr. Akira Kikuzumi for his advice and support during the toughest time in my life. It has been great to know all of them during my time in Keio University.
I would like to express my eternal appreciation towards my parents, Mr. Ahmad Ridzuan and Mrs. Rusidah, and all my family members who have always been there for me no matter where I am and what condition I am in, for all their prayers, unconditional love, supports and patience. I am also indebted to my dear husband, Mr. Muhammad Hisyam for his beautiful heart and kind words, and for always being by my side lending ears and shoulders. I wish to thank all of them for being ever so understanding, tolerant and supportive.
Not to forget, I should like to acknowledge my very real debt to my sponsor, MARA Education Foundation (Yayasan Pelajaran MARA, YPM) of Malaysia for choosing me to receive the scholarship for Malaysia Japan Higher Education Program (MJHEP) for three years of my PhD studies. I would also like to thank Keio Leading-Edge Laboratory (KLL) of Science and Technology for providing three years of research grants, and Keio University for Research Encouragement Scholarship (研究のすゝめ奨学金) that I received during my third year of PhD studies. Finally, thanks to those involved in this project directly or indirectly. May their lives be showered with a lot of blessings.
Nurul Adni Binti Ahmad Ridzuan Feb. 2019, Kusatsu, Shiga, JAPAN
iii
For my parents,
Mr. Ahmad Ridzuan Mohd Noor &
iv
TABLE OF CONTENTS
ABSTRACT ... i
ACKNOWLEDGEMENT ... ii
TABLE OF CONTENTS ... iv
LIST OF TABLES ... viii
LIST OF FIGURES ... ix
CHAPTER 1 INTRODUCTION ... 1
1.1 Tactile Sensors ... 1
1.1.1 Functions of Tactile Sensors ... 2
1.1.2 Detection Mechanisms ... 4
1.2 Bio-inspired Tactile Sensors ... 16
1.2.1 Anatomy of the Skin ... 16
1.2.2 Skin-inspired Tactile Sensors ... 19
1.3 Objective of Study ... 33
1.4 Overview of Thesis ... 34
CHAPTER 2 DESIGN STRATEGY ... 36
v
2.1.1 Anatomy of a Tooth ... 36
2.1.2 Movement and Pressure Sensing ... 38
2.2 Design Concept of the Sensor Device ... 39
2.3 Size and Limitations ... 40
CHAPTER 3 DESIGN ... 44
3.1 Choosing the Best Mechanism ... 44
3.1.1 Requirement for the Proposed Device ... 44
3.1.2 Capacitive Sensor Array with Liquid as Dielectric ... 46
3.1.3 Nanocomposite Piezoresistive Sensor ... 47
3.1.4 Copper Strain Gauge Piezoresistive Sensor ... 53
3.2 Design Improvement ... 57
3.2.1 Design ... 57
3.2.2 Material ... 59
3.2.3 Principle of the device ... 60
CHAPTER 4 FABRICATION PROCESS ... 63
4.1 Fabrication Process of Each Component of the Sensor Device ... 63
vi
4.1.2 Pole ... 63
4.1.3 Strain Gauge ... 66
4.2 Assembly process ... 74
CHAPTER 5 EXPERIMENT RESULTS AND DISCUSSIONS ... 78
5.1 Result and discussion from the fabrication process ... 78
5.2 Measurement Systems ... 79
5.2.1 Pressure Application System ... 79
5.2.2 Resistance Measurement Systems ... 80
5.3 Sensitivity Test... 82
5.3.1 Experiment Method ... 82
5.3.2 Result and Discussions ... 83
5.4 Direction of Load ... 85
5.4.1 Experiment Method ... 85
5.4.2 Result and Discussions ... 86
5.5 Repeatability and Frequency Test ... 92
5.5.1 Experiment Method ... 92
vii CHAPTER 6 CONCLUSION ... 94 6.1 Conclusion ... 94 6.2 Future Prospect ... 98 REFERENCES ... 99 APPENDIX ... 112 PUBLICATIONS ... 117
viii
LIST OF TABLES
CHAPTER 1Table 1.1 Pros and cons of detection mechanisms of pressure tactile sensor ... 15
Table 1.2 Layers of the capacitive sensor device with their respective functions ... 22
CHAPTER 5
Table 5.1 Deflection angle of each strain gauge in a sensor device ... 79
CHAPTER 6
Table 6.1 Difference between previous devices and the latest one ... 96
APPENDIX
ix
LIST OF FIGURES
CHAPTER 1Figure 1.1 Cantilever type pressure sensor (a) with strain gauge attached at the top, and (b) the cantilever itself as strain gauge ... 5
Figure 1.2 Change of length of a material with applied stress ... 6
Figure 1.3Principle of composite type sensor, before and after pressure application. (a) shows composite with parallel electrodes, while (b) shows composite with one-sided electrodes ... 7
Figure 1.4 Principle of capacitive pressure sensor with change in the distance between two electrodes during pressure application ... 8
Figure 1.5 Principle of capacitive pressure sensor with change in the effective surface area during pressure application ... 9
Figure 1.6 Principle of magnetic sensor with Hall-effect sensor. Figure shows the sensor in the initial state (left) and shift of magnetic field during pressure application (right). ... 10
Figure 1.7 Principle of magnetic sensor with change in the distance between excitation coil and detection coil during pressure application. Change of distance between both coils will cause change in voltage generated by detection coil. ... 11
Figure 1.8 Principle of piezoelectric pressure sensing. Above is the piezoelectric material in initial condition, and below is the state during pressure application. ... 12
Figure 1.9Principle of optical sensor with light intensity modulation. Figure on the left shows the sensor in initial state, while figure on the right shows the sensor during pressure application. ... 13
Figure 1.10Mechanism of fiber Bragg grating, with the wavelength shift in strained fiber ... 14
Figure 1.11 Location of tactile receptors beneath the surface of the skin ... 17
x
Figure 1.13 Design of capacitive sensor device in exploded view showing each layer ... 21
Figure 1.14 The cross-sectional view of the capacitive sensor device (top) and flowing-out of liquid from spacer layer during pressure application on the device (bottom) ... 21
Figure 1.15 The design of the prior work of the capacitive sensor device with escape reservoir of the encapsulated liquid at the side of the liquid chamber ... 23
Figure 1.16 Fabrication process of PDMS layers using soft-lithography process ... 24
Figure 1.17 Fabrication process of the largely deformable PDMS layer ... 25
Figure 1.18Fabrication process of the electrodes using photolithography and copper etching process ... 26
Figure 1.19 The bonding process of (a) the bumps and top electrodes, (b) The largely deformable PDMS layer and the spacer layer, (c) the bottom layer and bottom electrodes, and (d) the layers in (b) and (c) ... 28
Figure 1.20 BiLT process ... 29
Figure 1.21 (a) The fabricated capacitive sensor device with liquid as dielectric, and (b) flexibility of the device ... 30
Figure 1.22 Result of the experiment on capacitive sensor device comparing the devices with DI water, glycerin, and air as the control sample. (a) Relationship between the deformation of top electrode and pressure applied to the device, and (b) relationship between capacitance difference and pressure applied to the device. ... 32
CHAPTER 2
Figure 2.1 Anatomy of a tooth ... 37
Figure 2.2 A tooth in (a) resting state and (b) during pressure application to its enamel. Periodontal ligaments in blue were in resting state, red in stretched state, and green in compression state. ... 38
xi
Figure 2.3 Principle of pressure tactile sensor inspired by the anatomy of a tooth, in (a) initial state, and (b) When pressure is applied to a side of the sensing pole, the sensing elements at the pressure side is compressed (jiggly red lines) and sensing element at the tension side is stressed (thin red line) ... 40
Figure 2.4 Limitation of displacement of sensing pole ... 42
CHAPTER 3
Figure 3.1 Top view showing the concept of the nanocomposite device, with (a) the initial state and when pressure is added to the side with electrode C, and (b) the initial state and pressure added to the side between electrodes B and C ... 49
Figure 3.2 Fabrication process of the piezoresistive sensor device with polymer nanocomposite ... 50
Figure 3.3 (a) Cross sectional illustration of the device and (b) the fabricated sensor device with nanocomposite elastomer ... 51
Figure 3.4 Result of the experiment shows the relationship between resistance change ratio
Dr/r0 of six pairs of electrodes and pressure added to the side of the device (a) to electrode C
and (b) between electrodes C and D ... 52
Figure 3.5 Pressure sensing concept for device with copper strain gauge. Red arrows show the deformation of copper strain gauges when pressure is applied to (a) the side with a strain gauge, and (b) the side in between two strain gauges ... 53
Figure 3.6 Photolithography process to fabricate the strain gauge for the sensor device . 54
Figure 3.7 (a) Top view and cross-sectional diagram of the device, and (b) the fabricated device with copper strain gauges ... 55
Figure 3.8 The result of the experiment to the sensor device with copper strain gauges, where pressure was added to the side of the device with strain gauges sequentially from SG 1, to SG 2, to SG 3, 100s each with 100s intervals ... 56
xii
Figure 3.10 Dimension of the proposed device ... 58
Figure 3.11 Pressure sensing concept of the device. (a) shows the device in initial state, while (b) shows the device during pressure application ... 61
CHAPTER 4 Figure 4.1Dimension (in mm) of the base of the device, top view (above) and side view (below) ... 64
Figure 4.2 The acrylic base ... 64
Figure 4.3Dimension (in mm) of the center pole of the device, top view (above) and side view (below) ... 65
Figure 4.4 The center pole ... 65
Figure 4.5 The strain gauge area around the center pole. Within the red dotted circle is the hole on the base of the device, and the green areas are the strain gauges areas. ... 67
Figure 4.6 Dimension of the strain gauge in mm ... 67
Figure 4.7 Electrode patterning process including etching process ... 68
Figure 4.8 Electrodes that had been patterned with copper etching process ... 68
Figure 4.9 Undercut and etch bias that cause by anisotropic etching process ... 69
Figure 4.10 Fabrication process of strain gauges ... 70
Figure 4.11 Polyimide mask for the solder pads of the strain gauges. The yellow area represents the polyimide mask, while the strain gauges are shown in grey. The polyimide mask exposed the solder pad parts of the strain gauge. ... 73
Figure 4.12 The fabricated strain gauges before lift-off process (left) and after lift-off process (right). The cracked area in the left figure is the area to be lifted off. ... 73
xiii
Figure 4.14 The acrylic pole aligner ... 76
Figure 4.15 The setting of center pole to the base using pole aligner ... 76
Figure 4.16 Strain gauges were separated by cutting the center in X shape. The red dotted line in the left figure shows the cutting line ... 77
Figure 4.17 The fabricated device ... 77
CHAPTER 5
Figure 5.1 The experiment setup shows the sensor device fixed vertically on a rotary stage near the jig of micro strength evaluation system MST-I ... 80
Figure 5.2 Four wire measurement circuit to measure the resistance of the strain gauges. The voltage of the100 W resistor and strain gauge were measured using data logger ... 81 Figure 5.3 (a) Top view of the sensor device. Blue arrow shows the direction of load applied to the center pole. (b) The initial state of the experiment setup, and (c) movement of the center pole during load application with 1 mm jig displacement ... 82
Figure 5.4 Results for the sensitivity of the sensor device, (a) resistance change ratio vs displacement of the center pole, and (b) resistance change ratio vs load applied to the side of center pole. The error bars represent the variance defined by maximum and minimum values from four tests. ... 84
Figure 5.5 The direction of rotation from the top view of the sensor device for the test of direction of load ... 85
Figure 5.6 Result for the test for direction of load. 0° is defined as the middle of SG 1 .. 87 Figure 5.7 The result of the test of direction of load replotted with 0° is defined as the opposite of each strain gauge ... 88
Figure 5.8 Relative resistance change ratio of (a) SG 1 to SG 2, (b) SG 2 to SG 3, (c) SG 3 to SG 4, and (d) SG 4 to SG 1 ... 90
xiv
Figure 5.9 The algorithm of obtaining direction of force from the values of resistance change ratios of each strain gauge ... 91
Figure 5.10 Result for repeatability test shows the constant amplitudes for different frequency of loading-unloading ... 93
APPENDIX
Figure A-1 Dimension of strain gauges (1) in mm (Tokyo Process Service Co., Ltd.) ... 112
Figure A-2 Dimension of strain gauges (2) in mm (Tokyo Process Service Co., Ltd.) ... 113
Figure B-1 Details and dimension of photomask for strain gauge patterning in mm (Tokyo Process Service Co., Ltd.) ... 114
Figure D-1Top view (top) and side view (bottom) of pole aligner with dimension in mm ... 116
1
1
INTRODUCTION
1.1 Tactile Sensors
The widespread usage of smartphones introduces tactile sensor to the public, initially to the professionals who used them as personal digital assistant (PDA) in 1990s [1], and finally now to even infants for their interactive learning and digital playgrounds. It is not something strange if we own at least a thing that is equipped with tactile sensor nowadays. Besides for touch screens and panels, tactile sensors were also used in other industries, such as robotics, automobiles, and medical industries.
This dissertation reports about design and fabrication process of a tactile sensor for multidirectional force detection. The tactile sensor ability to distinguish the direction of force is crucially needed especially in medical industries, where medical imaging modality is recently exploited widely. Usage of tactile sensor is important especially in surgery. Nowadays, minimally invasive surgery (MIS) procedure is more preferred compared to the conventional open surgery due to the simple procedure and less recovery time. Tactile sensor for multidirectional force detection can be installed in endoscope or catheter for more accurate operation process during MIS. Other than medical industries, this kind of tactile sensor is also demanded in robotics industries. Flat, flexible tactile sensor might be needed to be applied as
2
robot skin, but the joints and legs of small robots need small, non-flat tactile sensor to guide its movement. Inspired by the sensitivity of a tooth which can sense direction of load applied to it precisely, a tactile sensor was developed using strain gauges.
1.1.1 Functions of Tactile Sensors
Research about tactile sensors had been done from decades ago [2]–[6]. Tactile sensors are installed to a lot of equipment and appliances, e.g. in machines factories, in medical appliances, artificial skin, touch panels for entertainment, etc. Each application requires its own special needs, for example, touch panels require tactile sensor for a light touch, but for an elevator door to operate its safe operation to not sandwich people between the automatic door, the sensor must need something different from what has been installed in a touch panel. Below are several types of tactile sensor that had been developed [7]. A tactile sensor that had been developed might has only one function, but there are also sensors that were designed to measure more than one variables [8].
1) Pressure sensor
Pressure sensor was firstly recognized as touch sensor, where the sensor only detects whether the ‘touch’ exists or not, but later researchers started to develop sensors that can distinguish the ‘amount of touch’ – or we call it load or pressure in the measurable way – that was received by the transducers [7]. That is why tactile sensor is commonly referring to pressure sensor. Pressure tactile sensor are generally built to detect pressure from vertical normal direction, but recently research on 3-axis pressure detection are actively done [9]–[12]. There are several ways that can be used in detecting the amount of pressure such as electrical way and optical way. This topic will be discussed in the section 1.1.2.
2) Slip sensor
Slip sensor is the sensor that detects relative slip displacement and speed between objects and the sensor itself. Some sensors that were developed also detect the very first few
µm of slip just before the slip itself even happen. Slip perception is inevitable especially in developing robot’s hand [13], [14]. For example, in holding fragile objects such as eggshells and glass, pressure from hand has to be as small as possible to avoid cracking. But, the lack of
3
pressure in holding objects will make the objects slip from the grip. Installing slip sensor in robot’s hand will be one of the solutions for this problem.
3) Hardness perception sensor
Recently, research on hardness perception sensor has caught a lot of attention because of its demands to be applied in medical field [15]–[18]. Hardness perception sensor is a sensor that distinguish objects’ hardness and softness. In medical field, hardness discrimination is inevitable especially in distinguishing tissues’ properties. Researchers are developing sensors to measure hardness in several ways. For example, some sensors measure hardness and softness of an object by indentation, while some sensors are using vibrations to measure the change of frequency when the sensor is touched by the objects.
4) Texture perception sensor
Surface texture includes roughness and smoothness of an object. Texture perception sensors are usually developed to distinguish these characteristics of objects’ surface. Surface texture perception sensor are widely used in designing robot finger and artificial skin. Texture perception usually measured statically, i.e. by indentation, or dynamically, where tactile perception sensor is slid along the surface of an object, and the frequency difference are measured and analyzed to distinguish the roughness or softness of the object’s surface[19]– [21].
5) Thermal sensor
Thermal perception is one of the most important characteristics to measure in having safe interaction between human and environment. One example of thermal sensor that had been developed is by combining heat generating layer to the temperature sensor, and the thermal conductivity was measured during contact [22]. Another example is by measuring heat transfer speed using heat flux sensor [23].
4
1.1.2 Detection Mechanisms
In the previous section, the types of tactile sensor according to their functions are listed and discussed. One of the most developed type is the pressure tactile sensor. Pressure sensor could be defined as the transducer that measure the pressure or load distributions that act between an object and the contact surface. Pressure will cause deformations and distortions of the object and the contact surface, so basically a pressure tactile sensor detects the deformations and defines it in a measurable way. There are several ways of transduction principles and mechanisms that can be applied to pressure sensors. Listed below are some mechanisms that had been used to build pressure tactile sensors.
1) Piezoresistive pressure sensing
Piezoresistivity could be defined as the change of electrical resistivity of a resistor due to the application of mechanical strain. Piezoresistive tactile sensor was among the ones that frequently developed because of its simple structure and mechanism. There are two types of piezoresistive pressure sensing mechanisms, i.e. strain gauge mechanism and nanocomposite mechanism.
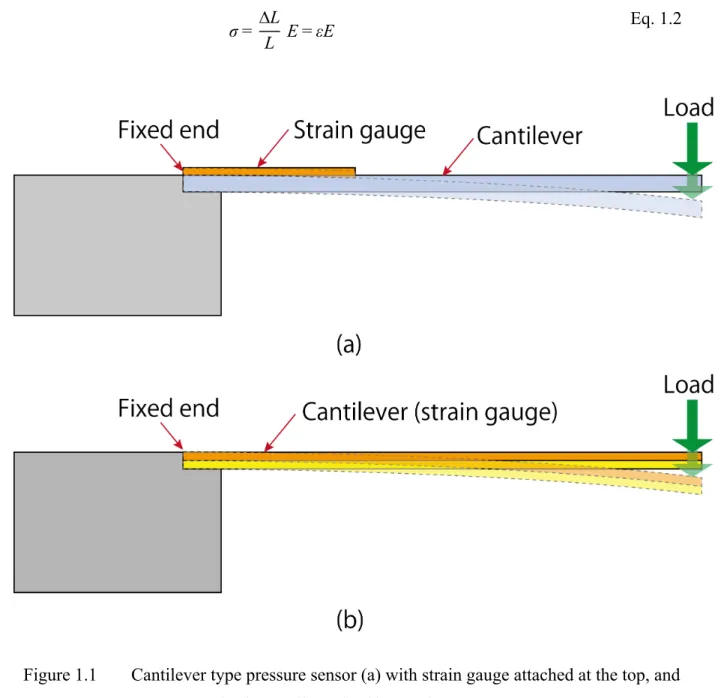
Strain gauge sensors are usually in the form of cantilever with a metal zig-zag shaped strain gauge fixed at the anchored side of the cantilever (Figure 1.1 (a)). Sometimes, the cantilever itself acted as the strain gauge (Figure 1.1(b)). The principle of piezoresistive effect was exploited to detect the pressure applied on the device. Piezoresistive effect usually occurs in conductors, such as metals, and semiconductors, like silicon (Si). Normally, the electrical resistance of a material is related to the length, L and cross-sectional area, A of the material. The relationship is shown in equation 1.1, where R is the resistance of the material, ρ is the resistivity, L is the length and A is the cross-sectional area.
R=r 𝐿
A
5
When load is applied on a material, the dimension of material will change, as depicted in Figure 1.2, and the ratio of the change to the initial dimension is called strain. The relation between stress (σ) and strain (ε) is shown in Hooke’s Law, as in equation 1.2.
σ= ∆L
L E=εE
Eq. 1.2
Figure 1.1 Cantilever type pressure sensor (a) with strain gauge attached at the top, and (b) the cantilever itself as strain gauge
6
Figure 1.2 Change of length of a material with applied stress
Here, ΔL is the change in length and E is the modulus of elasticity, or also known as the Young’s modulus of the material. In a piezoresistive material, as mentioned before, the change in the dimension of the material will cause the resistance to change. The relation of these variables is presented in equation 1.3.
∆R R = G
∆𝐿
L = Gε
Eq. 1.3
Here, ΔR is the change in resistance, and G is gauge factor of the material [24]. Substituting equation 1.2 into equation 1.3, the relation between the change of resistance ΔR and stress σ
can be written as follows.
∆R=GRσ
E Eq. 1.4
In the field of microelectromechanical systems (MEMS), improvement of the accuracy of the piezoresistive strain gauge sensor usually focus on the material [25]–[28] and the design of the force conducting media [9].
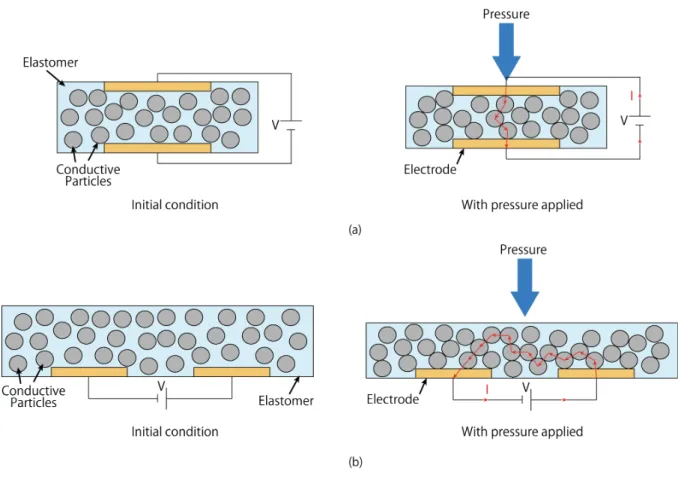
Nanocomposite piezoresistive sensors were made of nanoscale conductive fillers that are embed in soft polymer matrices. When pressure is applied to the nanocomposite material, the soft, elastic polymer will be compressed, and the filler distributions become ununiformed and dense. This makes the electrical resistance decrease. On the other hand, when pressure value is decreased, the filler distributions will be sparser, and the electrical resistance will
7
increase. The structure of the nanocomposite sensor type is shown in Figure 1.3. While polydimethyl siloxane (PDMS) is the most used soft polymer matrix to make the composite [29], research on the filler includes using metal-based particles such as silver (Ag) [30] and nickel (Ni) [31], and also carbon-based particles such as carbon black [32], graphene [33], and carbon nanotubes (CNTs) [34], [35].
Figure 1.3 Principle of composite type sensor, before and after pressure application. (a) shows composite with parallel electrodes, while (b) shows composite with one-sided
8 2) Capacitive sensing
Capacitive sensor uses the principle of a capacitance to operate. The capacitance of a capacitor, C could be defined in the equation below
C = ε0 εr
S d
Eq. 1.5
where e0 is vacuum permittivity with a constant value of 8.854 ´ 10-12 C2N-1m-2, er is the relative
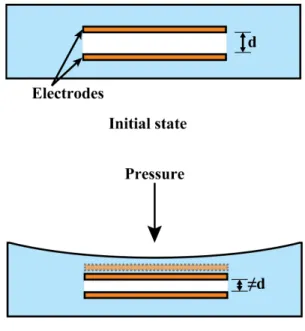
permittivity of dielectric, d is the distance between two electrodes, and S is the effective surface area. Capacitive pressure sensors are usually built by manipulating the distance between two electrodes, d (Figure 1.4) or the effective surface area S (Figure 1.5).
Figure 1.4 Principle of capacitive pressure sensor with change in the distance between two electrodes during pressure application
9
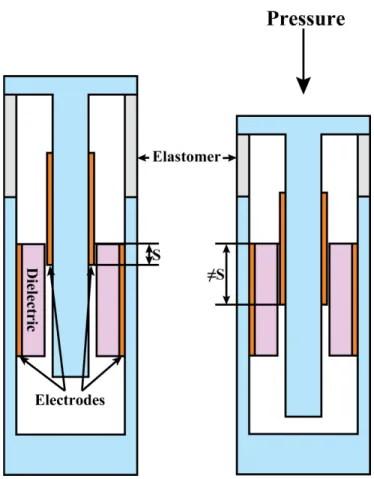
Figure 1.5 Principle of capacitive pressure sensor with change in the effective surface area during pressure application
Research on developing capacitive tactile sensor are now focusing on the dielectric materials [11], [36], [37] or the design of electrodes [11], [12] to increase the sensitivity of the sensor and for a better design in miniaturizing the sensor device. For the former type, flexible silicon elastomer namely PDMS is one of the most used materials to be the dielectric material of capacitive pressure sensor due to its obvious flexible properties [36], [38], besides the characteristic of human tissue friendly and biomedical compliance [39], [40]. Not only the material, there are also researches on the design and shape of the PDMS dielectric that were done to increase the sensitivity of the sensor. Among that were developed are V-shaped grooves and pyramids dielectrics [11], [41], [42]. Besides, there are also other material that the researchers are now eyeing to such as air [43], liquid [37], and nano needles [44]. Researches on the latter type of the sensor focus on the design of the electrodes [45] to increase the accuracy and sensitivity of the sensor, and also the material [12] to suit the needs of the sensor design.
10 3) Magnetic sensing
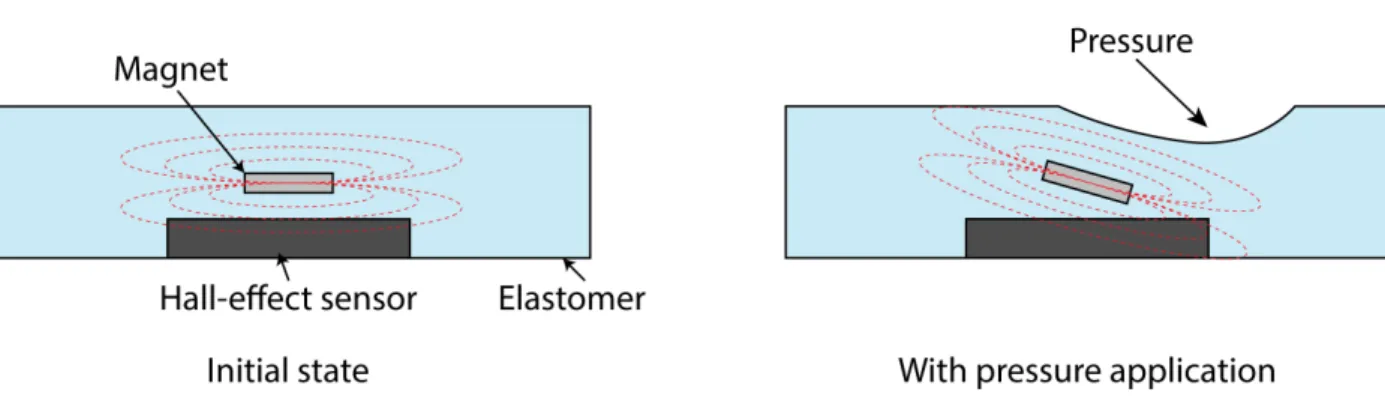
The working principle of magnetic tactile sensor is very much similar to the capacitive tactile sensor, except the measurable variable is obviously not the capacitance. There are several types of magnetic tactile sensor according to the measured variables. Among the most frequently developed are the one that measures magnetic flux or magnetic field intensity. These types of sensor utilize Hall effect [46] or giant magneto resistance (GMR) [47] to measure the aforementioned variables. The principle is as depicted in Figure 1.6. Force applied to the sensor will swift the position of the permanent magnet. Then, the change in the magnetic field vector will be measured by the Hall sensor.
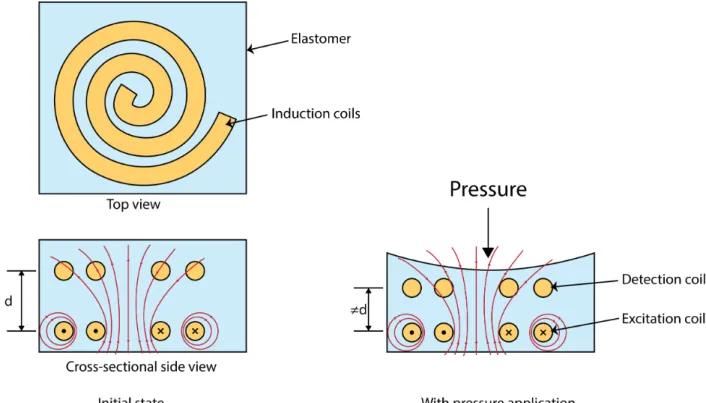
There are also sensors that utilize the principle of Faraday’s law of induction to measure the change in electromagnetic induction. Changes in magnetic flux will cause the change in induction voltage value [48]. One of the examples for this principle is shown in Figure 1.7. When load is applied on the sensor device, the distance between the detection coil and the excitation coil decreases, causing the change in voltage generated by the detection coil. The voltage change was related to magnetic field produced by the excitation coil that was located beneath the detection coil [49].
Figure 1.6 Principle of magnetic sensor with Hall-effect sensor. Figure shows the sensor in the initial state (left) and shift of magnetic field during pressure application (right).
11
Figure 1.7 Principle of magnetic sensor with change in the distance between excitation coil and detection coil during pressure application. Change of distance between both coils
12 4) Piezoelectric sensing
Piezoelectricity is a property of a material to generate electricity in response to mechanical stress applied to it, as shown in Figure 1.8. The most common material that is used to develop piezoelectric tactile sensor is polyvinylidene fluoride (PVDF) [50]–[52] due to its flexible and lightweight properties. Piezoelectric tactile sensors are commonly applied to dynamic environments because the charges that are generated are usually dissipate very quickly. Besides its application in detecting dynamic pressure, piezoelectric tactile sensors are also suitable to be used in shape and texture discriminations [53].
Figure 1.8 Principle of piezoelectric pressure sensing. Above is the piezoelectric material in initial condition, and below is the state during pressure application.
13 5) Optical sensing
In optical tactile sensor, optical fibers are typically utilized to transmit light, and then the changes in output light are then measured and analyzed to detect the tactile information. There are several principles that are used to tactile sensors. Among them, light intensity modulation and fiber Bragg grating (FBG) are the ones that are frequently used.
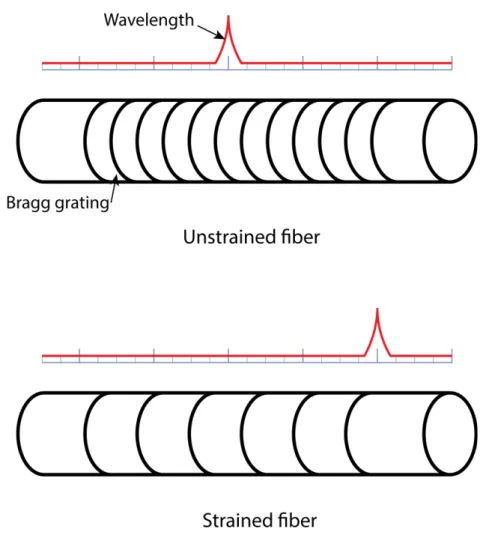
In the former principle, when pressure is applied to the sensor, the bending of the light fiber cause changes of the light intensity at the transmission side and output side of the fiber [54], [55]. Tactile information is then collected by evaluating the light intensity properties. The latter principle measures wavelength shifts that cause by external strain instead of light intensity [56]–[58]. The principles of optical sensing are shown in Figure 1.9 and Figure 1.10.
Figure 1.9 Principle of optical sensor with light intensity modulation. Figure on the left shows the sensor in initial state, while figure on the right shows the sensor during pressure
14
15
Table 1.1 summarizes the pros and cons of each sensing mechanism [59].
Table 1.1 Pros and cons of detection mechanisms of pressure tactile sensor
Detection
mechanism Pros Cons Piezoresistive • Simple fabrication process
• High spatial resolution
• Low cost
• High power consumption
• Hysteresis Capacitive • Good sensitivity
• High spatial resolution
• Temperature independent
• High noise
• Cross-talks
• Complex measurement circuit
• Hysteresis Piezoelectric • Good sensitivity
• High dynamic range
• High frequency response
• Dynamic sensing only
• Charges leakage
• Poor spatial resolution Magnetic • Good sensitivity
• High dynamic range
• High power output
• High power consumption
• Low frequency response Optical • Wide sensing range
• High spatial resolution
• Good reliability
• Vulnerable to temperature change
• Not flexible
16
1.2 Bio-inspired Tactile Sensors
There is no bigger reason for researchers to design tactile sensor than to mimic the function of the skin. The function of the skin – here let’s be specific to human’s one – is not only limited to ensure our internal organs are safe and we don’t look creepy with all the muscles, bones and arteries exposed, but also to provide one of the most important sense to guarantee better living: the sense of touch. The broad variety of ‘sense of touch’, i.e. differentiation of pressure, location and temperature was firstly recognized by a psychologist named Weber in 1846. His essay titled “Touch and Common Sensibility” attracted researchers to dig the information about this particular sense deeply and finally they added one more sense variation, namely pain [60].
1.2.1 Anatomy of the Skin
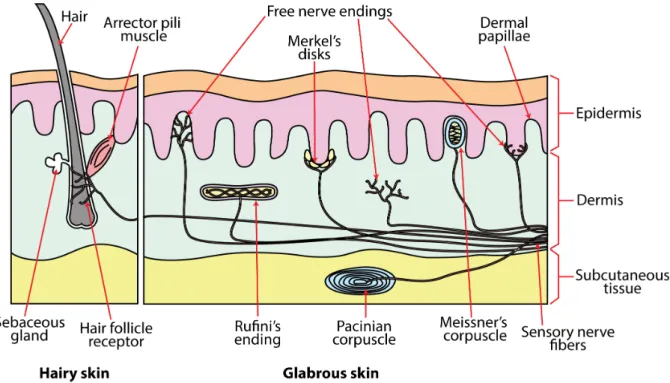
Human was said to have the sense of touch as early as six weeks old inside the mother’s womb [61]. The formation of the skin includes three layers, specifically, from the outermost side, epidermis, dermis, and subcutaneous tissue. There are two types of the skin; i.e. the glabrous skin, or also known as hairless skin, which located at the lips, palm, and feet, and the hairy skin which covers the entire human body except the areas with the former skin type.
The skin can sense light touch, pressure, vibration, temperature and pain due to the existence of receptors. Touch receptors exist not only at the skin, but also in other organs such as tongue and the entire oral cavity [62], [63], surround the teeth [64], [65], and in internal organ such as pancreas [66], [67]. These receptors receive stimuli from the environment and translate them to informative nerve impulses. The impulses then are sent via the nerves to the central nervous system and finally to the brain to be recognized. The types of receptor that specifically senses temperature difference is called thermoreceptors, and the ones that senses pain is nociceptors. These types of receptors are in the form of free nerve endings. However, the main part of the discussion to be focused on here is the ones that can sense different type of touch; i.e. pressure, vibrations, soft touch, etc. they are called the mechanoreceptors. The types and locations of these receptors is illustrated in Figure 1.11.
17
Figure 1.11 Location of tactile receptors beneath the surface of the skin
The function of the mechanoreceptors is to recognize shape, form, and spatial nature of an object. The glabrous skin has more sensitive mechanoreceptors than the ones in hairy skin, bur hairy skin has one more touch receptor that associate with the hair, i.e. hair follicle receptor. There are four major types of mechanoreceptors in the somatosensory system; i.e. Meissner’s corpuscles, Pacinian corpuscles, Merkel’s disks, and Ruffini’s endings. These mechanoreceptors are responsible in receiving and recognizing tactile stimuli such as pressure, friction, roughness, softness, hardness, stickiness, etc. [68]–[76].
These four types of mechanoreceptors can be divided into two categories according to how they function in receiving stimuli from the environment: the rapidly-adapting (RA) receptors and the slowly-adapting (SA) receptors. The RA receptors, namely the Meissner’s corpuscles and the Pacinian corpuscles, adapt quickly to the stimuli. It means that they respond at the beginning they sense the existence of the stimuli, and then rapidly remove the action potential generated by the stimuli. This function is important in adapting continuous stimuli, such as the ones that our shirts give to our skin. Pacinian corpuscles are sensitive to skin deformation caused by vibration, while Meissner’s corpuscles are very sensitive to light touch. RA receptors concentrate especially at the sensitive areas of our body such as fingertips and lips [77]–[79].
18
On the other hand, SA receptors, i.e. the Markel’s disks and the Ruffini endings, are the ones that keep responding until the stimuli are removed. The function of these type of receptors are to differentiate light pressure and discriminate static touch especially in determining shape, edges, and rough texture [80]. The presence of SA receptors makes us aware of stimuli that we have to respond to, for example in gripping objects so that they do not slip, and for the blinds to read Braille.
Besides the categories that differentiate how the receptors respond to stimuli, there is one more category to define the mechanoreceptors; i.e. the location beneath the skin. The placement of these receptors determines the receptive field of the receptors, where deeper receptors will have larger receptive fields, and vice versa [81]. In this category, the first one is the Type I receptors that are located near the surface of the skin, at the dermal papillae ridges. Two kinds of mechanoreceptors that can be categorized as Type I receptors are Meissner’s corpuscles and Merkel’s disks. Other than the two is Type II receptors that located deeper at the dermis layer and subcutaneous tissue of the skin. Because of the large receptive fields that Pacinian corpuscles and Ruffini’s endings have, it is observed that their concentrations beneath the skin are lower than those in the Type I category [82]. The details of the characteristics of each mechanoreceptor are summarized in Figure 1.12 [7], [83].
19
1.2.2 Skin-inspired Tactile Sensors
Researchers all over the world are now taking the skin as an inspiration to design not only tactile sensor, but also other inventions [8], [84] for some features of the skin are proved to have significant effects on the skin’s sensitivity to various kinds of tactile stimuli. Going through from the surface of the skin, to deep inside where the naked eyes could not see, there are special characteristics of the skin that support us to recognize light touch, pressure, vibration, slip, etc.
The surface of the palms and feet are different from other parts of our body because the existence of ridges. It is known that the pattern of the ridges is unique for each individual so that they are useful in one self’s identification everywhere in the world, but actually their existence serves more than that. Research on mimicking the ridges to develop tactile sensor had been done several times to increase the sensitivity of tactile sensors in detecting shear force [85], discriminating curvatures of objects [86], and detecting objects’ hardness and surface roughness [87].
The role of the hair to tactile sensing of the skin was not overlooked at as there are also sensors that were designed with almost the same features as the hair. Inspired by both hair and skin, there are tactile sensor that were built to sense wide range of tactile pressure, just like the hair which can detect small pressure and heavier forces would be sensed by the skin [88]. Not only human hair, vibrissae of mice and felines were also mimicked to some designs of tactile sensor as these whisker-like sensors are reported to be able to detect gas flow [89] and discriminate surface textures [90]–[92].
Right beneath the surface of the skin there lies the ridged dermal papillae, which seems like the sockets for epidermis-dermis connection. But for tactile sensor researchers, this ‘socket’ shape was an inspiration as tactile sensors were developed imitating the shape of dermal papillae to detect changes on object’s shape surfaces [93], [94]. Going a slight deeper from the dermal papillae, there are distributions of tactile mechanoreceptors and free nerve endings, where tactile stimulations are detected and recognized, as explained in the previous section. Researchers are spurred by these various functions of mechanoreceptors, so they designed tactile sensor to detect various tactile stimuli, just like what the mechanoreceptors can do, such as pressure and temperature [95], and also sliding together with vibration [96]. Not stopping to only the mechanoreceptors, there are also effort to build the signal processing system of a tactile
20
sensor imitating the nerves that connects the mechanoreceptors to the central nervous system [97].
Besides the elements exists from the surface to deep below the dermis layer of the skin, the characteristics of the skin had inspired researchers to develop tactile sensor. One example is a flexible capacitive sensor developed with liquid as dielectric [37]. The main material of the sensor is a flexible silicon called polydimethyl siloxane (PDMS) that are elastic, just like the skin.
In this research, variation of the dielectric in between two conductive electrodes of a capacitor were studied to find the effect on the sensitivity of the pressure sensor. Contrary to the conventional capacitive sensor that used air [43] and solid materials [38]–[40] as the dielectric, in this research, two types of liquid have been used to fill the gap between two electrodes: i.e. deionized (DI) water and glycerin. Using these liquids as dielectric is expected to increase the sensitivity of the sensor device because the high permittivity values compared to air, which is 80 and 47 for DI water and glycerin, respectively, would increase the capacitance value of the sensing elements. Of course, there are solid materials that have higher permittivity values to be used, but the flexibility of the sensor device would be negatively affected if solid material is used as the dielectric.
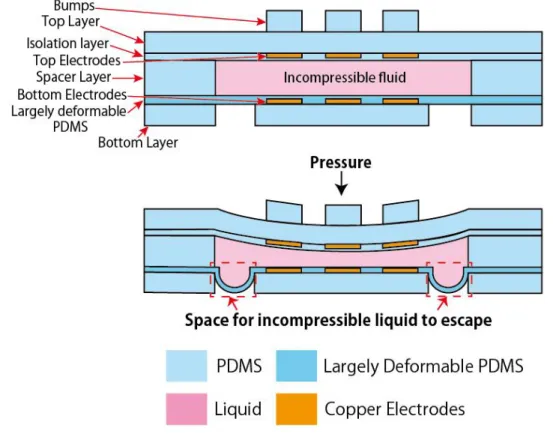
The design of the sensor is illustrated in Figure 1.13. The pressure sensing concept is shown in Figure 1.14. The sensor was designed in 3´3 array of capacitive sensor elements. The sensor consisted of eight layers: bumps, top layer, top electrodes layer, top isolation layer, spacer layer, largely deformable PDMS layer, bottom electrodes layer, and bottom layer with escape reservoir. Most of the layers were made using the flexible and elastic PDMS membrane, except the electrodes and the largely deformable PDMS layer. The electrodes were made of copper on polyimide film, and the largely deformable PDMS was made using silicon based adhesive paste (Dow Corning® 3145 RTV MIL-A-46146 adhesive/sealant, Dow Corning Corp.). The function of each layer is summarized in Table 1.2.
21
Figure 1.13 Design of capacitive sensor device in exploded view showing each layer
Figure 1.14 The cross-sectional view of the capacitive sensor device (top) and flowing-out of liquid from spacer layer during pressure application on the device (bottom)
22
Table 1.2 Layers of the capacitive sensor device with their respective functions
Layer Function
Bumps Enhancing the spatial resolution of the sensing element. Because the sensing elements were positioned in the inner surface of the device, the existence of bumps on the top of the device would be the indicator of the position of the electrodes in the device. Top layer Securing the top electrodes, while acting as the lid to cover the
inner side of the sensor device
Top electrodes As one of the electrodes for the capacitive sensing element Isolation layer As the cover for top electrodes, so that the top electrodes did not
contact the liquid in the spacer layer directly. This is to prevent the oxidation of both liquids and electrodes.
Spacer layer Chambering the liquids between two electrodes Largely deformable
PDMS layer
To allow the flow of the incompressible liquid in spacer layer to the escape reservoir without leakage outside the sensor device Bottom electrodes As one of the electrodes for the capacitive sensing element, the
pair of the top electrodes.
Bottom layer Supporting the bottom electrodes and the whole device. The escape reservoir for the liquids was also placed in this layer.
23
Prior work from the team in the same laboratory had designed the sensor with escape reservoir at the side of the sensing element array, as shown in Figure 1.15 [98]. This increased the size of the sensor device. Therefore, the idea of shifting the escape reservoir to the bottom layer of the sensor device has decrease the footprint of the device to 75%.
Figure 1.15 The design of the prior work of the capacitive sensor device with escape reservoir of the encapsulated liquid at the side of the liquid chamber
24
The device was fabricated mainly using photolithography process. The layers were made one by one, and then assembled to form top part and bottom part of the device. The parts were then bonded in the chosen liquid to encapsulate the liquid in the spacer chamber. The bonding process was called Bonding-in-Liquid Technique (BiLT) [99]. Details about the fabrication process are as follows:
1) Fabrication of layers made of PDMS
The layers that were made of PDMS were fabricated using soft-lithography technique. In this process, mold that represent the negative of the layer was made by patterning SU-8 2075 (Nippon Kayaku Co., Ltd.) with the thickness of 300 µm, on a glass substrate. The mold for the spacer layer, which was 500 µm in thickness, could not be patterned using the same material as the consistency of the SU-8 2075 liquid could not achieve that thickness when cured. Therefore, acrylic mold was made by machining process. PDMS (Silpot 184, Dow Corning Toray Co., Ltd.) was mixed well with the curing agent with the ratio of 10:1 in a plastic cup and placed in the vacuum desiccator for one hour or until all the air bubbles were dismissed. About 3 mL of the PDMS was then poured on the mold and spin-coated to get the desired thickness. After that, it was baked on a 100°C hotplate until hardened. After the PDMS membrane was cooled down to room temperature, the PDMS layers were released from the molds and the unnecessary parts were cut using a knife cutter. The process was illustrated in Figure 1.16.
25
2) Fabrication of the largely deformable PDMS layer
As mentioned above, this layer was made using silicon based adhesive paste (Dow Corning® 3145 RTV MIL-A-46146 adhesive/sealant, Dow Corning Corp.). The paste was mixed with thinner (RTV Thinner, Dow Corning Toray Co., Ltd) in a plastic cup. The ratio of the mixture is 2 mL of thinner with every 1 g of the silicon elastomer paste. The mixture is then put in vacuum desiccator for about 30 minutes, or until all the air bubbles were dismissed. If the mixture of largely deformable PDMS was directly spin-coated on the glass substrate, the largely deformable PDMS layer would get adhered to the glass substrate too strongly. To resolve this problem, layers of amorphous fluoropolymer CYTOP were spin-coated on the glass substrate beforehand, so that the adhesion would be attenuated and the largely deformable PDMS layer would be easily released from the glass substrate. CYTOP type S (CTX-809SP2, Asahi Glass Co., Ltd.) was usually used as a release material, but as it has the non-adhesion characteristic, CYTOP type M (CTL-809M, Asahi Glass Co., Ltd.) that had been mixed with the solvent (CT-Solv. 180, Asahi Glass Co., Ltd.) with a ratio of 1:100 was firstly spin-coated on the glass substrate as the adhesion primer to enhance the adhesion between CYTOP type S and the glass substrate. The silicon elastomer paste was then spin-coated on the CYTOP layers. The film was left to harden at room temperature for 24 hours. The process was illustrated in Figure 1.17.
26 3) Fabrication of top and bottom electrodes
Adhesiveless polyimide copper clad laminate with 25 μm thick of polyimide film and 18 μm thick of copper layer (ESPANEX MC18-25-00FRFM, Nippon Steel Chemical Co., Ltd.) was used as the electrodes for this device. The details of electrodes patterning process are illustrated in Figure 1.18. AZ P4620 (AZ Electronic Materials K.K.), a positive type photoresist was used to pattern the copper electrodes using photolithography process.
Figure 1.18 Fabrication process of the electrodes using photolithography and copper etching process
27 4) Bonding of the layers
Bump and top layer, copper electrodes films, spacer layer, largely deformable PDMS layer, and bottom layer had to be bonded together to complete the device fabrication process. The bonding processes consisted of two main steps; bonding using soft-etching technique to form top part and bottom part of the device, and BiLT to bond both parts together while in the same time encapsulating the liquid in the space chamber.
To bond bumps and top layer with copper electrodes film, and bottom layer with copper electrodes film, each layer was placed in the soft-etching chamber (SEDE-P, Meiwafosis Co., Ltd.) and was etched for 35 seconds. After the etching process was completed, the copper films were brought into contact with PDMS layers and cured on the 100°C hotplate for 3 minutes. The layers were then cooled-down to room temperature. For the spacer layer and largely deformable PDMS layer bonding, the process was just the same as mentioned above, but after the layers were cooled down to room temperature, the largely deformable PDMS layer was cut according to the spacer layer size and released from the glass substrate slowly. The bonded spacer layer-largely deformable PDMS layer and bottom layer-copper electrodes film were finally bonded together using the same process. The processes were illustrated in Figure 1.19.
28 (a)
(b)
(c)
(d)
Figure 1.19 The bonding process of (a) the bumps and top electrodes, (b) The largely deformable PDMS layer and the spacer layer, (c) the bottom layer and bottom electrodes, and
29
To perform the BiLT, firstly, UV curing silicon resin (ThreeBond 3164, ThreeBond Co., Ltd) was spin-coated on a glass substrate. The silicon resin was then transferred to the spacer layer. The layers were then overlapped in the liquid and put on the mask aligner where UV rays were exposed. The details were illustrated in Figure 1.20.
The fabricated device was shown in Figure 1.21. The device was flexible and deformable as the material used exhibits those characteristics. Experiments were done to test the performance of the sensor device in the terms of sensitivity enhancement. For comparison purpose, a sensor device with the same design was made without liquid encapsulated in the spacer chamber as the control condition for the experiment. The space was left with air in between the two electrode layers for this control sample.
30 (a)
(b)
Figure 1.21 (a) The fabricated capacitive sensor device with liquid as dielectric, and (b) flexibility of the device
31
The experiment was done by applying normal force gradually to the bump of the middle sensing element of the device. The amount of force was controlled by the microstrength evaluation testing machine (Micro Autograph MST-I, Shimadzu Corporation), while at the same time, the capacitance values of the device were measured using a capacitance-to-digital converter (AD7746, Analogue Devices Ltd).
The result of the experiment is shown in Figure 1.22. There was no leakage of the liquid observed during the procedures of experiment. From the deformation test result shown in Figure 1.22 (a), deformations of the devices with liquid as dielectric were smaller than the one without liquid by 20%. The reason behind this phenomenon is the repulsion forces from liquids are larger than that from air. However, given the high dielectric performance of the encapsulated liquids, we consider that the proposed escape reservoir functioned sufficiently. The trend of the result in the graph of deformation vs applied pressure was observed to be similar, where a steep and linear initial rise up until the pressure of 100 kPa and gradual increase in the deformation over 100 kPa. The sensitivity of the sensor device can be observed as the gradient of capacitance difference vs applied pressure graph in Figure 1.22 (b). The change in the capacitance difference (C-C0) of the devices with liquid encapsulated were constantly
increased and almost proportional to the pressure applied. On the contrary, the change in C-C0
of the device without any liquid encapsulated was found to be increasing at first, but did not show a significant change after 100 kPa pressure applied. From this result, we could conclude that the devices with liquids encapsulated as dielectric were more sensitive as compared to that without liquid as dielectric; especially for detecting large pressure, i.e. from about 100 kPa to about 800 kPa.
32 (a)
(b)
Figure 1.22 Result of the experiment on capacitive sensor device comparing the devices with DI water, glycerin, and air as the control sample. (a) Relationship between the deformation of top electrode and pressure applied to the device, and (b) relationship between
33
1.3 Objective of Study
Most of the tactile sensors that had been developed inspired by the skin were flat and flexible, just like the skin. The sensors are usually to be mounted to robots as the skin, so it is true that there is more demand for flat and flexible tactile sensor. However, to be used in small and narrow channel, e.g. inside the body during MIS procedures and in pipeline during pipeline inspection, etc., the tactile sensor has to be non-flat, small, and can be fitted to the tip of the devices or robots, just like how cameras did in this time being.
Taking MIS procedure as an example, besides adequate dimension of size, a sensor device for MIS need to be able to detect forces from different directions and distinguish hardness and softness of human organ’s tissues. Focus on the research of non-flat tactile sensors were also done by some researchers, e.g. the tactile sensor that were developed inspired by fore finger [100], roughness discrimination artificial fingertip sensor [101], and also skin inspired tactile sensor for surface texture perception [102]. Focusing on the ability for a sensor to detect multidirectional load, there are some researchers who decide to take the road not taken by others, by not mimicking the skin. For example, a three-dimensional load sensing tactile sensor was built in donut shape [103], and a capacitive tactile sensor with liquid metal electrodes was developed inspired by a ball-point to detect the location of hard bump in soft tissue [12]. Other than that, a load direction recognizable tactile sensor was also designed in micropillar arrays [104]. Function-wise, these tactile sensor looks promising, but the complicated wiring systems and large sensing elements makes them difficult to miniaturize. From the view of safety and better quality of life, for example, in applying this sensor for MIS, the need for high indentation in localizing subcutaneous blood vessels may be the drawback for this sensor which can actually be made low-costly and specifically for MIS [105] as high pressure may cause tissue injuries.
Robots for pipeline inspection are another example of the application of non-flat tactile sensor. Several types of robots had been developed to inspect thousands of kilometers of various diameters of pipelines [106]–[108]. These robots have to move inside the pipelines, travelling a few kilometers through T and U junctions to inspect the internal surface of the pipelines whether there are corrosions or cracks. Usually, a charge-coupled device (CCD)-based camera would be installed in front of the robots to do the recording, but for inspection, going through a recorded video of hundreds of kilometers of pipelines would be challenging and time consuming. Hence, some robots are now equipped with sensor modules like
34
ultrasound sensor, microwave sensor, laser sensor, and etc. to aid the inspection task [109]. Tactile sensor might not help in detecting cracks and corrosions inside a pipeline, but tactile sensor is needed in forward motion and steering mechanism for pipeline bends. Therefore, tactile sensor for multidirectional force detection is desirable to this application. To date, walking robot are helpful in inspecting small diameter pipelines, but the complexity of building tactile sensor for its legs had been a major limitation in developing this technology [109].
Therefore, in this dissertation, design and fabrication process of a bio-inspired tactile sensor for multidirectional load sensing will be discussed. This particular sensor cannot be made inspired by the skin for the shape cannot be flat and flexible to fit the expected application. Consequently, inspired by the structure of a tooth and how it can sense pressure, this sensor is designed and fabricated by using the principle of strain gauges. Besides its simple structure that can be further miniaturize, the developed tactile sensor is also costly economical, and has uncomplicated data analysis system.
1.4 Overview of Thesis
This thesis consists of six chapters. The first chapter is this chapter, explaining about the background and objective of the research.
Chapter two explains about the design strategy and how the design of the sensor can be realized inspired by the anatomy of a tooth.
The design of the proposed sensor device is explained in the third chapter. The chapter will begin with some discussions about mechanisms chosen for the proposed device, a couple of designs that were proposed before, followed by the details of the final design.
Chapter four discusses about the fabrication process of the proposed sensor device. The details of the fabrication process of each part of the device will be explained first in this chapter, and then the assembly process will be specified next.
The experiments that were done to prove the concept of the sensor device is listed in detail in chapter five. The experimental results and discussions will also be explained thoroughly in this chapter.
35
Chapter six summarizes all of the topic that has been discussed and presents some views about the future prospects of this particular research.
36
2
DESIGN STRATEGY
2.1 Inspiration
As mentioned in the previous chapter, a lot of tactile sensor has been designed inspired by the skin, for the skin is the best organ that defines sense of touch. However, there are also other parts of our bodies that do the same function, with different approach. In this research, the design of the sensor device was inspired by a tooth to suit the function of the sensor device.
2.1.1 Anatomy of a Tooth
The teeth are bones that are not wrapped with muscles, fat, and skin, instead the surface is bare. So, the teeth are exposed to anything that are coming near it, including tactile stimuli. Of course, every one of us had experience how our teeth always did a good job in recognizing and discriminating tactile stimuli, whether in sensing light touch and hard pressure, or distinguishing the direction of touch and pressure. Unlike skin, a tooth is hard and not deformable, and it is proven that there are no tactile receptors under the surface of the enamel. Fortunately, there is a thin layer between the tooth and its socket where mechanoreceptors are distributed. This layer is called periodontal ligaments. The anatomy of a tooth is illustrated in Figure 2.1 [64], [65], [110].
37
With the width of only 0.15 mm to 0.4 mm, periodontal ligament, which located between the cementum of root on the tooth and the socket wall of alveolar bone, contains soft, fibrous, and flexible substance such as collagen, oxytalan fibers, and ground substances. Besides, it also contains nerves, blood vessels, lymph vessels, and of course, periodontal receptors including mechanoreceptors. The functions of periodontal ligaments are including:
1) Supporting the tooth, including maintaining it in the right position during eruption, excessive occlusal loading, and after extraction.
2) Protecting the tooth from excessive occlusal force by absorbing the load like a cushion.
3) Sensing light touch and pressure that occur on the surface during mastication. The existence of mechanoreceptors explained this phenomenon.
4) Helping in the forming, maintaining, and repairing of cementum and alveolar bone.
5) Providing nutrient supply required by the cells of the ligament through the blood vessels.
38
2.1.2 Movement and Pressure Sensing
For the sensory function of periodontal ligaments, the periodontal receptors include nociceptors and mechanoreceptors. Nociceptors are responsible in detecting pain, while mechanoreceptors help in detecting physical deformation of the membrane and proprioception of the teeth during food munching process. Both RA and SA mechanoreceptors distributed in a high concentration in periodontal ligament, thus a very small force, e.g. that is caused by a thin metal foil that is placed in between two teeth, can readily be sensed by the teeth.
The mechanoreceptors in periodontal ligament fires when the deformations of the fibrous substance of the ligament are detected. The physical characteristics of periodontal ligament, especially with the presence of collagen and the ground substance, is like a viscoelastic material. So it responds to force in a non-linear, viscoelastic manner [111], [112]. During loading on the surface, the periodontal ligament on the pressure side of the tooth will be compressed, while the one at the tension side will be stretched. This compress and stretch movement will stimulate the mechanoreceptors and the sensing information will then be sent to the central nervous systems via the nerves. The deformation of periodontal ligament during these stimulations is depicted in Figure 2.2.
Figure 2.2 A tooth in (a) resting state and (b) during pressure application to its enamel. Periodontal ligaments in blue were in resting state, red in stretched state, and green in
39
2.2 Design Concept of the Sensor Device
The idea of the design was using the concept of a tooth, where a pole, which act like a tooth, was going to be placed around a material that could sense the movement of the pole when load is applied to it. The concept is illustrated in Figure 2.3.
The structure of a tooth seems common with tactile sensor designs, as a lot of force sensors had been designed with a pole, post, probe or mesa structure. The tooth-inspired tactile sensor device is quite similar to whisker type sensor device, in terms of the force would not be directly applied to the sensing elements, like the ones inspired by skin. In this type of sensor, force would be applied to the sensor part that is moveable, and the movement of the part would trigger the sensing elements, like strain gauges, that are attached to it. One of the examples is this whisker sensor for underwater induced vortex detection [113], which has quite a similar design with our proposed sensor. The sensor was built using three-dimension printing technology, making its size of 8 mm in diameter and 160 mm in length. For MIS application, small-scale sensor has been made inspired by hair-cell, with the diameter only 420 µm [114]. It has a detectable shear force range below 5 mN and post’s maximum displacement of only 15 µm. Building a mesa structure [115] or a probe [116] on a flat sensor element was proven to increase the detectable shear force range.
All of these sensors have a similarity with the proposed sensor in this research, which has protruding structure such as pole, post, probe or mesa structure. However, unlike the usual whisker type sensors with flat sensing elements, the proposed sensor has three-dimensional sensing element structure, just like the periodontal ligaments of the teeth. Besides, unlike some whisker-like sensor which the protruded structure glued on the flat surface, this proposed sensor was inserted and glued inside a hole to set a limit in the displacement of the pole to avoid over-bend that can cause destructive effect on the durability of the sensor device itself.
40
Figure 2.3 Principle of pressure tactile sensor inspired by the anatomy of a tooth, in (a) initial state, and (b) When pressure is applied to a side of the sensing pole, the sensing elements at the pressure side is compressed (jiggly red lines) and sensing element at the
tension side is stressed (thin red line)
2.3 Size and Limitations
The sensor device is aimed to be applied to aid operations in narrow areas such as MIS procedures, pipeline inspection, etc., thus the size has to be small enough to fit the equipment used during the procedures.
For MIS procedures, the tip of the sensor device for MIS must be smaller than 10 mm in diameter [117], and the material of the sensor has to be lightweight [118].Other than that, the range of detectable force of the sensor for MIS should be up to 16 N, but most of the procedures in endoscopic surgery, e.g. tissue palpation, require a force sensor that can detect pressure lower than 1 N [119].
For pipeline inspections done by engineers, for example in oil and gas industries, the pipeline size are various; the small ones are only a few mm, and the big ones could reach a few thousands mm [120]. Researchers are developing robots with tactile sensors to aid the
41
movement of robots during pipeline inspections, together with cameras for better view on what is happening inside the unreachable areas [109]. The motion of pipeline robots are quite slow, about 50 mm/s for small robots [106]. Range of detectable force are not mentioned because it is subject to the weight and speed of the robot itself, but it is desirable for the wiring to be less complicated and lightweight, because inspection robot could not carry heavy load because of the limitation of power supply despite of long travelling distance [109].
Using these two examples of the application of non-flat tactile sensor, in this research, the sensor device would be designed to measure force less than 1 N, with size less than 10 mm in diameter. Besides, the material used had to be lightweight and biocompatible. Simple wiring and data processing are necessary, and the sensor should be able to detect force in motion, but low frequency motion would be sufficient. The gap between sensing pole and the base would set the limit of the displacement of the sensing pole. However, the displacement of the sensing pole itself could be higher, according to the length of the pole. As illustrated in Figure 2.4, taking the bottom of the pole as the fixed fulcrum for the pole, the displacement of the pole can be calculated as follows;
𝑑& =𝑙&
𝑙(𝑑( Eq. 2.1
Here, d1 and l1 is the displacement and length of the pole at any point above the sensing element
that would be the possibility of the pressure point, and d2 and l2 is the displacement and length
of the pole at the pole movement limitation point near the surface of the base, where the sensing element would be mostly affected by the movement of the sensing pole. The movement of the pole should be in a rotation, thus the displacement of the pole d1 and d2 should be in a curve
line. However, assuming that the displacement is sufficiently small, d1 and d2 could be regarded
as a straight line. Longer pole could compromise higher displacement. Nevertheless, because the sensor is aimed to be applied to narrow spaces, a few mm of pole displacement would be sufficient for the application. Therefore, this tooth-like design would be suitable for small-scale tactile sensor, provided that the sensing element can detect small displacement from applied force.
![Table 1.1 summarizes the pros and cons of each sensing mechanism [59].](https://thumb-ap.123doks.com/thumbv2/123dok/1879758.2666019/30.892.105.792.201.825/table-summarizes-pros-cons-sensing-mechanism.webp)