VOL. 6, NO. 3, pp. 155 - 159, September 2016 Submitted January 2016; Revised May 2016; Accepted August 2016
Copper Toxicity of Four Different Aquaculture Ponds
Moshod Keke Mustapha*, Joshua Taiwo Agunloye
Department of Zoology, Faculty of Life Sciences, University of Ilorin, Ilorin, Nigeria
ABSTRACT
Copper is a nutritional trace element for fish which could be deficient or toxic. Copper concentrations from four aquaculture ponds were analyzed for 12 weeks using Bicinchoninate method. Alkalinity was measured using col -orimetric method with the aid of Hanna Multiparameter Bench Photometer. Temperature and pH of the ponds was measured in situ using Hanna Portable pH/EC/TDS/Temp combined waterproof tester. All measurements were done I triplicates. Copper concentrations ranged from 0.01 to 0.10 mg/L, alkalinity ranged from 105 to 245mg/L. Weeks 1 and 12 recorded the highest and lowest Cu2+
concentrations, while lowest and highest alkalinity were obtained in weeks 1 and 12 respectively in all the ponds. Temperature and pH ranged from 29.1 to 35.9°C and 6.35 to 8.03. The trend of copper concentrations in the ponds was Natural > Earthen > Concrete > Collapsi ble, with concentration slightly above the normal in the ponds. This could have come from the pipes used in de -livering water to the pond, copper alloy nets and mesh used in the ponds, anti-fouling agents, algaecides, water source and fish meal. Effect of elevated copper was seen in the morphology and behavior of Clarias gariepinus which include slimy mucus on the skin, aggressive and uncoordinated swimming with the opercula flared, slow growth, reduced odor perception of food and water bubbles on the ponds. Copper should be regularly bio moni -tored to determine toxicity in fish.
Keywords: Fish, alkalinity, pH, toxic, management
Copper (Cu2+
) is an essential nutritional trace ele-ments required by fish in minute quantity. Wild fish obtain their dietary copper requirements from the wa-ter they inhabit and the diet they feed on. The concen-trations of copper, its sources and effects in the wild fish habitat and on wild fish population have been by extensively reviewed by [1].
The concentrations of copper in water are depen-dent on pH, temperature, alkalinity, bicarbonate, sul-fide, and organic ligands [2]. Copper is among the most toxic of the heavy metals in freshwater and ma-rine biota [3], and often accumulates and causes irre-versible harm to some fish species at concentrations just above levels required for growth and reproduction [4]. The effects of low and high dietary levels of copper in fish have been highlighted by [5, 6].
Studies on copper concentrations in aqua cultural
ponds is essential in aquaculture due to the fact that copper is a trace element required in minute quantity in fish production and anthropogenic contamination of the element in aquaculture tanks and ponds is mini-mal. Many factors can however introduce copper to aquaculture ponds which could be deleterious to the fish and water quality. These include copper-contain-ing pipes used in delivercopper-contain-ing water to the pond, copper alloy nets used in harvest, copper alloy mesh used for pen aquaculture, anti-fouling agents containing copper compounds used in controlling organisms that impair the flow of water, algaecides and parasiticides contain-ing copper compounds used in killcontain-ing alga and para-sites, pond water source and fish meal for feeding the fish.
In spite that copper is needed in minute quantity in fish and its introduction to aquaculture water is im-plausible, its deficiency or toxicity can occur when the
JTLS | J. Trop. Life. Science 155 Volume 6 | Number 3 | September| 2016
INTRODUCTION
*Corresponding author: Mustapha, M.K
Department of Zoology, Faculty of Life Sciences, University of Ilorin
TEC, University of Ilorin, Ilorin, Nigeria 240003 E-mail: [email protected]
How to cite:
concentration in water is too little or in excess of the requirement by fish. This could lead to nutritional problems or toxicity to the fish in culture. The objec-tives of this paper are to determine the concentrations, source(s), effects and management measures of copper concentration in four different aquaculture ponds used for the culture of African mud catfish Clarias gariepi-nus. This is the first attempt at determining the toxic-ity level of copper in different aquaculture tanks used for the culture of an important African fish of culture.
Treatments
Four different aquaculture ponds of the same size and dimension of 4.5 m × 4.5 m × 1 m, (20 m2
× 1 m) volume capacity of 20 m3 (20,000 L) and containing a population of 2000 C. gariepinus and biomass of 500 ± 50 g were used for the measurement and effect of cop-per concentrations. These ponds were collapsible pond, concrete tank, earthen pond and a natural pond. Bore-hole water is the source of water to the collapsible pond, concrete tank, and earthen pond while the natu-ral pond has its water source from the rains.
Water was collected from the ponds with 50 mL plastic water bottle in the afternoons at 1 pm weekly for 12 weeks between February and April 2015. Copper concentrations were measured using Bicinchoninate method and alkalinity was measured using colorimetric method with the aid of Hanna Multiparameter Bench Photometer for Laboratories Model HI 83200-02. Tem-perature and pH of the ponds were also measured in situ at the same time for the same period using Hanna Portable pH/EC/TDS/Temp combined waterproof tester Model HI 98129. Triplicates water samples of the ponds were obtained and measured for copper and al-kalinity, while pH and temperature, measurements were also measured in triplicates in situ. Morphological and behavioural changes were observed from the fishes in the different tanks to show the effect of copper toxi-city in them.
Statistical analysis
Stata ver.13 was used to analyze the results. Weekly mean of each parameter was compared using ANOVA at p < 0.05 to see the significant differences in each pa-rameter among the four ponds, while correlations be-tween the parameters were also analyzed using data analysis and statistical software Stata Ver13.
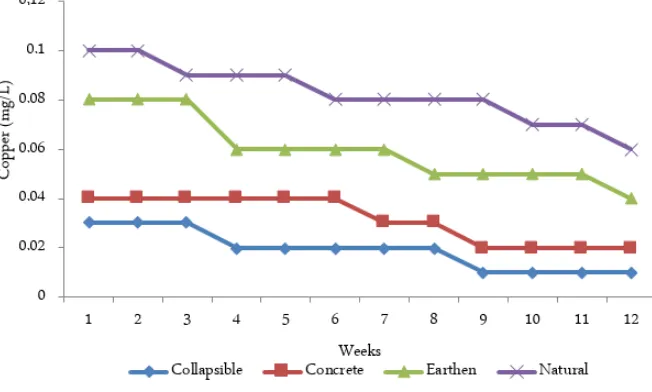
The mean results of copper concentrations,
alkalin-ity, pH and temperature fluctuations in the four ponds are presented in Figures 1, 2, 3, and 4. Copper concen-trations ranged from 0.01 to 0.10 mg/L with highest concentration recorded in natural pond and lowest found in collapsible pond. Alkalinity ranged from 105 to 245 mg/L with the highest obtained in collapsible pond and lowest recorded in natural pond. Weeks 1 and 12 recorded the highest and lowest Cu2+ concentra-tions respectively in all ponds, while lowest and highest alkalinity were obtained in weeks 1 and 12 respectively in all the ponds. The trend in the copper concentra-tions in the ponds is Collapsible pond < Concrete tank < Earthen pond < Natural pond. The bedrock geology of the natural and earthen ponds was found to have a slight high amount of copper. There was a significant difference (p < 0.05) in the concentrations of copper among the four ponds and there was positive correla-tion between the alkalinity and pH, while negative cor-relations were observed between copper and tempera-ture and pH in the ponds.
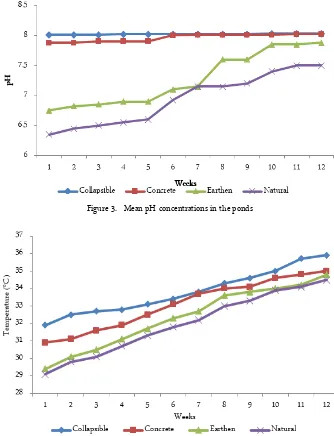
There were temperature and pH fluctuations in the four ponds, with temperature and pH ranging from 29.1 to 35.9°C and 6.35 to 8.03 respectively, with the highest temperature and pH recorded in the collapsible pond in week 12 and lowest temperature and pH found in natural pond in week 1. There was significant difference (p < 0.05) in temperature and pH among the four ponds. The temperature and pH followed seasonal pattern with lowest temperatures and pH recorded in February corresponding to the end of rainy season and highest temperatures and pH recorded in April corre-sponding to the dry season. This scenario is also seen in the alkalinity and copper concentrations in the ponds.
The general pattern of measured factors in the ponds showed that as pH and temperature increase, al-kalinity also increases while copper concentration de-creases. The effects of elevated copper concentrations on the fish species C. gariepinus were found on the morphological and behavioral changes observed in them especially in natural and earthen ponds. These include slimy mucus on the skin, aggressive and unco-ordinated swimming activity and movement, sparkled opercula, slow growth, and gasping.
The source of slight high copper concentrations ob-served in both natural and earthen ponds were from the bedrock geology of the area which had high amount of copper. Anthropogenic sources into ponds are rules out because the ponds were located in areas where there are no mining and agricultural activities as well as municipal or industrial wastes discharges into RESULTS AND DISCUSSION
the ponds. The high pH and alkalinity in the collapsi-ble and concrete ponds were responsicollapsi-ble for the low copper concentrations recorded in them as compared to earthen and natural ponds, while low pH and alka-linity as well as the bedrock of the source water in earthen and natural ponds could be responsible for the slight high copper concentrations observed in the two ponds. According to [7] alkalinity, pH and temperature are responsible for determining copper solubility and toxicity in water, while [8] reported that copper con-centration of water is highest when the pH is low. Sim-ilarly, the same scenario was observed for temperature. This explains the negative correlation of copper with pH and temperature. The interrelationship between copper toxicity with pH and temperature however
needs further investigation as little is known about the interrelationship. The presence of organic and inor-ganic compounds might be also responsible for the low concentration of copper in these ponds. The ab-sorbance of copper though in minute quantity from the ponds by the fish for binding to -globulin and then transported to the various tissues of the body [9] as well as its use as dietary requirement could also explain the reduction in concentrations of the element in the different ponds over time.
Although, numerous and disparate tolerable, safe and toxicity levels has been established for copper on fish. [10] reported that copper concentration above 0.02 mg/L is toxic to fish, [11] reported acute toxicity at 0.01 – 0.02 mg/L, [1] observed that concentration of
JTLS | J. Trop. Life. Science 156 Volume 6 | Number 3 | September| 2016
Figure 1. Mean copper concentrations in the ponds
Figure 2. Mean alkalinity in the ponds
between 0.004-0.01 mg/L of copper will have sub lethal effect to fish and aquatic food chain, while [12] re-ported a copper concentration of 0.767 – 0.991 mg/L as having lethal concentration with 10-20% of C. gariepinus exposed to the element dead in 96 hours. The levels of copper toxicity in the ponds were slightly elevated above the references. This could have come from the pipes used in delivering water to the pond, copper alloy nets used in harvest, copper alloy mesh used for the ponds, anti-fouling agents containing cop-per compounds used in controlling organisms that im-pair the flow of water, algaecides and parasiticides con-taining copper compounds used in killing alga and par-asites, the pond water source and especially fish meal for feeding the fish.
Although, toxicity of copper to fish depends on the species, age of the fish and length of exposure. The fish species C. gariepinus in the different aquaculture ponds showed copper toxicity as seen in the morpho-logical and behavioral changes observed in them. These include, slimy mucus on the skin which could make the fish susceptible to diseases and pathogens, aggres-sive and uncoordinated swimming activity and move-ment probably resulting from muscle spasms, with the opercula sparkled, slow growth provably resulting from loss of appetite on account of reduced odor perception of food, water bubbles on the ponds likely occurring as a result of difficulty in breathing. All these effects have also been reported by [1, 13], and several other work-ers on different fish species exposed to different levels Figure 3. Mean pH concentrations in the ponds
of copper concentrations.
These effects were as a result of bio availability of the elevated copper in the ponds to the fish which re-sulted in bio concentration and bioaccumulation of the element over time (i.e. length of exposure) right from the fingerlings stage which was the stage of stocking in the ponds to the adult stage which was the stage at which the measurements were made. Thus, it can be deduced that C. gariepinus is sensitive to copper toxic-ity even at small elevation above the normal back-ground level. This observation has also been reported by [7, 12, 14] in the fish species.
Copper concentrations in these ponds should be regularly measured especially in the natural and earthen ponds in order to maintain the safe limit and toxicity level of copper concentrations in aqua cultural ponds. Also, bio monitoring of copper concentration in the ponds will help in adjusting the amount of copper to be included in feed since dietary copper is an impor-tant route that results in toxicity to fish than water borne copper. These will help in the copper manage-ment of the ponds and fish cultured in them.
Fishes stocked in the ponds that showed the effects of elevated copper should be removed and stocked in a new pond where copper concentration of the water is low. This will correct the morphological and behavioral changes seen in the fish species.
-1. Eisler R (1998) Copper hazards to fish, wildlife, and inver-tebrates: a synoptic review. U.S.Geological Survey, Biolog-ical Resources Division, BiologBiolog-ical Science Report. 2. U.S. Environmental Protection Agency (1980) Ambient
water quality criteria for copper. U.S. EPA Report. 440/5-80-036.
3. Betzer SB, Yevich PP (1975) Copper toxicity in Busycon canaliculatum L.. Biol Bull 148: 16-25.
4. Hall WS, Bushong SJ, Hall Jr LW, Lenkevich MS, Pinkney AE (1988) Monitoring dissolved copper concen-trations in Chesapeake Bay, U.S.A. Environ. Monit Assess 11: 33-42.
5. Murai T, Andrew JW, Smith G (1981) Effects of dietary copper on channel catfish. Aquaculture 22: 353-7. 6. Gatlin DM, Wilson RP. (1986) Dietary copper
require-ment of fingerling channel cattish. Aquaculture 54: 277-85.
7. Olaifa FE, Olaifa AK, Onwude TE (2004) Lethal and sub-lethal effects of copper to the African Catfish (Clarias gariepinus) juveniles. Afr J Bio Res 7: 65 -70.
8. Dartman J, Sadhowsky B, Dorsch T, Johansen K (2010) Copper corrosion in drinking water systems – effects of pH and phosphate dosage. Mater corros 61(3): 189- 98. 9. Aaseth J, Norseth T. (1986). Copper. In: Handbook on
the toxicity of metals. Vol. II: Specific metals. 2nd Edi-tion. Friberg L. Nordberg GF, Vouk EB (Eds). Elsevier. New York.
10. Bradl H (2005) Heavy metals in the environment: origin, interaction and remediation. Elsevier/Academic Press. London.
11. National Academy of Sciences (NAS) (1977) Copper. Committee on medical and biological effects of environ-mental pollutants, National Research Council. National Academy of Sciences. Washington, D.C.
12. van der Merwe M, van Vuren JHJ, du Preez HH (1993) Lethal copper concentration levels for Clarias gariepi-nus —a preliminary study. Koedoe 36: 77-86.
13. Richey D, Roseboom D (1978) Acute toxicity of copper to some fishes in high alkalinity water. ISWS Circular 131. 14. Oronsaye JAO, Ogunbor EO (1998) Toxicity of Copper
to Oreochromis niloticus fingerling in Ikpoba River water. Ind J Ani Sci 68 (9): 1001 – 1003.
JTLS | J. Trop. Life. Science 156 Volume 6 | Number 3 | September| 2016
CONCLUSION
ACKNOWLEDGMENT
REFERENCES