http://dx.doi.org/10.17503/Agrivita-2014-36-2-p153-159
PERFORMANCE OF ACID-ADAPTIVE SOYBEAN EXPECTED
LINES IN SOUTH
LAMPUNG, INDONESIA
Heru Kuswantoro1*), Febria Cahya Indriani1), Nia Romania Patriawaty1),
Apri Sulistyo1), Won Young Han2), Poong Yeon Lee3), Yang Hee Cho4) and In Youl Baek2) 1)
Indonesian Legume and Tuber Crops Research Institute Indonesian Agency for Agricultural Research and Development
Jl. Raya Kendalpayak Km. 8. Po Box. 66 Malang East Java 65101 Indonesia 2)
Legume and Oil Crop Research Division. National Institute of Crop Science. Rural Development Administration. 20th, Jeompiljaero, Miryang, Gyeongnam. Korea.
3)
International Technology and Transfer Cooperation Center Rural Development Administration 126th, Suinro, Suwon, Gyeonggi. Korea 4)
Korea Project on International Agriculture Group. Rural Development Administration. 126th, Suinro, Suwon Korea
*) Corresponding author Phone: +62-341-801468 E-mail: [email protected]
Received: May 7, 2014 /Accepted: July 10, 2014
ABSTRACT
Acid soil area is one of the areas broadly available in Indonesia. However, the complexity of acid soil may lead to low soybean productivity. Hence, soybean variety which is adaptive to acid soil is needed. The objective of this research was to find out expected lines adaptive to acid soil. A number of ten soybean lines and two check varieties were grown in Natar Research Station in dry season II, 2011. This research applied randomized completely block design with four replications. Results showed that 7 of 10 soybean lines had grain yield higher than those of two check varieties. The three lines with the highest grain yield were Tgm/Anj-957, Tgm/Anj-908 and Tgm/Anj-932 with grain yield 1.83, 1.74, and 1.65 t ha-,1 respectively. Tanggamus variety had grain yield higher than Wilis. The highest grain yield line, Tgm/Anj-957, was also supported by the highest number of pods per plant up to 68 pod. Line of Tgm/Anj-995 was the line with the largest seed size, i.e. 16 g per 100 seeds.
Keywords: acid soil, expected lines, Glycine max, yield
INTRODUCTION
Increasing soybean demand is not able to be fulfilled by domestic production, and lead the
increasing soybean import. The decline in soybean production was mainly due to a decrease in harvesting area up to 8.04% in the period of 1994-1997 and 7.91% in the period of 1997-2006 (Supadi, 2009 and Zakaria, 2010). The decreasing of harvesting area in Java Island is due to the land conversion of agricultural land into non-agricultural land. Hence, the expansion of harvesting area should be conducted outside Java Island. However, the lands outside Java Island are usually a suboptimal land that has soil fertility problems. One suboptimal land is dry land which covers 102,817,113 ha. This means that approximately 69% of dry land in Indonesia is acid soil (Mulyani, 2006).
The problem in acidic soil can be divided into two groups, namely micro nutrients toxicity (Al and Mn) and macro nutrients defficiency (N, P, K, Ca, Mg and Mo) as well as the detrimental effect of H+ ion. In addition, the population of beneficial micro-organisms such as nitrifying bacteria is also low (Kresović et al., 2010). Soil acidity can be corrected by liming which aims to increase crop production, but it is not be able to be applied economically to soybean farming for farmers with low income levels (Uguru et al., 2012). Therefore, it is needed some alternative ways to increase crop production on acid soils.
Genetic improvement of plant adaptation to soil acidity is an approach that is inexpensive and easy to be implemented. Research activities have been carried out, from the development of
screening techniques in the laboratory (Liao et al., 2006; Villagarcia et al., 2001), screening germplasm in laboratory (Ojo and Ayuba, 2012a; 2012b) and screening germplasm in the field (Ojo et al., 2010); genetic studies (Kuswantoro et al., 2011;Ojo and Ayuba, 2013), development of molecular markers (Tasma and Warsun, 2009), gene expression (Duressa et al., 2011), selection of segregating populations (Spehar and Souza, 2006), response of genotypes (Uguru et al., 2012) and genetic gain (Kuswantoro et al., 2013). The study of adaptation mechanisms involving soybean phosphorus absorption in acidic soil also has been done (Bertham and Nusantara, 2011). Basically, the above studies refer to changes in the expression of soybean genotypes in the targeted environment, in this case soil acidity.
Performance of a plant in an environment is a result of the genetic and the environment factors. Ussually, different environment lead different performance of a genotype, but some genotypes can have similar performance in different environment. Therefore, the genetics expression of a phenotype depends on its environment. The phenotype of a genotype is not necessarily the same when the agro-ecological conditions are different (Ali et al., 2003).
In a breeding program, performances of genotypes across environments is conducted to find out stable genotypes. Hence, testing some genotypes in diverse environments is critical to ensure that the selected genotypes have acceptable appearance in a different environment in the targeted areas, testing the diverse environment is essential (Ashraf et al., 2010). In this study, the aim of the research was to evaluate the soybean expected lines in acidic soil of South Lampung, where the soil properties is relatively similar in this area. Therefore, the result of this study is expected to obtain acid-adaptive soybean expected lines in an area with the similar soil properties of South Lampung.
MATERIALS AND METHODS
A total of 10 soybean lines and two check varieties (Wilis and Tanggamus) were grown in acid soil of South Lampung. The tested soybean lines are the result of a crossing between
varieties of Tanggamus and Anjasmoro. Tanggamus is soybean varieties with good adaptation ability in acid soil, while Anjasmoro is a variety with large soybean seed.
The experiment was conducted at Natar Research Station, South Lampung in Rainy Season II 2011. Randomized completely block design was used with four replications. Plot was made with the size of 2.4 m × 4.5 m with plant spacing of 0.4 m × 0.15 m, two plants per hill. Soil tillage was applied by plowing the soil, and it was leveled with a rake. Fertilizer was done by applying 50 kg Urea, 75 kg SP36 and 75 kg KCl per hectare at sowing time. Weeding was carried out in 2 and 4 weeks after planting (WAP) to prevent excessive growth of weeds. Pests and diseases were intensively controlled by monitoring their existence. Harvesting was conducted after the crop was physiological matured, shown by yellowing or browning of the pods and falling of the leaves.
Variables measured for this experiment were 50% days of flowering age, maturity age, plant height, number of branches, number of reproductive nodes, number of pods, 100 seed weight and seed yield. Differences among the lines in each variable were tested using the F test at 5% significance level. Significantly different variables were then tested further by Least Significant Difference test (LSD). The entire statistical analysis was performed using PKBT Stat software.
RESULTS AND DISCUSSION
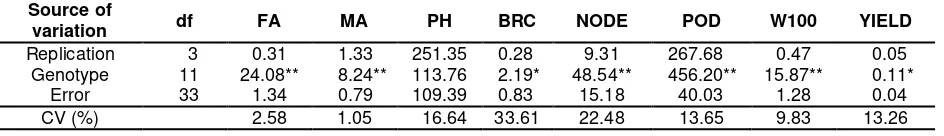
Table 1. Analysis of variance of agronomic characters of acid-adaptive soybean lines Remarks: **Significant at 1% level, *Significant at 5% level. FA = days to flowering, MA = days to maturing, PH =
plant height, BRC = number of branches, NODE = number of reproductive nodes, POD = number of pods, W100 = weight of 100 seeds, YIELD = yield per hectare
Maturity of the tested lines averaged 84 days with a range of 81-86 days. Tgm/Anj-995 showed the earliest maturity age, while Tgm/Anj-931 showed the latest maturity age. The earliest mature line of Tgm/Anj-995 also showed earlier days). Therefore, the tested lines were classified as medium maturity age.
Table 2. Flowering and maturity age of
acid-same column were not significantly different at LSD 5%.
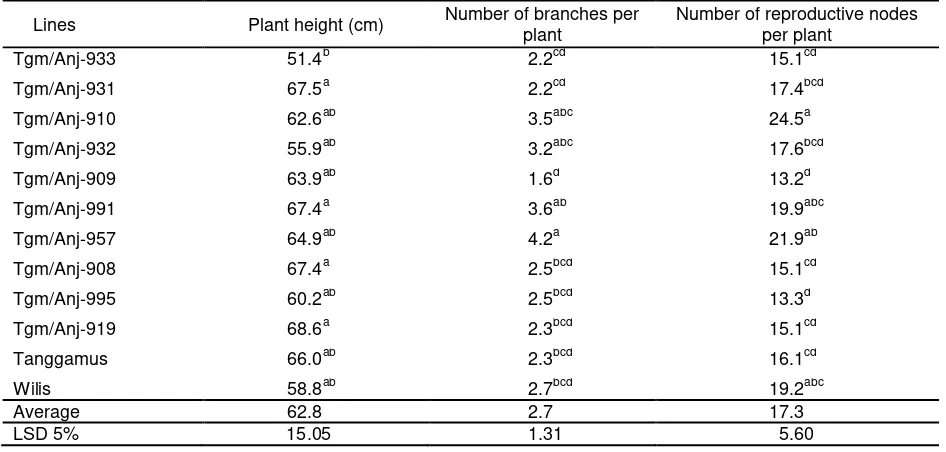
The tested lines had average plant height of 62.83 cm with a range of 51.4 - 68.6 cm. The acid-tolerant variety Tanggamus showed plant height of 65.95 cm. There were four lines which
had higher plant height than Tanggamus, namely 931, 991, Tgm/Anj-908, and Tgm/Anj-919. The broad adaptive variety of Willis had a plant height of 58.8 cm. There were four lines which had higher plant height than Wilis, namely Tgm/Anj-995, Tgm/Anj-957, Tgm/Anj-909, and Tgm/Anj-910 (Table 3). One of the selection criteria for acid-adaptive soybean lines is plant height. It is due to the vegetative growth of stressed plants which will be hampered by micro nutrient toxicity as well as macro nutrients deficiency (Kuswantoro et al., 2013). Four lines having higher plant higher than average branch and check varieties were Tgm/Anj-910, Tgm/Anj-932, Tgm/Anj-991, and Tgm/Anj-957. Tgm/Anj-957 line had the most branches with a mean number of 4.2 branches (Table 3). The number of branches followed by the number of reproductive nodes were expected to contribute to the yield. This was supported by Tgm/Anj-957 line that had the highest number of branches, and many number of reproductive nodes showed the highest pod number and seed yield than other lines. According to Wirnas et al. (2006), the number of branches is one of the agronomic traits that had positive and highly significant correlation with seed yield per plant in soybean. The number of branches belongs to a character that had high broad sense heritability values (Indriani et al., 2012).
respectively. This number of reproductive nodes per plant was much more than those reported by Rauf (2010) implying that the number of reproductive Willis and Tanggamus only had 8 and 7 reproductive nodes, respectively. There were three lines having the number of reproductive nodes per plant higher than the check varieties, namely 910, Tgm/Anj-991, and Tgm/Anj-957. Line of Tgm/Anj-910 had the highest number of reproductive nodes per plant (Table 3).
Character of pods number is a supporting character to the weight yield per plot. This was demonstrated by Tgm/Anj-957 which had the highest number of pods and also the highest crop yields. According to Sumarno and Zuraida (2006), the total number of pods was positively correlated to seed weight per plant. In this study, the average number of pods per plant was 48 with a range between 25-68 pods. Lines of Tgm/Anj-957 and Tgm/Anj-991 had the number of pods per plant higher than the check varieties (Tanggamus and Wilis). Willis had 55 pods per plant and Tanggamus had 51 pods per plant (Table 4). In acidic soil Manokwari, Tanggamus
could produce 995 – 114 pods per plant (Rauf, 2010). Generally, the tested lines had fewer numbers of pods than the check varieties. The small number of pods was due to the acidity of the soil as well as the less availability of water, where this condition is common in acid soil (Kuswantoro and Zen, 2013).
Weight of 100 seeds of soybean indicated seed size. Weight of 100 seeds of the tested lines averaged 11.53 g with a range of 10.16 to 16.00 g (Table 4). Tanggamus and Willis had weight of 100 seeds 8.45 and 9.39 g respectively. According to Adie and Krisnawati (2007), soybean is categorized as large (14 g per 100 seeds) medium (10-14 g per 100 seeds), and small (less than 10 g per 100 seeds). Therefore, Tgm/Anj-995 was classified as large seeded line and nine other lines were classified as medium seeded lines. However, all of ten tested lines showed larger seed size than the check varieties. Seed weight is one of the important agronomic traits for the tempeh industry, where they usually prefer large seed for making tempeh (Krisdiana, 2007).
Table 3. Plant height, number of branches and number of reproductive node of acid-adaptive soybean lines
Lines Plant height (cm) Number of branches per plant
Number of reproductive nodes per plant
Tgm/Anj-933 51.4b 2.2cd 15.1cd
Tgm/Anj-931 67.5a 2.2cd 17.4bcd
Tgm/Anj-910 62.6ab 3.5abc 24.5a
Tgm/Anj-932 55.9ab 3.2abc 17.6bcd
Tgm/Anj-909 63.9ab 1.6d 13.2d
Tgm/Anj-991 67.4a 3.6ab 19.9abc
Tgm/Anj-957 64.9ab 4.2a 21.9ab
Tgm/Anj-908 67.4a 2.5bcd 15.1cd
Tgm/Anj-995 60.2ab 2.5bcd 13.3d
Tgm/Anj-919 68.6a 2.3bcd 15.1cd
Tanggamus 66.0ab 2.3bcd 16.1cd
Wilis 58.8ab 2.7bcd 19.2abc
Average 62.8 2.7 17.3
Table 4. Number of pods, 100 seed weight and yield of acid-adaptive soybean lines
Lines Number of pods per plant 100 seeds weight (g) Yield (t ha-1)
Tgm/Anj-933 46.6cde 13.83b 1.51bc
Tgm/Anj-931 41.4de 10.99cde 1.55abc Tgm/Anj-910 48.7cde 10.72cde 1.41cd Tgm/Anj-932 49.4cd 10.16de 1.65abc
Tgm/Anj-909 39.7e 11.67cd 1.59abc
Tgm/Anj-991 59.8ab 12.35bc 1.61abc
Tgm/Anj-957 68.4a 10.89cde 1.83a
Tgm/Anj-908 48.3cde 11.86c 1.74ab
Tgm/Anj-995 25.0f 16.00a 1.47bcd
Tgm/Anj-919 48.5cde 12.05c 1.36cd
Tanggamus 51.4bc 9.39ef 1.47bcd
Wilis 54,7bc 8.45f 1.21d
Average 48,5 11.53 1.53
LSD 5% 9.10 1.63 0.29
Remarks: Values followed by the same letters in the same column were not significantly different at LSD 5%.
The average yield of genotypes per hectare was 1.53 t ha-1 with a range of 1.36-1.83 t ha-1, while Willis and Tanggamus had 1.21 and 1.47 t ha-1 (Table 4). Yield potential of Tanggamus in acidic soil with two plants per hill reached 1.22 t ha-1, while the averaged yield of Willis in optimal land was 1.6 t ha-1. Seven lines had higher seed yield than the check varieties, i.e. Tgm/Anj-933, Tgm/Anj-931, Tgm/Anj-932, Tgm/Anj-909, Tgm/Anj-991, Tgm/Anj-957, and Tgm/Anj-908. Line of Tgm/Anj-957 showed the highest seed yield (1.83 t ha-1), this line also had the highest number of pods. This indicated that number of pods contributed to the yield per plant, and lines with the highest yield showed an adaptation to acid soil condition. Character of seed yield had high broad sense of heritability (0.89) (Indriani et al., 2012),meaning that genetic factors are more important than the environment.
CONCLUSION AND SUGGESTIONS
Seven lines had higher seed yield than the check varieties. Tanggamus varieties had higher yields than Willis. Line of Tgm/Anj-957 had the highest yield (1.83 t ha-1) with the highest number of pods (68 pods). Line of Tgm/Anj-995 had the largest grain size (16 g per 100 seeds). The seven lines, especially Tgm/Anj-957, could be developed as acid-adaptive soybean in South Lampung.
ACKNOWLEDGEMENTS
This research was funded by the South Korean government through AFACI (Asian Food and Agriculture Cooperation Initiative) project. Thanks are addressed to Mr. Agus Supeno and Natar RS staffs for their assistance in the research.
REFERENCES
Adie, M.M. 2007. Individual testing guide, novelty, uniqueness, uniformity and stability of soybean. (in Indonesian). Plant Variety Protection Center. Ministry of Agriculture Republic of Indonesia. pp.12.
Adie, M.M. and A. Krisnawati. 2007. Biology of soybean. p. 45 – 73. In Sumarno et al. (Eds). Soybean: Production and development techniques. (in Indonesian). Indonesian Center for Food Crops Research and Development, Bogor. Ali, N., F. Javidfar and Y. Mirza. 2003. Selection
of stable rapeseed (Brassica napus L.) genotypes through regression analysis. Pak. J. Bot. 35:175-183.
Bertham, Rr.Y.H. and A.D. Nusantara. 2011. The adaptation mechanism of new soybean genotypes in uptake the nutrient phosphorus from mineral acid soil. JAI 39(1): 24-30. http://journal.ipb.ac.id/index. php/jurnalagronomi/article/view/3272 Duressa, D., K.M. Soliman, R.W. Taylor and D.
Chen. 2011. Gene expression profiling in soybean under aluminum stress: genes differentially expressed between Al-tolerant and Al-sensitive genotypes. Amer. J. Mol. Bio. 1:156-173. http://www. scirp.org/journal/PaperInformation.aspx? paperID=7780#.U2mym6KfuSo
Indriani, C.I., H. Kuswantoro., N.R. Patriyawaty and A. Supeno. 2012. Variability and heritability of acid-tolerant soybean lines. (in Indonesian). p. 78-85. In Widjono A., Herman, N. Nugrahaeni, A.A. Rahmianna, Suharsono, F. Rozi, E. Ginting, A. Taufiq, A. Harsono, Y. Prayogo, and E. Yusnawan (Eds). Proceedings of the National Seminar on Research Results of Legume and Tuber Crops in 2011. (in Indonesian). Malang 15 November 2011.
Kresović, M., M. Jakovljević, S. Blagojević, and B.
Žarković. 2010. Nitrogen transformation
in acid soils subjected to ph value changes. Arch. Biol. Sci. 62:129-136. http://www.doiserbia.nb.rs/img/doi/0354-4664/2010/0354-46641001129K.pdf Krisdiana, R. 2007. Tempeh and tofu industry
preferences to size and color of soybean seed (in Indonesian). Iptek Tanaman Pangan 2:123-130. http://pangan.litbang. deptan.go.id/iptek-pangan-pp.418. Kuswantoro, H., N. Basuki and D.M. Arsyad.
2011. Inheritance of soybean pod number trait on acid soil. J. Agrivita. vol 33 (2):119-126. http://agrivita.ub.ac.id/ index.php/agrivita/article/view/53
Kuswantoro, H. and S. Zen. 2013. Performance of acid-tolerant soybean expected lines in two planting seasons. Inter. J. Biol. 5:49-56. http://www.ccsenet.org/journal/index. php/ijb/article/view/27472
Kuswantoro, H., D.M. Arsyad and Purwantoro. 2013. Characteristics of soybean that tolerant to acid soil. (in Indonesian). Buletin Palawija 25:1-10.
Liao, H., H. Wan, J. Shaff, X. Wang, X. Yan and L.V. Kochian. 2006. Phosphorus and aluminum interactions in soybean in
relation to aluminum tolerance, exudation of specific acids from different regions of the intact root system. Plant Physiology 141:674-684. http://www.plantphysiol.org/ content/141/2/674.long
Mulyani, A. 2006. Potency of Acidic Dryland for Agricultural Developing. (in Indonesia). Warta Penelitian dan Pengembangan Pertanian 28:16-17.http://pustaka.litbang. deptan.go.id/publikasi/wr282069.pdf Ojo, G.O.S., L.L. Bello and M.O. Adeyemo. 2010.
Genotypic variation for acid stress tolerance in soybean in the humid rain forest acid soil of south Eastern Nigeria. J. Appl. Biosci 36:2360-2366. http://www. m.elewa.org/JABS/2010/36/5.pdf
Ojo, G.O.S. and S.A. Ayuba. 2012a. Screening of tropically adapted soybeans for alu-0minium stress tolerance in sand culture. J. Appl. Biosci. 53:3812-3820. http:// www.m.elewa.org/JABS/2012/53/9.pdf Ojo, G.O.S. and S.A. Ayuba. 2012b. Screening of
tropically adapted genotypes of soybean (Glycine max (L.) Merrill) for aluminium stress tolerance in short-term hydro-ponics. Journal of Animal and Plant Sciences 14:1921-1930. http://www.m. elewa.org/JAPS/2012/14.2/1.pdf
Ojo, G.O.S. and S.A. Ayuba. 2013. Combining ability and heterosis for aluminium stress tolerance of soybean roots and shoots grown in acid sand culture. J. Plant Breed. Crop Sci 5:6-11. http://www. academicjournals.org/journal/JPBCS/arti cle-abstract/9196FBF1383
Rauf, A.W. 2010. Multilocation trials 5-6 expected lines of rice and soybean with productivity> 20% of the existing condi-tions in the province of West Papua. Research Report. Applied Research Incentive Program. (in Indonesian). Assessment Institute for Agricultural Technology West Papua. http://km.ristek. go.id/assets/files/KEMTAN/761%20D/761. pdf
Spehar, C.R. and L.A.C. Souza 2006. Selection for aluminum tolerance in tropical soy-beans. Pesquisa Agropecuária Tropical 36:1-6.
http://pse.litbang.deptan.go.id/ind/pdffiles/ ART7-1e.pdf
Sumarno and N. Zuraida. 2006. Correlative and causative relationship between yield components and seed yield. (in Indonesian). Penelitian Pertanian Tana-man Pangan 25(1):38-44. http://pangan., litbang.deptan.go.id/tanaman pangan-282.html
Tasma, I.M. and A. Warsun. 2009. Genetic diversity analysis of aluminum-toxicity tolerant and sensitive soybean genotypes assessed with microsattelite markers. Jurnal AgroBiogen 5:1-6.
Uguru, M.I., B.C. Oyiga and E.A. Jandong. 2012. Responses of some soybean genotypes to different soil pH regimes in two planting seasons. The African Journal of Plant Science and Biotechnology 6:26-37. http://www.zef.de/module/register/media/2 7c6_AJPSB_6%281%2926-37.pdf
Villagarcia, M.R, T.E. Carter, T.W. Ruftya, A.S. Niewoehnera, M.W. Jennettea and C. Arrellanoc. 2001. Genotypic Rankings for Aluminum Tolerance of Soybean Roots Grown in Hydroponics and Sand Culture. Crop Sci. 41:1499-1507. https://www. crops.org/publications/cs/abstracts/41/5/1 499?access=0&view=pdf
Wirnas, D., I. Widodo, Sobi, Trikoesoemaningtya and D. Sopandie. 2006. Selection of agronomic characters for developing index selection on F6 generation of 11 soybean population. (in Indonesian). Bul. Agron. 34(1):19-24. http://repository. ipb.ac.id/handle/123456789/35569 Zakaria, A.K. 2010. Soybean agribusiness