Factors That Affect the Financial Performance of the Manufacturing
Companies Listed on The Indonesia Stock Exchange
Evia Kurniawati1*, Kartika Hendra Titiari2, Siti Nurlaela3 123
Fakultas Ekonomi Progam Studi Akuntansi Universitas Islam Batik Surakarta Jl.KH.Agus Salim No. 10, Surakarta 57147 Jawa Tengah, Indonesia
*Email: [email protected]
Abstract : This study examined the influence of Current Ratio, Debt To Equity Ratio, and Total Asset Turnover against the financial performance of the company stated in the Return On Assets on the manufacturing companies listed on the indonesia stock exchange. Sample from this research is as much as 84 manufacturing companies listed on the indonesia stock exchange. Types of data used are secondary data that comes from the Indonesia Capital Market Directory (ICMD). Results descriptive statistics showed that an increase in the company's financial performance, which if viewed from the perameternya the company's financial performance more done parameter Current ratio. Based on the correlation analysis shows the Current Ratio effect significantly to Return On Assets, Debt To Equity Ratio was not significant effect against the Return On assets, and Total Asset Turnover effect significantly to Return On Assets. Based on regression analysis, we find that variable Current Ratio, Debt To Equity Ratio, and Total Asset Turnover effect significantly to the financial performance of the company stated in the Return On Assets.
Keywords: Company Financial Performance, Return On Asset, Current Ratio, Debt to Equity Ratio, Total Asset Turnover
1. INTRODUCTION
The company is an organization that was formed with the goal of maximizing profits. Growing number of competitors, the company is required to maintain and improve its performance in managing and processing resources are owned by the company.
According to Fahmi (2011) financial performance analysis is conducted to see the extent to which a company has done with the use of the financial implementation of the rules properly. The company's financial performance can be analyzed using financial ratios.
According to Kasmir (2010) financial ratios is an activity comparing the figures in the financial statements made by dividing one number by another number. It is done between the components of the financial statements
contained in several periods. For investors, the financial performance is very important because it can be used as a benchmark in taking investment decisions.
Current Ratio is the ratio that shows the company's ability to pay short-term debt. The higher total assets current liabilities against smooth then the greater the confidence that current liabilities will be paid. The research of Selcuk (2016); Dalyeen (2017); Arisadi & Djazuli (2013); Azizah (2016); Ayani et al (2016) and Noor (2011) indicates that the current ratio has a positive impact on the return on assets, but contrary to the Khalifa & Shafii (2013) and Pramesti et al (2016) suggested that the current ratio has no effect against the return on asset.
Debt to Equity Ratio is the ratio that shows how big the capital itself in ensuring debt, both short term and long
term. The lower the debt to equity ratio indicates that the higher the level of funding provided the owners will certainly have an impact on the financial performance of a company. Research results Dalyeen (2017); Arisadi & Djazuli (2013); Azizah (2016); Ayani et al (2016) and Martini (2016) showed that there were significant effects from debt to equity against the financial performance of the company. sales. Research results Martini (2016); Esthirahayu et al (2014); Noor (2011), Pramesti et al (2016) shows that the total asset turnover positive effect against the return on assets.
This research aims to find out whether the Curret Ratio, Debt to Equity Ratio, and Total Asset Turnover effect on the financial performance of the company (return on asset). This research is expected to be one of the sources of information and consideration for the company in financial performance predicts in one company.
2. METHODOLOGY
Of the type of research used in this research is quantitative research. The dependent variable in this study is the Return On Assets. The independent variable in this study is the Current ratio, Debt to Equity ratio, Total Asset Turnover. The source of the data in this study is secondary data, i.e. the financial report of manufacturing companies listed on the Indonesia stock
exchange 2014-2015 the period published by the Indonesia Capital Market Directory (ICMD) on the official website of the stock exchange Indonesia namely www.idx.co.id.
The population in this research is 144 manufacturing company. Sampling method in this study using a purposive sampling. Criteria peusahaan the sample in this study are: 1) the Manufacturing Companies listed on the Indonesia stock exchange (idx) of the period of 2014-2015. 2) The company's categorization is based on the publication of the Indonesia Capital Market Directory (ICMD) 2014-2015. 3) manufacturing company which publishes financial reports on an ongoing basis in research. manufacturing companies that have positive earnings in the period of the study.
In this study using the method of analysis that is 1) descriptive statistics. 2) Classic Assumption Test. Test using a Normality test IE the kolmogorov-smirnov, by looking at the value of significance, if the value of significance 0.05 > data can be inferred then distributed normally.
Test of autocorrelation i.e. using runs test, by looking at the value of significance, if the value of significance 0.05 > then can be summed up in the regression model are not symptoms of autocorrelation.
Multicollinearity test by seeing great value VIF (Variance Inflation Factor) and Tolerance ", if the value is below 10 and the enormity of VIF value tolerance above 0.01 then it can be inferred that no symptoms of multicollinearity in regression models.
regression model. 3) linear multiple regression analysis with the following equation:
Y = a + b1CR + b2DER + b3TATO + e
Description:
Y = financial performance (ROA) a = integer constants
X 1 = Current Ratio
X 2 = Debt to Equity Ratio X 3 = Total Asset Turnover e = Error
Feasibility test model (F Test) and see the significance, if the value of significance 0.05 <, there are influences
between variables independent of the dependent variable.
Hypothesis test (test t) and see the significance, if the value of significance 0.05 <, there are partial in influences between variables independent of the dependent variable.
3. RESULTS AND DISCUSSION
Based on the method of purposive sampling, samples obtained as many as 84 manufacturing companies listed on the Indonesia stock exchange (idx) during the years 2014-2015, so the data retrieved as many as 168 observational data.
3.1 Descriptive Statistic Test Results
Table 1. Test Results Of Descriptive Statistics
Ratio N Max Min Mean Std. Deviasi
ROA 168 40,18 0,04 7,6123 7,73805
CR 168 967,73 45.03 231,7987 166,03349
DER 168 7,99 -4,93 0,9546 1,17549
TATO 168 3,95 0,03 1,0635 0,58684
Based on the table above, it can be noted that Current ratio (X 1) to the value of the maximun of 967.73, the minimum value of 45.03, the average value of 231.7987 and nllai standard deviation of 166.03349. Variable Debt to Equity Ratio (X 2) maximun value amounted to 7.99, the minimum value of-4.93, average value of 0.9546 and the value of the standard deviation of
1.17549. Variable Total Asset Turnover (X 3) value maximum of 3.95, the value of 0.03, minimum average value of 1.0635 and value standard deviation of 0.58684. Return On Asset (Y) value of the maximun value of 40.18, a minimum of 0.04, average value of 7.6123 and the value of the standard deviation of 7.73805.
3.2 A Classicl Assumptions Test Results
Test of Normality
Table 2. Normality Test Results
Ket Asymp. Sig (2-tailed) Α Description
Uji (K-S) 0,742 0,05 Normal distributed
Based on table 3 results of test of normality indicate that variable unstandardized residual value for sig 0.742 IE greater than (> 0.05), it can be
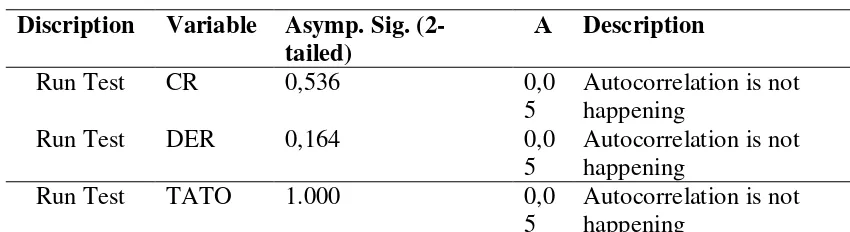
Autocorrelation test
Table 3. Autocorrelation Test Results
Discription Variable Asymp. Sig. (2-tailed)
Α Description
Run Test CR 0,536 0,0
5
Autocorrelation is not happening
Run Test DER 0,164 0,0
5
Autocorrelation is not happening
Run Test TATO 1.000 0,0
5
Autocorrelation is not happening
Based on the table above, the results of the test demonstrating that the autocorrelation of the whole variable p
value 0.05 >, meaning this is not the case so the autocorrelation can be used as research data.
Multicollinearity Test
Table 4. Multicollinearity Test Results
Variable Colinierity Statistic Description Tolerance VIF
CR 0,885 1,130 There is no problem of multicollinearity DER 0,790 1,266 There is no problem of multicollinearity TATO 0,882 1,134 There is no problem of multicollinearity
Based on the table above shows that the independent variable has a value of tolerance more than 0.01 (10%), meaning that there is no correlation between the variables. The results of the above calculation shows
that the variable has a value of less than 10 VIF. Thus it can be concluded that
there are no symptoms of
multikoleniaritas regression models are used.
Test Heteroskedastisitas
Table 5. Heteroskedastisitas Test Results
Variable Sig Α Description
CR 0,860 0,05 Not the case heteroskedastisitas DER 0,703 0,05 Not the case heteroskedastisitas TATO 0,089 0,05 Not the case heteroskedastisitas
Based on the table above, it can be concluded that the above research has value Sign > 0.05, so that can be
inferred is not happening
Multiple Linear regression test
Table 6. Multiple Linear Regression Test Results
Keofisien thitung Sig
Constanta 0,700 0,500 0,618
CR 0,009 2.753 0,007
DER -1.066 -2.076 0,039
TATO 5.395 5.541 0,000
Based on the results of the regression analysis can be composed of equations as follows:
ROA = 0.700 + 0.009 X 1-x 2 + X 3 5.395
Interpretation of these equations are as follows :
a = 0.700, is positive meaning in the Current Ratio, Debt to Equity Ratio, and Total Asset Turnover is increased one unit changes to the financial performance of
manufacturing companies
registered in BEI years 2015 will be up by 0.700 one unit.
b = 0.009, is positive it means when variable CR improved one unit, then the financial performance of
the manufacturing companies registered in BEI year 2015 will be up by 0.009.
B2 =-1.066, are negative meaning in variable DER one unit, then the improved financial performance of
manufacturing companies
registered in BEI know 2015 will be dropped by-1.066 assuming other variables fixed
B3 = 5.395, is positive meaning in TATO variable one unit, then improved financial performance manufacturing company listed in BEI years 2015 will rise amounting to 5.395 assuming other variables fixed
Test the feasibility of the Model (test F)
Table 7. A Model Feasibility Test Results (Test F)
Discription Fhitung Ftabel Sig Discription
Uji F 14,680 3,109 0,000 Model Significant
Based on the above calculation shows that the results of the count F 14.680 whereas f table of 3.109, meaning f count greater than f table (14.680 > 3.109). That is, the most
influential model of the company's financial performance significantly to menufaktur registered in BEI 2014-2015 year.
Hiporesis-test (test t)
Table 8. The t-test results
Keterangan thitung ttabel Sig Α Keterangan
H1 2,753 1,990 0,007 0,05 Diterima
H2 -2.076 1,990 0,039 0,05 Ditolak
The first hypothesis (H1): the influence of Current Ratio (CR) against the financial performance of the company (Return On Asset)
Value thitung from the results of the regression model calculation of Current ratio above is of 2.753 greater than ttabel of 1.990 (thitung = 2.753 = ttabel > 1.990) with the value of the sig 0.007 < 0.05, then Ho denied and Ha received means CR influential financial Performance significantly to
manufacturing companies
registered in BEI 2014-2015 year interpreted with ROA. The research is in line with the research Dalyeen (2017); Arisadi & Djazuli (2013) and Ayani et al (2016). But not in line with the research Pramesti et al (2016) and Noor (2011) stating that the current ratio does not affect the company's financial performance.
The second hypothesis (H2): 2.076 < 1.990) with the value of the sig 0.039 < 0.05, Ho accepted and
then rejected Ha means DER do not affect financial performance significantly to manufacturing companies registered in BEI 2014-2015 year interpreted with ROA. The results of this study are in line with research Enekwe (2015); Noor (2011) and Nainggolan & Pratiwi (2017) but not in line with the research Arisadi & Djazuli (2013) and Martini (2016) stating that the Debt to equity ratio effect on the financial performance of the company.
The third hypothesis (H3): the influence of Total Asset Turnover Financial Performance Against Company (Return On Asset)
Value thitung from the results of the regression model calculation of Total Tunover Asset above is of 5.541 is greater than ttabel of 1.990 ( thitung = = ttabel > 5.541 1.990) with the value of the sig 0.000 < 0.05, then Ho denied and Ha received a Total Asset Turnover means influential financial Performance against signifikan manufacturing company listed in BEI 2014-2015 year. The results of this study are in line with research Pramesti et al (2016); Noor (2011); Martini (2016) and Esthirahayu et al (2014).
Test Coefficient Determination (R2)
Table 10. Test Results The Coefficient Of Determination (R2)
R Square Keberartian R Square
Keterangan
0,212 21,2 % 78,8 variasi kinerja keuangan
dipengaruhi faktor lain
Based on the table above, it can be seen that the value of R2 is
explained by raio CR, DER, and tato. Meanwhile, the rest of 78.8% by other variables outside of the model. The level of to overlook the means that only 21.2% indicates that there is still a 78.8% variation affected the financial performance of other factors were not examined in this study.
4. CONCLUSIONS AND
SUGGESTIONS this research is quantitative research. Sampling method with the method of purposive sampling. The sample meets the criteria is 84 manufacturing companies listed on the Indonesia stock exchange year 2014-2015 so obtained 168 data observations. Methods of data analysis used in the study include descriptive statistics, classic assumption test (normality test, autocorrelation,
multicollinearity, and
heteroskedastisitas test, test the hypothesis (multiple linear regression analysis, test eligibility the model t, test, and analysis of the coefficient of determination. Based on the results of hypothesis testing shows that the independent variable Current Ratio and Total Asset Turnover effect significantly to the Return On Assets, while the Debt to Equity ratio not significantly influential against the Return On Asset. Suggestions for further research excellence as follows: 1) for further research, is expected to conduct similar research but added the company other than manufacturing companies. 2) for further research, is probably can affect research results when using the observation period is much longer.
5. REFERENSI
Arisadi, Yunita Castelia; Djazuli, Djumahir Atim. (2013). Pengaruh
Ukuran Perusahaan, Umur
Perusahaan, Current Ratio, Debt to Equity Ratio dan Fixed Asset to Total Asset Ratio Terhadap Kinerja
Keuangan Pada Perusahaan
Manufaktur di Bursa Efek Indonesia. Jurnal Aplikasi Manajemen Vol.11, No.4.
Ayani, Sri; Raharjo, Kharis; Arifati, Rina;. (2016). Pengaruh Current Ratio, Debt To Equity Ratio, Inventory Turnover, Ukuran
Perusahaan Dan Umur
Perusahaan Terhadap
Profitabilitas Perusahaan Pada Perusahaan Manufaktur Yang Terdaftar Di Bursa Efek Indonesia Tahun 2010-2014. Journal Of Accounting, Volume 2 No.2 Maret
2016.
Azizah, Irma Nur;. (2016). The Effect Of Financial Ratios On Profitability In The Consumer Goods Industry In The Indonesian Stock Exchange. jurnal Bisnis Dan Manajemen Eksklusif Vol.1 No.1.
Dalyeen, Basman Al;. (2017). Financial Performance Appraisal of Selected Companies in jordan. Open Journal of Business and
Enekwe, C. I. (2015). The Relationship Between Financial Ratio Analyss And Corporate Profitability : A Study Of Selected Quoted Oil And Gas Companes In Nigeria. European Journal Of Accounting, Auditing and Research Vol.3, No.2.
Esthirahayu, Putri Dwi;. (2014). Pengaruh Rasio Likuiditas, Rasio Leverage, Dan Rasio Aktivitas Terhadap Kinerja Keuangan
Perusahaan (Studi Pada
Perusahaan Food And baverage yang Listing di Bursa Efek Indonesia Tahun 2010-2012. Jurnal Administrasi Bisnis (JAB),
Vol.8 No.1.
Fahmi. (2011). Analisis Laporan
Keuangan. Lampulo: Alfabeta.
Kasmir. (2010). Pengantar Manajemen
Keuangan. Jakarta: Kencana.
Khalifa, Khalifa Mohamed; Zhafii, Zurina;. (2013). Financial Perfomance and Identify Affecting Factors in this
Performance of Non-oil
Manufacturing Companies Listed on Libyan Stock Market (LSM). European Journal of Business and
Management.
Martini. (2016). Faktor-Faktor yang Mempengaruhi Kinerja Keuangan
Perusahaan Otomotif Tahun 2011-2015. Jurnal Akuntansi dan
Keuangan.
Nainggolan, Imanuel Praluhutan Mangasi; Pratiwi, Monica Weni;. (2017). Analisis Faktor-Faktor Yang Mempengaruhi Kinerja Keuangan Perusahaan. Media
Ekonomi Dan Manajemen.
Noor, Syafrudin Akhmad;. (2011). Analisis Faktor -faktor yang
Mpempengaruhi Kinerja
Keuangan Perusahaan
Telekomunikasi yang Go Public Di Bursa Efek Indonesia. Jurnal
Manajemen dan Akuntansi.
Pramesti, Dian; Wijayanti, Anita; Nurlaela, Siti;. (2016). Pengaruh Rasio Likuiditas, Leverage, Aktivitas dan Firm Size Terhadap Profitabilitas Perusahaan Sektor Otomotif Dan Komponen Di Bursa Efek Indonesia . Seminar
Nasional IENACO.
Selcuk, Elif Akben;. (2016). Factors Affeccting Firm Competitiveness: Evidence from an Emerging Market. International journal of Financial studies Departement of Business Administratio, Kadir
Has University, istanbul.