Characterisation of the dissimilatory reduction of
Fe(III)-oxyhydroxide at the microbe – mineral interface: the
application of STXM–XMCD
V . S . C O K E R ,1J . M . B Y R N E ,1N . D . T E L L I N G ,2G . V A N D E R L A A N ,3J . R . L L O Y D ,1 A . P . H I T C H C O C K ,4J . W A N G5A N D R . A . D . P A T T R I C K1
1School of Earth, Atmospheric & Environmental Sciences and Williamson Research Centre for Molecular Environmental Science, University of Manchester, Manchester, UK
2Institute for Science and Technology in Medicine, Keele University, Stoke-on-Trent, UK 3Diamond Light Source Ltd, Didcot, Oxfordshire, UK
4Brockhouse Institute for Materials Research, McMaster University, Hamilton, ON, Canada 5Canadian Light Source Inc., University of Saskatchewan, Saskatoon, SK, Canada
ABSTRACT
A combination of scanning transmission X-ray microscopy and X-ray magnetic circular dichroism was used to spatially resolve the distribution of different carbon and iron species associated withShewanella oneidensis MR-1 cells.S. oneidensisMR-1 couples the reduction of Fe(III)-oxyhydroxides to the oxidation of organic matter in order to conserve energy for growth. Several potential mechanisms may be used byS. oneidensisMR-1 to facili-tate Fe(III)-reduction. These include direct contact between the cell and mineral surface, secretion of either exog-enous electron shuttles or Fe-chelating agents and the production of conductive ‘nanowires’. In this study, the protein⁄lipid signature of the bacterial cells was associated with areas of magnetite (Fe3O4), the product of dis-similatory Fe(III) reduction, which was oversaturated with Fe(II) (compared to stoichiometric magnetite). How-ever, areas of the sample rich in polysaccharides, most likely associated with extracellular polymeric matrix and not in direct contact with the cell surface, were undersaturated with Fe(II), forming maghemite-like (c-Fe2O3)
phases compared to stoichiometric magnetite. The reduced form of magnetite will be much more effective in environmental remediation such as the immobilisation of toxic metals. These findings suggest a dominant role for surface contact-mediated electron transfer in this study and also the inhomogeneity of magnetite species on the submicron scale present in microbial reactions. This study also illustrates the applicability of this new synchro-tron-based technique for high-resolution characterisation of the microbe–mineral interface, which is pivotal in controlling the chemistry of the Earth’s critical zone.
Received 6 September 2011; accepted 24 February 2012
Corresponding author: V. S. Coker. Tel.: +44(0)161 275 3803; fax: +44(0)161 306 9361; e-mail: vicky.coker@ manchester.ac.uk
INTRODUCTION
Microbial Fe(III) reduction is widespread in the subsurface and has significant environmental consequences, as it has been shown to control the mobility of radionuclides, toxic metals and organic molecules in many different environments (Lov-leyet al., 2004). Therefore, it is of great interest to identify the precise mechanisms that dissimilatory Fe(III)-reducing bacteria use to reduce Fe(III)-bearing minerals. The Gram-negative, facultative anaerobeShewanella oneidensisMR-1 is able to reduce solid-phase Fe(III) oxyhydroxides by coupling the reaction to the oxidation of organic matter (Lovleyet al.,
1989; Nealson & Saffarini, 1994). This electron-transfer pro-cess can result in the formation of a range of Fe(II)-rich phases, including magnetite, green rusts, siderite or vivianite (Fredricksonet al., 1998; Ona-Nguemaet al., 2002; Lloyd, 2003). As well as direct contact between cell surface and mineral, transferring electrons via outer membrane cyto-chromes (Myers & Myers, 1992; Shiet al., 2007), there are a number of alternative methods that this bacterium can use to facilitate the electron-transfer process, particularly to reduce less bioavailable solid-phase minerals. These include the secre-tion of electron-shuttling compounds (Newman & Kolter, 2000; Marsiliet al., 2008; von Cansteinet al., 2008), the use
of endogenous electron shuttles such as humics (Newman & Kolter, 2000), the secretion of an Fe(III)-solubilising ligand (Taillefertet al., 2007) and the production of electrically con-ducting pili or ‘nanowires’ (Gorby et al., 2006; El-Naggar
et al., 2010). Here, we describe the use of the relatively novel and fast developing technique of scanning transmission X-ray microscopy (STXM) combined with X-ray magnetic circular dichroism (XMCD) to evaluate the spatial distribution of Fe(II) and Fe(III) vs. carbon signatures specific for a range of cellular macromolecules in Fe(III)-reducing cultures of
S. oneidensisMR-1. This combination of STXM and XMCD has previously been used to identify the individual magnetic moment in magnetite nanocrystals in a magnetotactic bacte-rium (Lamet al., 2010), and a comprehensive bibliography of STXM is available in Ade & Hitchcock (2008), with more recent updates available at http://unicorn.mcmaster.ca/xrm-biblio/xrm_bib.html. The direct visualisation of the oxidation state of Fe in both the extracellular and cell-surface environ-ments gives a unique insight into the mechanism of Fe(III) reduction in this model organism. The study of this specific system has additional interest given the technological potential of the nanospheres of biomagnetite produced by this process and the ability to control their magnetic properties by the Fe(III)⁄Fe(II) behaviour (Cokeret al., 2009).
M A T E R I A L S A N D M E T H O D S
Shewanella oneidensisMR-1 was grown under strictly anaero-bic conditions at 30C in modified freshwater medium as
described previously (Lloydet al., 2003). SodiumDL-lactate (100 mM) and fumarate (20 mM) were provided as the elec-tron donor and acceptor, respectively. All manipulations were performed under an atmosphere of N2–CO2(80:20). Poorly crystalline Fe(III)-oxyhydroxide was produced using the method of Lovley & Phillips (1986), where a 0.4Msolution of FeCl3is neutralised by 10 N NaOH to pH 7 and the solid then washed by centrifugation six times until no Cl) ions remain. The mineral was stored in the dark at 4C for not
more than 6 months before use. Late log-phase cultures of
S. oneidensis MR-1 were harvested by centrifugation at 5000G for 20 min and washed twice in carbonate buffer (NaHCO3; 30 mM, pH 7.1) under N2–CO2(80:20) prior to use. Aliquots of the washed cell suspension (0.5 mL) were added to sealed anaerobic bottles containing 9.9 mL bicar-bonate buffer, 50 mM poorly crystalline Fe(III) oxide and 20 mM sodium lactate. The final concentration of bacteria corresponded to approximately 0.2 mg protein per mL. Bottles were incubated in the dark at 20C. After 1 week of
incubation, an aliquot of the suspension (0.1 mL) was depos-ited and dried on a formvar-coated 3 mm 200-mesh copper grid (Agar Scientific, Stansted, UK) under anaerobic condi-tions. The grid was transferred on a sample holder from a glove bag to the STXM in an air-tight jar. The chamber con-tained an overpressure of N2. The sample jar was only opened
within the chamber, and the sample mounting was performed quickly to prevent sample oxidation. A second aliquot of sample was taken for powder X-ray diffraction (XRD) mea-surements. XRD measurements were obtained with a Bruker D8 Advance instrument using CuKa1radiation. Data were acquired over the range 15(2h)–70(2h), using a step size of
0.02(2h).
Scanning transmission X-ray microscopy observations were carried out on the soft X-ray spectromicroscopy (SM) beam-line BL 10ID1 of the Canadian Light Source (CLS) in Saska-toon, Canada. Observations were made firstly at the CK-edge followed by the Fe L2,3-edge to minimise possible beam damage. The beamline has an energy resolving power E⁄DE > 3000 and an incident flux of 108ph⁄s⁄0.5 A at 3000
resolving power. Further details can be found in (Kaznatcheev
et al., 2007). The exit slits were adjusted such that the maxi-mum flux used was 18 MHz. Energy calibration was achieved using the sharp peak for protein at 288.2 eV and the peak maximum for magnetite at 709.5 eV. Elemental maps (also called ‘stack maps’) were generated by taking a background image at 280 and 700 eV and subtracting this image from a corresponding image for C at 288.2 eV or Fe at 709.5 eV, respectively. Spectroscopic data were collected by scanning a spatial region of interest inx–ysample directions, perpendicu-lar to the beam, at each energy increment over an energy range covering an elemental edge thus creating a spectrum at each pixel, known collectively as a stack (Jacobsen et al., 2000). Care was taken to use as low a dose of X-rays as possi-ble to minimise the impact of radiation damage on these mea-surements. This involved careful selection of dwell time, number of energy points and use of an automated fast, in-vacuum shutter, so only X-rays hitting the sample were contributing to the measured data. A dwell time of 0.95– 1.15 ms was used, which has previously been shown to give minimal beam damage to samples containing a combination of iron minerals and bacteria (Miotet al., 2009a). The energy step was 0.15 eV over the main features of each edge, and the image pixel size was 0.025lm. Images at damage sensitive energies (289 eV in the C K-edge and 704 eV in the FeL2,3-edge) were measured after stack acquisitions; visible changes in the sample morphology were not noted.
The source point for the CLS–STXM is an elliptically pola-rising undulator (EPU), which provides nearly 100% circularly polarised light at the FeL2,3edge (Kaznatcheevet al., 2007). To determine the Fe L2,3 XMCD, two image stacks were recorded in transmission mode for the same sample area, firstly with right circularly polarised (RCP) and then left circu-larly polarised (LCP) X-rays. A magnetic field of0.1 T was applied to the sample by mounting a strip of the grid between two poles of a magnet and having the sample plate at an angle of 30to the beam direction, resulting in a component of the
L2,3-edge, data transmission signals were converted to optical density (OD) units using the incident flux signals measured in the same stack through regions free of C or Fe, adjacent to regions of interest. Alignment of each stack was carried out in aXis2000 (Hitchcock, 2011) using the stack analyser func-tion, which aligns images by cross-correlations using Fourier transforms. For the CK-edge, the image sequence was fitted using the singular value decomposition (SVD) method using standard spectra for expected components. Threshold mask-ing was used to identify areas with similar spectral characteris-tics to the standards. For the FeL2,3-edge, the two stacks for the LCP and RCP X-rays are then added and ordered in photon energy and the alignment process repeated on the combined stack. The two well-aligned stacks are then separated again and subtracted to give a new stack that yields spectra that are the difference between the X-ray absorption spectra for RCP and LCP X-rays, in a magnetic field set at 30 to the incoming beam direction; XMCD spectra.
To obtain the relative amounts of the three Fe sites, the experimental spectra were fitted by means of a non-linear least-squares analysis, using calculated spectra for each of the Fe sites. In these calculations, as described by van der Laan & Thole (1991), the Hartree–Fock–Slater integrals for the 3d-3dand 2p-3dCoulomb and exchange interactions were scaled to 70 and 80%, respectively, and the crystal fields for the octahedral and tetrahedral sites were taken to be 10Dq= 1.4 and)0.6 eV, respectively. The calculated spectra were convoluted by a Lorentzian ofC= 0.3 (0.5) eV for the
L3(L2)-edge to account for intrinsic core-hole lifetime broad-ening and by a Gaussian ofr= 0.2 eV to account for instru-mental broadening. The experiinstru-mental spectra were fitted over theL3main peaks only, which has been previously shown to give meaningful results, although fitting over theL2peak does give good qualitative agreement (Pattricket al., 2002).
RESULTS AND DISCUSSION
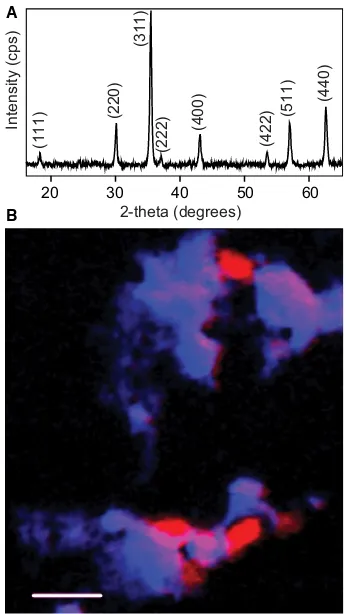
After 1 week of incubation with S. oneidensis MR-1, the orange Fe(III)-oxyhydroxide in the sample tubes had altered to a black magnetic precipitate, expected to be the Fe(II)-bearing mineral magnetite (Fe3O4) as reported previously (Cokeret al., 2007). This was subsequently confirmed using XRD (Fig. 1A), and the crystallite size of the magnetite was determined to be 29.15 ± 2.4 nm through fitting the (311) with a Lorentzian line shape and using the Scherrer equation. CKand FeL2,3-edge STXM analyses were performed on an aliquot of the sample slurry. First, the location of carbon-rich and iron-rich areas was mapped with an image step size of 0.05lm across the sample to identify suitable areas for more in-depth analysis and to provide an overview of the spatial distribution of each element (Fig. 1B). It can be seen from Fig. 1B that there are oval⁄rod-shaped structures
1· 0.5lm; comparison with previous images (Gorby et al., 2006; Ravindranath et al., 2011) and noting that they are
carbon-rich indicates they are cells of S. oneidensis MR-1, surrounded by deposits rich in iron, likely to be the magnetic precipitate.
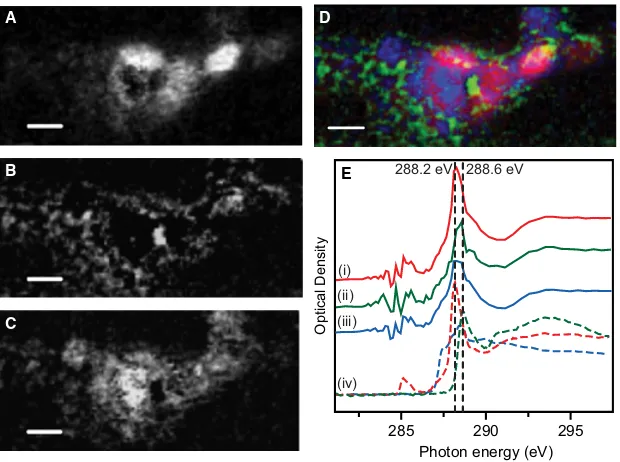
A more detailed examination of the lower portion of the area represented by Fig. 1B was carried out by collecting images at regular energy intervals across the carbonK-edge between 280 and 320 eV, forming a ‘stack’ (see Materials and methods, above). SVD analysis using three standard spectra for protein, alginate and lipid, obtained from Lawrenceet al.
(2003), each normalised to an intensity corresponding to 1 nm thickness of the pure material (OD1), and a constant term was applied to the carbonK-edge stack. The areas of the sample containing high concentrations of protein (red), poly-saccharide (green) or lipid (blue) are shown in Fig. 2A–C, with a colour composite image in Fig. 2D and the experimen-tal spectra extracted for each of the three different compo-nents in Fig. 2E. The spectrum for areas containing a high concentration of protein gives a good fit to the standard spec-trum from bovine serum albumin (BSA) containing both the 1sfip*C=Ctransition at 285.1 eV and the main transition 1sfip*C=Oat 288.2 eV associated with the peptide bond (Lawrenceet al., 2003). The spectrum for areas of high lipid content also contains a large protein component, indicated by
20 30 40 50 60
(111)
(220)
(400)
(422)
(511) (440)
(222)
(311)
Intensity (cps)
2-theta (degrees) A
B
Fig. 1(A) X-ray diffraction trace with the reflections for magnetite. (B) Colour composite of two scanning transmission X-ray microscopy maps (optical density, OD) measured at the CK-edge (OD288.2–OD280) in red and the FeL2,3-edge (OD709.5–OD700) in blue. 1lm scale bar.
the decrease in the intensity at 290.8 eV, demonstrating that the lipid-rich areas are also protein-rich. The protein and lipid signals come primarily from the oval⁄rod shapes 1·
0.5lm, strongly supporting that these structures are cells of S. oneidensisMR-1. The polysaccharide spectrum gives a good
agreement with the standard for alginate with the most intense peak associated with carboxyl groups (Benzeraraet al.,
2004; Chanet al., 2009) occurring at 288.6 eV, a distinctly
higher energy than the 1sfip*C=Oat 288.2 eV of protein.
From the component map (Fig 2B) and the colour-coded composite (Fig. 2D), the polysaccharide appears to surround the bacterial cell. This is consistent with a diffuse extracellular matrix of polysaccharide.
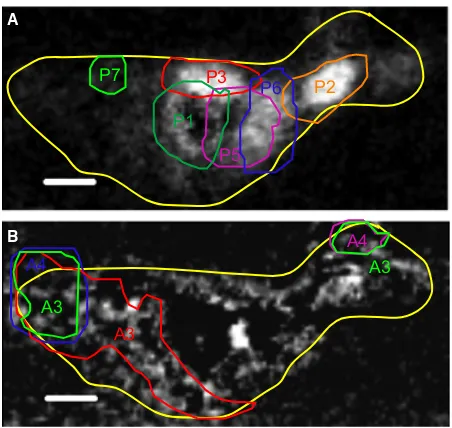
The distribution of Fe(II) and Fe(III), over the same region for the CK-edge, was examined in detail by collecting images and spectral data at energy intervals between 700 and 730 eV, creating a Fe L2,3-edge stack. As magnetite contains both Fe(II) and Fe(III), in a 1:2 ratio, a linear regression analysis of the data using standard spectra for Fe(II) and Fe(III) was not practical for spatially resolving the differences in amounts and spatial distributions for the two oxidation states [see Fig. 3Ai,ii for the X-ray absorption spectral (XAS) shapes] because they are too closely associated within the sample. Therefore, XMCD spectral measurements were made as these have previously been shown to resolve the three Fe environ-ments present in magnetite; the Fe(II) octahedral, Fe(III) tetrahedral and Fe(III) octahedral (Pattrick et al., 2002;
Morrallet al., 2003), where each electronic state of Fe has a
distinctly different XMCD spectral signature (see Fig. 3Aiii,iv for the XMCD spectral shapes).
The S. oneidensis MR-1 biomagnetite sample plate was
placed within a0.1 T magnetic field, at 30 to the X-ray beam, resulting in a component of the magnetic field parallel A
B
C
D
E
Photon energy (eV)
Optical Density
(i)
(iii) (ii)
285 290 295
(iv)
288.2 eV 288.6 eV
Fig. 2Individual carbon component maps (A–C) derived by fitting an energy sequence of images (stack) of the CK-edge (96 images from 280 to 320 eV; 60 nm
pix-els, 1 ms per pixel) with a linear combination of albumin (protein) (A), alginate (polysaccharide) (B) and lipid (C). The maximum optical density (OD) values are 110 (A), 25 (B) and 70 (C). (D) Colour-coded composite map derived from images (A–C). Red = protein; green = polysaccharide; blue = lipid. (E) CK-edge spectra (i)
pro-tein, (ii) alginate and (iii) lipid extracted from the image stack (solid lines), compared to the reference standards (iv-using the same colours) used to generate the com-ponent maps (dotted lines) (from Lawrenceet al., 2003). Scale bar is 500 nm for all images.
x2
710 720
Intensity (arb. units)
Photon energy (eV)
A B
710 720
Photon energy (eV)
Intensity (arb. units)
(i)
(iv) (iii) (ii)
(ii) (i)
Fig. 3(A) Calculated X-ray absorption spectral (XAS) (i) and X-ray magnetic circular dichroism (XMCD) (iii) spectra for the FeL2,3-edge of stoichiometric magnetite and individual components of the XAS (ii) and XMCD (iv) spectral calculations, Fe(II) octahedral (green), Fe(III) tetrahedral (red) and Fe(III) octa-hedral (blue). (B) FeL2,3-edge spectra forShewanella oneidensisMR-1
to the beam direction whilst also allowing the beam to pass through the sample into the detector. Two FeL2,3-edge stacks were collected, one with left and the other with RCP X-rays, thus providing two XAS per image pixel; the XMCD is obtained as the difference between these two spectra. The average XAS and XMCD spectra for the sample area within
the yellow contour of Fig. 4 are shown in Fig. 3Bi. The average XAS and XMCD spectra obtained for this sample is compared to FeL2,3spectra previously taken in total-electron yield (TEY) on beamline 4.0.2 at the Advanced Light Source (ALS) for a similar sample of biomagnetite produced by the same bacterium (Fig. 3Bii), published in Cokeret al.(2007). In that study, the two XAS were obtained by switching the magnetic field between a parallel and anti-parallel direction along the incident X-ray beam.
It can be seen from Fig. 3B that the magnitude of the STXM–XMCD signal is smaller than that in the TEY–XMCD measurement. This can be ascribed in part to the fact that the sample is mounted at 30oto the X-ray beam, and so only 50% of the XMCD signal is observed. Also, there is a lower mag-netisation of the sample in the STXM–XMCD measurement, where a smaller magnetic field had to be applied owing to the space constraints of the STXM chamber. However, the smaller magnitude does not affect the overall shape of the XMCD signal, but merely leads to weaker signal and thus relatively larger increased noise in the spectra. The STXM–XMCD was collected in transmission mode giving the bulk mineralogy of the sample, whereas the XMCD taken from Coker et al. (2007) was collected in TEY mode which only probes the top 4–6 nm of the sample surface. Therefore, the two measure-ments allow us to compare the bulk and surface of the magne-tite. The peak fitting results of the XMCD spectra, derived from non-linear least-squares fitting using calculated spectra for each of the three Fe environments (van der Laan & Kirkman, 1992; Pattricket al., 2002), are given in Table 1. These results indicate that the surface and bulk measurements are in reasonably good agreement particularly with respect to
A
P1 P3
P6
P7
P2
P5
A3
A4
A4
A3
A3 B
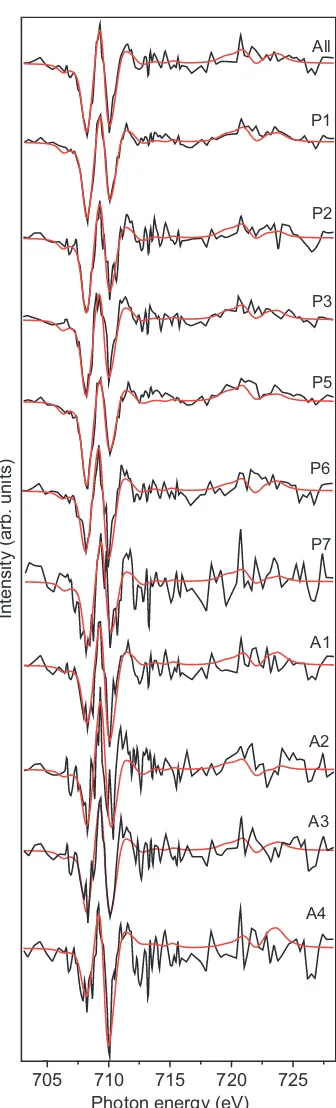
Fig. 4(A) protein component map and (B) polysaccharide component map (both from Fig. 2) overlaid by contours defining areas from which FeL2,3-edge X-ray absorption spectral were extracted to generate X-ray magnetic circular dichroism spectra (Fig. 5), these were for either the whole area (yellow contour) or high concentrations of either (A) protein⁄lipid (P1-P7) or (B) polysaccharide
(A1–A4). Scale bar is 500 nm for both images.
Table 1Results for the relative amounts of octahedral Fe(II), tetrahedral Fe(III) and octahedral Fe(III) as obtained by fitting the FeL2,3-edge XMCD spectra shown in Fig. 5 collected from the corresponding areas in Fig. 4 [whole area (yellow contour) or P = protein⁄lipid and A = polysaccharide]
Area Fe(II) Oh* Fe(III) Td* Fe(III) Oh* Total Fe(II)⁄Fe(III)
Absolute error in
Fe(II)⁄Fe(III) ratio Td⁄Oh
Stoichiometric magnetite 1.00 1.00 1.00 3.00 0.50 0.020 0.50
Whole area 1.08 1.00 1.15 3.23 0.50 0.021 0.45
P1 1.33 1.00 1.11 3.45 0.63 0.022 0.41
P2 1.26 1.00 0.97 3.23 0.64 0.023 0.45
P3 1.33 1.00 1.11 3.45 0.63 0.022 0.41
P5 1.63 1.00 0.99 3.61 0.82 0.027 0.38
P6 0.81 1.00 1.16 2.97 0.38 0.021 0.51
P7 1.08 1.00 0.92 3.00 0.56 0.025 0.50
Average P 1.24 1.00 1.04 3.28 0.61 0.023 0.44
A1 0.73 1.00 1.33 3.06 0.31 0.018 0.49
A2 0.68 1.00 0.82 2.50 0.37 0.023 0.67
A3 0.84 1.00 1.07 2.91 0.41 0.021 0.52
A4 0.44 1.00 1.78 3.23 0.16 0.011 0.45
Average A 0.68 1.00 1.25 2.92 0.30 0.017 0.52
Shewanella oneidensisMR-1 TEY–XMCD 1.05 1.00 0.99 3.04 0.53 0.023 0.49
TEY, total-electron yield; XMCD, X-ray magnetic circular dichroism. Errors are indicated in a separate column
*Errors are ±0.02. From Cokeret al.(2007).
the overall percentage of Fe(II) in the magnetite. The surface contribution from 29 nm nanoparticles is a significant proportion [up to 80% assuming a probing depth of 60 A˚ –see Coker et al. (2007)] of the total signal; therefore, this similarity might be expected.
Areas of the FeL2,3-edge map found to be high in either protein⁄lipid or polysaccharide were chosen and labelled P1–P7 for protein⁄lipid-rich areas and A1–A4 for polysaccha-ride-rich areas in Fig. 4. XAS were extracted from the two Fe stacks, and the XMCD spectra calculated and then fit in the same way as described above (Fig. 5). The results listed in Table 1 indicate that areas of magnetite corresponding to the position of protein⁄lipid in the sample contain a larger amount of Fe(II) compared to stoichiometric magnetite, whereas areas of magnetite associated with polysaccharides are under-saturated in Fe(II) compared to stoichiometric magne-tite. For the areas of biomagnetite closely associated with the bacterium, the average Fe(II)⁄Fe(III) ratio is 0.61 ± 0.03, the most reduced magnetite present, and much more reduced than the average value of 0.50–0.53. This is confirmation that direct contact with the cells is an efficient mechanism for reducing Fe(III) to Fe(II), recrystallising the Fe(III)-oxyhy-droxide into an ‘over-reduced’ form of magnetite. The areas rich in polysaccharides give XMCD signals that have an aver-age Fe(II)⁄Fe(III) value of 0.30 ± 0.03, which is much lower than that for stoichiometric magnetite, tending towards maghemite (c-Fe2O3), and suggests that direct contact is required in these cultures for maximal levels of Fe(III) reduc-tion, although enough Fe(II) is still generated to fully recrys-tallise the Fe(III)-oxyhydroxide to magnetite.
It has been shown previously that biogenic nanomagnetite is (overall) typically slightly oversaturated with Fe(II) com-pared to stoichiometric magnetite, and this is thought to be a function of the O2-free environment that these bacteria require in order to use Fe(III) as an electron acceptor (Kukk-adapuet al., 2005; Cokeret al., 2007; Carvalloet al., 2008). However, from the limited observations presented in this study, the situation is seen to be more complex, especially during the reduction process, and the mineralogical status of the magnetite depends on the local (nanoscale) interactions of the microbial cell with the mineral substrates. Although this work is only based upon analyses from one sample area, the results can be compared to work on Fe(II)-oxidising bacteria, where a gradient in the oxidation state of Fe was observed using STXM, indicating the progression of Fe(II) oxidation beyond the cell microenvironment (Miotet al., 2009c). Here, the importance of bacterial cell–mineral contact in the biore-duction of solid-phase Fe(III) is demonstrated; the precise contribution of surface-localised cytochromes (Clarkeet al., 2011) or other mechanisms including extracellular append-ages (Gorbyet al., 2006), soluble secreted electron shuttles (Newman & Kolter, 2000) such as flavins (von Cansteinet al., 2008) or electron flow through mineral assemblages (Wilkins et al., 2007) are controversial and could be active in the
process we describe. The changes in Fe(II) concentration across the sample has implications for the reactions and sorp-tion processes in subsurface sediments and in bioremediasorp-tion
705 710 715 720 725 All
P1
P2
P3
P5
P6
A1
A2
A3
A4
Photon energy (eV)
Intensity (arb. units)
P7
approaches that are heavily dependent on the reducing power of the Fe(II) associated with Fe-biominerals, such as Cr(VI) reduction (Cuttinget al., 2010). During bioreduction, there is a very reduced magnetite component present that will be the major driver of toxic metal cycling and reduction and immobilisation of the metals (Ngomsiket al., 2005). There will also be a maghemite-like component that is less reactive produced by other means such as electron mediator com-pounds. Future work could centre around investigating the differences in the Fe(II)⁄Fe(III) ratio across a sample when an electron mediator compound, such as a secreted flavin or a humic material, is introduced into the system.
The STXM–XMCD technique described here offers a unique combination of nano-scale (25 nm) spatial resolution and spectroscopic probing of the speciation of metals and lighter ‘biological’ elements such as carbon in dry and fully hydrated (Hitchcocket al., 2009) samples. STXM provides direct imaging, quantification and correlation of the amounts (e.g. Wan et al., 2007) and spatial localisation (e.g. Toner et al., 2005; Hunteret al., 2008; Chanet al., 2009; Miot et al., 2009b) of different components in environmental systems, which facilitates significant advances in our under-standing of the mechanisms of many geomicrobiological processes, including the demonstration here that shows the potential of combining STXM with XMCD to identify the redox cycling of iron in both laboratory and potentially environmental samples.
A C K N O W L E D G M E N T S
This work was supported by the NERC EnviroSync pro-gramme (UK), the Natural Sciences and Engineering Research Council of Canada (NSERC) and the Canada Research Chairs program. The authors would like to thank Karen Lam for assistance during beam time. Research described in this study was performed at the Canadian Light Source, which is supported by NSERC, the National Research Council Canada, the Canadian Institutes of Health Research, the Province of Saskatchewan, Western Economic Diversifica-tion Canada and the University of Saskatchewan.
R E F E R E N C E S
Ade H, Hitchcock AP (2008) NEXAFS microscopy and resonant scat-tering: composition and orientation probed in real and reciprocal space.Polymer49, 643–675.
Benzerara K, Yoon TH, Tyliszczak T, Constantz B, Spormann AM, Brown GE (2004) Scanning transmission X-ray microscopy study of microbial calcification.Geobiology2, 249–259.
Carvallo C, Sainctavit P, Arrio M-A, Menguy N, Wang Y, Ona-Nguema G, Brice-Profeta S (2008) Biogenic vs. abiogenic magne-tite nanoparticles: a XMCD study.American Mineralogist93,
880–885.
Chan CS, Fakra SC, Edwards DC, Emerson D, Banfield JF (2009) Iron oxyhydroxide mineralization on microbial extracellual polysac-charides.Geochimica et Cosmochimica Acta73, 3807–3818.
Clarke TA, Edwards MJ, Gates AJ, Hall A, White GF, Bradley J, Rear-don CL, Shi L, Beliaev AS, Marshall MJ, Wang Z, Watmough NJ, Fredrickson JK, Zachara JM, Butt JN, Richardson DJ (2011) Struc-ture of a bacterial cell surface decaheme electron conduit. Proceed-ings of the National Academy of Sciences108, 9384–9389.
Coker VS, Pearce CI, Lang C, van der Laan G, Pattrick RAD, Telling ND, Schuler D, Arenholz E, Lloyd JR (2007) Cation site occu-pancy of biogenic magnetite compared to polygenic ferrite spinels determined by X-ray magnetic circular dichroism.European Journal of Mineralogy19, 707–716.
Coker VS, Telling ND, van der Laan G, Pattrick RAD, Pearce CI, Arenholz E, Tuna F, Winpenny REP, Lloyd JR (2009) Harnessing the extracellular bacterial production of nanoscale cobalt ferrite with exploitable magnetic properties.ACS Nano3, 1922–1928.
Cutting R, Coker VS, Telling ND, Kimber RL, Pearce CI, Ellis BL, Lawson RS, van der Laan G, Pattrick RAD, Vaughan DJ, Arenholz E, Lloyd JR (2010) Optimizing Cr(VI) and Tc(VII) remediation through nanoscale biomineral engineering.Environmental Science and Technology44, 2577–2584.
El-Naggar MY, Wanger G, Leung KM, Yuzvinsky TD, Southam G, Yang J, Lau WM, Nealson KH, Gorby YA (2010) Electrical transport along bacterial nanowires fromShewanella oneidensis MR-1.Proceedings of the National Academy of Sciences107,
18127–18131.
Fredrickson JK, Zachara JM, Kennedy DW, Dong H, Onstott TC, Hinman NW, Li S (1998) Biogenic iron mineralization accompanying the dissimilatory reduction of hydrous ferric oxide by groundwater bacterium.Geochimica et Cosmochimica Acta62,
3239–3257.
Gorby YA, Yanina S, McLean JS, Rosso KM, Moyles D, Dohnalkova A, Beveridge TJ, Chang IS, Kim BH, Kim KS, Culley DE, Reed SB, Romine MF, Saffarini DA, Hill EA, Shi L, Elias DA, Kennedy DW, Pinchuk G, Watanabe K, Ishii S, Logan B, Nealson KH, Fredrick-son JK (2006) Electrically conductive bacterial nanowires produced byShewanella oneidensisstrain MR-1 and other microorganisms. Proceedings of the National Academy of Sciences 103, 11358–
11363.
Hitchcock AP (2011) aXis2000 is written in Interactive Data Language (IDL). It is available free for non-commercial use from http://unicorn.mcmaster.ca/aXis2000.html.
Hitchcock AP, Dynes JJ, Lawrence JR, Obst M, Swerhone GDW, Korber DR, Leppard GG (2009) Soft X-ray spectromicroscopy of nickel sorption in a natural river biofilm.Geobiology7, 432–453.
Hunter RC, Hitchcock AP, Dynes JJ, Obst M, Beveridge TJ (2008) Mapping the speciation of iron in pseudomonas aeruginosa biofilms using scanning transmission X-ray microscopy.Environmental Science & Technology42, 8766–8772.
Jacobsen C, Wirick S, Flynn G, Zimba C (2000) Soft X-ray spectro-scopy from image sequences with sub-100nm spatial resolution. Journal of Microscopy197, 173–184.
Kaznatcheev KV, Karunakaran C, Lanke UD, Urquhart SG, Obst M, Hitchcock AP (2007) Soft X-ray spectromicroscopy beamline at the CLS commissioning results.Nuclear Instruments & Methods in Physics Research A582, 96–99.
Kukkadapu R, Zachara JM, Fredrickson JK, Kennedy DW, Dohnalk-ova A, McCready DE (2005) Ferrous hydroxy carbonate is a stable transformation product of biogenic magnetite.American Mineral-ogist90, 510–515.
Lam KP, Hitchcock AP, Obst M, Lawrence JR, Swerhone GDW, Leppard GG, Tyliszczak T, Karunakaran C, Wang J, Kaznatcheev K, Bazylinski DA, Lins U (2010) Characterizing magnetism of individual magnetosomes by X-ray magnetic circular dichroism in a scanning transmission X-ray microscope.Chemical Geology270,
110–116.
Lawrence JR, Swerhone GDW, Leppard GG, Araki T, Zhang X, West MM, Hitchcock AP (2003) Scanning transmission X-ray, laser scanning, and transmission electron microscopy mapping of the exopolymeric matrix of microbial biofilms.Applied & Environmen-tal Microbiology69, 5543–5554.
Lloyd JR (2003) Microbial reduction of metals and radionuclides. FEMS Microbiology Reviews27, 411–425.
Lloyd JR, Leang C, Hodges Myerson AL, Coppi MV, Cuifo S, Methe B, Sandler SJ, Lovley DR (2003) Biochemical and genetic charac-terization of PpcA, a periplasmicc-type cytochrome inGeobacter sulfurreducens.Biochemistry Journal369, 153–161.
Lovley DR, Phillips EJP (1986) Availability of ferric iron for microbial reduction in bottom sediments of the freshwater tidal potomac river.Applied & Environmental Microbiology52, 751–757. Lovley DR, Phillips EJP, Lonergan DJ (1989) Hydrogen and formate
oxidisation coupled to dissimilatory reduction of iron or manganese byAlteromonas putrefaciens.Applied & Environmental Microbiol-ogy55, 700–706.
Lovley DR, Holmes DE, Nevin KP (2004) Dissimilatory Fe(III) and Mn(IV) reduction.Advances in Microbial Physiology49, 219–286.
Marsili E, Baron DB, Shikhare ID, Coursolle D, Gralnick JA, Bond DR (2008) Shewanella secretes flavins that mediate extracellular electron transfer.Proceedings of the National Academy of Sciences 105, 3968–3973.
Miot J, Benzerara K, Morin G, Bernard S, Beyssac O, Larquet E, Kappler A, Guyot F (2009a) Transformation of vivianite by anaerobic nitrate-reducing iron-oxidizing bacteria.Geobiology7, 373–384.
Miot J, Benzerara K, Morin G, Kappler A, Bernard S, Obst M, Ferard C, Skouri-Panet F, Guigner JM, Posth N, Galvez M, Brown GE, Guyot F (2009b) Iron biomineralization by anaerobic neutrophilic iron-oxidizing bacteria.Geochimica et Cosmochimica Acta73, 696–711.
Miot J, Benzerara K, Obst M, Kappler A, Hegler F, Schadler S, Bouchez C, Guyot F, Morin G (2009c) Extracellular iron biomin-eralization by photoautotrophic iron-oxidizing bacteria.Applied and Environmental Microbiology75, 5586–5591.
Morrall P, Schedin F, Case GS, Thomas MF, Dudzik E, van der Laan G, Thornton G (2003) Stoichiometry of Fe3-xO4(111) ultrathin films on Pt(111).Physical Review. B, Condensed Matter67, 214408.
Myers CR, Myers JM (1992) Localisation of cytochromes to the outer membrane of anaerobically grownShewanella putrefaciensMR-1. Journal of Bacteriology174, 3429–3438.
Nealson KH, Saffarini D (1994) Iron and manganese in anaerobic respiration: environmental significance, physiology, and regulation. Annual Review of Microbiology48, 311–343.
Newman DK, Kolter R (2000) A role for excreted quinones in extra-cellular electron transfer.Nature405, 94–97.
Ngomsik AF, Bee A, Draye M, Cote G, Cabuil V (2005) Magnetic nano- and microparticles for metal removal and environmental applications: a review.Comptes Rendus Chimie8, 963–970.
Ona-Nguema G, Abdelmoula M, Jorand F, Benali O, Gehin A, Block JC, Genin JMR (2002) Iron(II,III) hydroxycarbonate green rust formation and stabilization from lepidocrocite bioreduction. Environmental Science & Technology36, 16–20.
Pattrick RAD, van der Laan G, Henderson CMB, Kuiper P, Dudzik E, Vaughan DJ (2002) Cation site occupancy in spinel ferrites stud-ied by X-ray magnetic circular dichroism: developing a method for mineralogists.European Journal of Mineralogy14, 1095–1102. Ravindranath SP, Henne KL, Thompson DK, Irudayaraj J (2011)
Surface-enhanced raman imaging of intracellular bioreduction of chromate inShewanella oneidensis.PLoS ONE6, e16634. Shi L, Squier TC, Zachara JM, Fredrickson JK (2007) Respiration of
metal (hydr)oxides by Shewanella and Geobacter: a key role for multihaem c-type cytochromes.Molecular Microbiology65, 12–20. Taillefert M, Beckler JS, Carey E, Burns JL, Fennessey CM, DiChristi-na TJ (2007)Shewanella putrefaciensproduces an Fe(III)-solubiliz-ing organic ligand durFe(III)-solubiliz-ing anaerobic respiration on insoluble Fe(III) oxides.Journal of Inorganic Biochemistry101, 1760–1767. Toner B, Fakra S, Villalobos M, Warwick T, Sposito G (2005)
Spatially resolved characterization of biogenic manganese oxide production within a bacterial biofilm.Applied and Environmental Microbiology71, 1300–1310.
van der Laan G, Kirkman IW (1992) The 2pabsorption spectra of 3d transition metal compounds in tetrahedral and octahedral symme-try.Journal of Physics: Condensed Matter4, 4189–4204.
van der Laan G, Thole BT (1991) Strong magnetic x-ray dichroism in 2pabsorption spectra of 3dtransition metal ions.Physical Review. B, Condensed Matter43, 13401–13411.
von Canstein H, Ogawa J, Shimizu S, Lloyd JR (2008) Secretion of flavins by Shewanella species and their role in extracellular electron transfer.Applied & Environmental Microbiology74, 615–623. Wan J, Tyliszczak T, Tokunaga TK (2007) Organic carbon
distribu-tion, speciadistribu-tion, and elemental correlations within soil microaggre-gates: applications of STXM and NEXAFS spectroscopy.
Geochimica et Cosmochimica Acta71, 5439–5449.
Wilkins MJ, Wincott PL, Vaughan DJ, Livens FR, Lloyd JR (2007) Growth ofGeobacter sulfurreducenson poorly crystalline Fe(III) oxyhydroxide coatings.Geomicrobiology Journal3⁄4, 199–204.
S U P P O R T I N G I N F O R M A T I O N
Additional Supporting Information may be found in the online version of this article:
Fig. S1Schematic of the sample arrangement in the beam with the magnetic field and beam direction indicated.