See discussions, stats, and author profiles for this publication at: https://www.researchgate.net/publication/225241818
Fe K-edge XAS study of amethyst. Phys Chem
Mineral
Article in Physics and Chemistry of Minerals · May 2009 DOI: 10.1007/s00269-009-0332-0
CITATIONS
16
READS
156
8 authors, including:
Some of the authors of this publication are also working on these related projects:
Advanced methods for XAS data collectrion/analysisView project
Structural studies on materials for microelectronicsView project Francesco Di Benedetto
University of Florence
101PUBLICATIONS 800CITATIONS
SEE PROFILE
F. D’Acapito
Italian National Research Council 251PUBLICATIONS 3,389CITATIONS
SEE PROFILE
Giordano Montegrossi
Italian National Research Council 119PUBLICATIONS 815CITATIONS
SEE PROFILE
All content following this page was uploaded by F. D’Acapito on 29 November 2016.
O R I G I N A L P A P E R
A Fe K-edge XAS study of amethyst
Francesco Di Benedetto•Francesco D’Acapito• Gabriele Fornaciai•
Massimo Innocenti•Giordano Montegrossi• Luca A. Pardi•
Silvia Tesi•Maurizio Romanelli
Received: 25 March 2009 / Accepted: 18 September 2009
ÓSpringer-Verlag 2009
Abstract An X-ray absorption spectroscopy (XAS) study of the Fe local environment in natural amethyst (a variety ofa-quartz, SiO2) has been carried out. Room temperature
measurements were performed at the Fe K-edge (7,112 eV), at both the X-ray absorption near-edge struc-ture (XANES) and extended X-ray absorption fine strucstruc-ture (EXAFS) regions. Experimental results were then com-pared with DFT calculations. XANES experimental spectra suggest Fe to occur mainly in the trivalent state, although a fraction of Fe2?
is identified. EXAFS spectra, on the other hand, reveal an unusual short distance for the first coordi-nation shell: \Fe–O[=1.78(2) A˚ , the coordination number being 2.7(5). These results allow to establish that Fe replaces Si in its tetrahedral site, and that numerous local distortions are occurring as a consequence of the presence of Fe3?
variably compensated by protons and/or alkaline ions, or uncompensated. The formal valence of Fe, on the basis of both experimental and DFT structural fea-tures, can be either 4? or 3?. Taking into account the XANES evidences, we suggest that Fe mainly occurs in the trivalent state, compensated by protons, and that a minor
fraction of Fe4?
is stabilised by the favourable local structural arrangement.
Keywords AmethystFeXANESEXAFS DFT calculationsFe bioavailability
Introduction
The presence and the crystal chemistry of Fe species in amethyst (the purple variety of quartz, SiO2) has been the
matter of investigations lasting almost half century (e.g. Bappu 1953; Tumuklu et al. 2008). One of the major sources of interest in this subject was related to the iden-tification of the colouring centres of this quartz variety (Lehmann and Moore 1966; Hutton and Troup 1966; Cohen and Hassan 1974; Cox 1976, 1977; Cohen 1985; Adekeye and Cohen 1986; Halliburton et al. 1989; Rossman 1994; Burkov et al. 2005). However, the knowledge of chemical and structural relationships between Fe and quartz has a fundamental interest in toxi-cology, owing to the fact that Fe has been revealed to be able to modulate health effects due to surface radicals of silica polymorphs (Donaldson and Borm1998; Fubini and Otero Area`n1999).
On the basis of the available crystal chemical informa-tion, Fe was recognised to occur in three valence states (?2, ?3 and?4) as the result of investigations performed with
several different techniques. Through electron paramag-netic resonance (EPR) spectroscopy Fe3?
, in particular, was found to occur in at least six different substitutional centres, either charge uncompensated or compensated by a mono-valent cation (H?
, Li? or Na?
; Mombourquette et al.1986,
1989; Halliburton et al. 1989; Minge et al. 1990; Weil
1994). Fe2?
, on the contrary, was identified as an interstitial F. Di Benedetto (&)M. InnocentiS. TesiM. Romanelli
Department of Chemistry, University of Florence, Florence, Italy e-mail: [email protected]
F. D’Acapito
CNR-INFM-OGG c/o ESRF, Grenoble, France
G. Fornaciai
Department of Florence, ARPAT, Florence, Italy
G. Montegrossi
IGG, CNR, Florence, Italy
L. A. Pardi
IPCF, CNR, Pisa, Italy
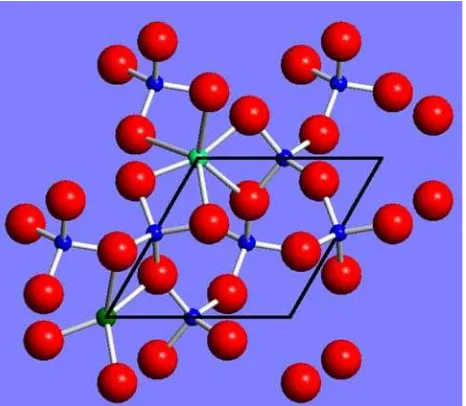
impurity, presumably located in the channels parallel to the
c-axis of the quartz structure (Fig.1; Kihara1990). In the last 15 years, three relevant spectroscopic (XAS, EPR, Mo¨ssbauer) contributions were aimed to finally solve the question concerning the colour centres in amethyst (Cressey et al.1993; Schofield et al.1995; Corteza˜o et al.
2003; Dedushenko et al. 2004). Moreover, these studies attempted to describe the whole crystal chemistry of the Fe content in amethyst.
Cressey et al. (1993) and Schofield et al. (1995) inves-tigated several amethyst samples by means of XAS working at the Fe–L2,3 absorption edge. The obtained
absorption structure evidenced the unambiguous presence of both Fe2?
and Fe3?
species, in a more or less constant ratio. As a consequence, these authors suggested the pos-sible existence of a coupled crystal chemical and crystal-lographic control in the relative abundances of Fe valence states in natural crystals.
A successive study by Corteza˜o et al. (2003) reported the results of a thermally stimulated depolarisation currents and X-band EPR investigation, identifying a prominent abundance of a substitutional Fe3?
impurity coupled with an oxygen trapped hole. The same authors first analysed the EPR spectra of powdered samples, evidencing the disap-pearance of the features of Fe3?
as isolated impurity in quartz, and the contextual appearance of a broad signal, attributed to interacting Fe3?
ions in an amorphous surrounding.
Dedushenko et al. (2004), in a recent study where they provided a unequivocal Mo¨ssbauer evidence of the exis-tence of Fe4?
inc-irradiated quartz (as already described,
by means of electronic spectroscopy by Cox 1976,1977), attributed to substitutional positions the impurity Fe ions, and suggested that this constrained site should have a peculiar bond distance and electronic density. Although Dedushenko et al. (2004) did not express the relative abundance of Fe4?
, the Mo¨ssbauer spectra presented in their study allowed to point out that Fe4?
and Fe3? have comparable abundance.
The present study on amethyst was undertaken with the aim of ascertaining the chemical and structural character-istics of Fe impurities at the local scale, and relate them to its reactivity and bioavailability. The present investigation was performed through Fe K-edge X-ray absorption spec-troscopy, coupled with chemical analysis and DFT calculations.
Experimental and computing procedures
A large single crystal of Brazilian amethyst was cut parallel to the (1, 1,-2, 0) natural surface, realising a flat sample (approximate dimensions, 2093594 mm3), suitable for X-ray absorption measurements both in the conventional and in the reflectance modes. The fresh surface has been successively polished down to 1lm.
Trace element analysis of the investigated sample was obtained by induced coupled plasma-atomic emission spectroscopy (ICP-AES), using an ICP/OES varian instrument. Sample was dissolved in HF, HNO3and HCl in
microwave bomb. Detection limits for the investigated elements were 3, 8, 1, 3, 10 and 10 mg kg-1
for Fe2O3,
Al2O3, Li2O, Na2O, K2O and TiO2, respectively.
XAS measurements were carried out at the European synchrotron radiation facility (ESRF), at the Italian beamline BM08 ‘‘Gilda’’ (d’Acapito et al. 1998). The monochromator was equipped with a pair of Si(111) crystals and was run in the so-called dynamically focusing mode (Pascarelli et al. 1996). The experimental energy resolution was estimated to be about 0.6 eV at the Fe K-edge to be compared with a core hole linewidth of 1.2 eV (Krause and Oliver 1979). The harmonic rejection was achieved by using a pair of Pd-coated mirrors having a cutoff energy of about 18 keV. Spectra have been collected at the Fe K-edge (7.112 keV) in fluorescence mode making use of a high-purity Ge solid-state detector. All spectra were collected at room temperature on a continuously rotating sample holder in order to minimize the effect of coherent diffraction from the crystalline matrix. Energy calibration was checked by measuring a Fe metallic foil before and after each spectrum. The energy calibration was Fig. 1 Quartz structure,c-axis projection (mod. from Lehmann and
Moore1966, and from Rossman1994). Substitutional Fe can occur in all the Si tetrahedral sites (small dark grey spheres). Interstitial (octahedral and large tetrahedral) sites are indicated by mediumgrey spheres
achieved by defining 7,112.0 eV the first inflection point of the absorption spectrum of metallic Fe following the data of Bearden and Burr (1967). The model compounds used as reference of the edge position in the various Fe valence states were hematite, a-Fe2O3, and wustite, FeO (Fig.2).
Model compounds were measured at the same time as a metallic Fe foil for an accurate energy calibration.
EXAFS data were extracted from the raw absorption coefficient spectrum with the ATHENA code and analysed with the ARTEMIS code (Ravel and Newville 2005). Theoretical EXAFS paths for the Fe–O pair were generated with thefeff8.0code (Ankudinov et al.1998) using Muffin Tin potentials and the Hedin–Lundqvist approximation for their energy-dependent part. Data were analysed in the k
range,k=[2.5–10.0] A˚-1
, and were Fourier transformed in the R interval, R=[0.8–2.9] A˚ (see Fig.3). In the Fourier spectrum shown in Fig.3, the two main peaks marked by arrows correspond to the Fe–O and Fe–Si coordination shells. The analysis was carried out by using single scattering paths to reproduce these two features.
Ab initio calculations based on the density functional theory (DFT) were carried out by using the VASP code (Kresse and Hafner 1993). The full potential projected augmented-wave (PAW) method with local spin density generalized gradient approximation (LSD-GGA) was used as implemented in VASP. The calculation was based on a (2*2*2) supercell of 72 atoms taken from the quartz struc-ture (Kihara1990) where a Si atom was substituted with a Fe ion. Different calculations considering Fe as 4?, 3?, ‘High’ and ‘Low’ spin as well as a complex iron?hydrogen were carried out. The reciprocal (k) space was sampled with a single point (C point). In order to account for the strong
localization of the Fedstates, the Hubbard model for the on-site Coulomb interactions was considered with the values of
U=4.5 eV and J=0.9 (Jiang and Guo 2004). A plane wave cutoff of 480 eV was used and convergence criteria were 10-6
eV on the energies in the electronic self-consis-tent loops, and 10-3
eV A˚-1
for forces acting on the atoms in the ionic relaxation loops. Geometry optimizations were carried out by minimizing the atomic forces to the conver-gence values previously specified.
Results
Trace element composition
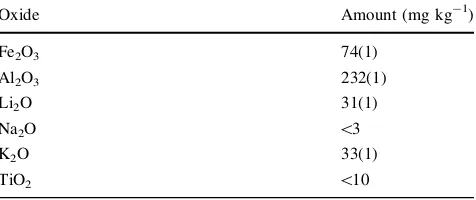
The results of the ICP-AES investigations (Table1) con-firm the presence of the most ubiquitous replacing and interstitial trace ions. Fe content in the sample is compa-rable with other investigated amethyst samples (Schofield et al.1995). Al content is relevant, as well as the amounts of alkaline ions, which act as charge compensators for Al and other trivalent species.
Fig. 2 XANES spectra of amethyst sample compared with model compounds for Fe2?
(wustite) and Fe3?
(hematite) and Fe in Sodium– Silica glass (Gliozzo et al.2009). In theinsetthe pre-edge peak of amethyst sample is reported (dots) together with the fit with 2 lines
(continuous line) and the residual (dashed line)
Fig. 3 Fourier transform of the EXAFS data (shown in the inset). The transform was carried out in the intervalk=[1.1–8.0] A˚-1
with ak2weight. Thearrowsmark the Fe–O and Fe–Si coordination shells
Table 1 Trace element content of the analysed sample
Oxide Amount (mg kg-1)
Fe2O3 74(1)
Al2O3 232(1)
Li2O 31(1)
Na2O \3
K2O 33(1)
X-ray absorption near-edge structure (XANES)
The X-ray absorption near-edge structure (XANES) spectra of the sample, compared with two crystalline and one glass model compounds, is shown in Fig.2. The crystals represent models for the edge position in the case of Fe2?
(wustite) and Fe3?
(hematite) valence states. The glass sample comes from an investigation on Roman glasses (slab labelled FN5 in Gliozzo et al. 2009) for which electron micro probe analysis revealed a dominant sodium-silicate composition (SiO268%, Na2O 17%) and EXAFS revealed Fe in the 3?
state, in agreement with literature on highly sodic glasses (Burkhard2000) with 4 oxygen neighbours at 1.90 A˚ . This compound is used as a reference for the intensity of the pre-edge peak. The pre-edge of the amethyst sample is at a slightly lower energy than that of hematite (Fe3?
) and well above that of wustite (Fe2?
) and the height of the pre-edge peak is about at the same energy position and of the same intensity of that observed in the glass sample. This suggests that Fe is predominantly in the 3?valence state. The energy shift with respect to hematite could be due to different modulations coming from the structure as well as from a minor content of Fe2?
to which XANES is more sensitive than EXAFS (Rovezzi et al.2009).
The peaks appearing in the pre-edge region (7,108– 7,118 eV, inset of Fig.2) were best fitted with a model comprising an arctangent function (modelling the edge jump) plus a double pseudo-Voigt line. We found evidence of two lines at 7,114.6(2) eV with an amplitude (relative to normalized edge jump) of 11 (1)%, and at 7,112.9(3) with an amplitude of 2(1)%. The integrated intensity of this peak is 0.34(1) and its centroid is at 7,114.4(1) eV. Con-sidering that Fe(II) and Fe(III) ions in tetrahedral envi-ronment are reported to exhibit peaks, respectively at 7,112 and 7,114 eV with amplitudes of about 10% (Galoisy et al.
2001), we can derive that Fe is present predominantly in the 3? state with a possible contribution from Fe2?
esti-mated to be less than 20%. This is further confirmed by comparing the values of the integrated intensity and cen-troid values with the reference table established by Wilcke et al. (2001), where the values reported in our sample fall in the region of tetrahedral Fe3?
compounds [an energy shift of 1 eV is apparent due to the fact that the Fe edge was defined in that paper at 7,111.08 instead of 7,112 eV, as in the present case: see the same Table in Giuli et al. (2002)].
Extended X-ray absorption fine structure (EXAFS)
The EXAFS data provide quantitative results on the local geometry around Fe. The best fit result indicates that Fe is coordinated to 2.7(5) O atoms at 1.78(2) A˚ and 1.3(7) Si atoms at 3.14(5) A˚ (Fig.3). Moreover, Fe–O bond length is considerably shorter than that observed in literature for
tetrahedral Fe3?
in silicate glasses (Farges et al. 2004) or crystals (Giuli et al. 2001). The related Debye–Waller factors are, respectively rFe–O2 =0.0077(4) and rFe–Si2 =
0.004(1) A˚2.rFe–O2 is in the same range as that observed for
Fe-bearing silicate glasses (e.g. Giuli et al. 2002; Farges et al. 2004) suggesting the presence of a multiplicity of Fe–O distances.
Density functional theory calculations
DFT calculations were performed to compare and interpret the EXAFS experimental findings. In particular, we have simulated the environment of a Fe4?
and a Fe3? ion substituting for Si in its site in the structure of quartz (Corteza˜o et al.2003; Dedushenko et al.2004). In the latter case the extra positive charge was compensated either with a neutralizing background charge on the cell or by creating a complex with an H?
ion (Mombourquette et al.1986). In this latter case, Fe is inserted in a O tetrahedral site and H compensates one of the O dangling bonds in the same site. A test on the reliability of the pseudopotentials used by DFT was carried out on the structures of fayalite, Fe2?
expanded of about 0.7%, averaging all data on these structures (note that DFT calculation of model structures considered the same potentials, energy cutoff and conver-gence criteria of amethyst calculations; only the k-space mesh considered was made up of 3*3*3 points determined with the Monkhorst–Pack scheme). The data presented here account for this average expansion factor. In both Fe3?
and Fe4?
pure substitutional models DFT finds two pairs of distances with a small difference in length (\0.02 A˚ ) with average values of 1.84 and 1.78 A˚
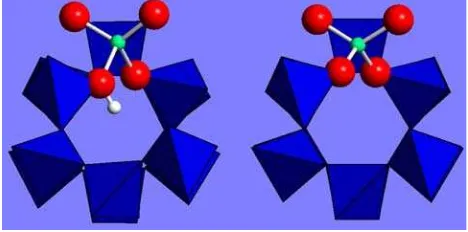
(Table1; Fig.4). A more disordered environment is found for the Fe–H complex, where however, the first shell dis-tance is about 1.81 A˚ for the 3 shortest bonds. For the Fe–
Fig. 4 Structural models of the Fe substitutional sites, obtained from DFT calculations: the Fe3?
:H?
(left) and Fe4?
(right) are shown with
the channels along thec-axis projection. In theleft model, Fe bonds three O ions at 1.81 A˚ and the fourth (bonded to the proton) at 2.06 A˚ ; in theright model, Fe bonds two O ions at 1.78 and two at 1.80 A˚ . SiO4tetrahedra are shown as polyhedra, for clarity
Si shell we note a double distance in Fe4?
, a single distance in Fe3?
and multiple distances in the Fe–H complex. In all cases the Fe ions were found in high spin (HS, electron spin quantum number S =5/2 for Fe3?
and S=2 for Fe4? ) state: for pure substitutional Fe3?
also a calculation forcing a low spin state (LS,S =1/2) was carried out but the cell energy was found to be considerably higher (2.2 eV) than the HS case. The data on Fe–O bond distances are in good agreement with the experimental findings on the average Fe–O bond lengths in tetrahedral coordination (1.89 and 1.80 A˚ for Fe3?
and Fe4?
, respectively) in Na5FeO4 and
Na4FeO4 crystals (Jeannot et al. 2002) and for the Fe–O
distance in tetrahedral Fe3?
sites in tetra-ferriphlogopite (Giuli et al. 2001). Note the reduction of the Fe–O bond length in the Fe3?
–H?
complex that can be attributed to the Coulomb repulsion between these two positive ions that pushes Fe towards the O neighbours.
Discussion
On the basis of the obtained results a detailed insight of the Fe speciation within amethyst can be derived.
Fe coordination
Remarkably, bulk Fe results largely concentrated in a single type of structural site: the XANES data (integrated
intensity and amplitude of the pre-edge peak) as well as EXAFS data: Fe–O distance, 1.78(2) A˚ , and the coordi-nation number, 3.1(5), allow to selectively assign Fe to a tetrahedral (TD) site. The possible occurrence of Fe in the
interstitial octahedral (OH) site (Rossman1994) appears by
far lower than the population of TDsites: the subordinate
occurrence of Fe in interstitial OHcannot, in fact, be ruled
out at all, due to the detection limits of the XAS technique under the present conditions. The obtained results provide a robust indication as far as the nature of the TD site is
concerned. Note in particular that the occurrence of Fe with a peculiar reduced distance to the first neighbour oxygen shell (if compared with literature on Fe3?
ions in glass and crystals; Table2) was predicted by Dedushenko et al. (2004) and perfectly agrees with their Mo¨ssbauer data. On the basis of the present results, therefore, a replacement mechanism involving Fe for Si in their tetrahedral sites can be identified as accounting most of the Fe impurities in amethyst.
Fe valence
The comparison of the computational and EXAFS experi-mental data suggest that the first shell Fe–O and the second shell Fe–Si distances in amethyst compatible with the four-valent state and with the 3? state coupled to H. The occurrence of Fe in low spin state could be another possible solution, but the kind of environment (low spin states are
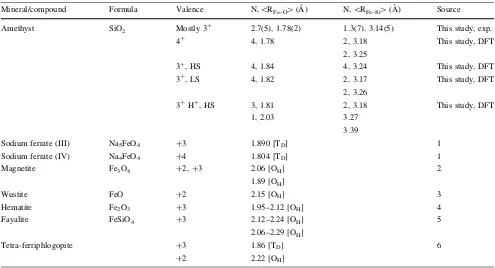
Table 2 Valence, coordination number and mean Fe–O distance of Fe in amethyst and in some reference compounds
Mineral/compound Formula Valence N,\R
Fe–O[(A˚ ) N,\RFe–Si[(A˚ ) Source
Amethyst SiO2 Mostly 3
?
2.7(5), 1.78(2) 1.3(7), 3.14(5) This study, exp. 4?
4, 1.78 2, 3.18
2, 3.25
This study, DFT
3?
, HS 4, 1.84 4, 3.24 This study, DFT
3?
, LS 4, 1.82 2, 3.17
2, 3.26
This study, DFT
3? H?
, HS 3, 1.81 1, 2.03
2, 3.18 3.27 3.39
This study, DFT
Sodium ferrate (III) Na5FeO4 ?3 1.890 [TD] 1
Sodium ferrate (IV) Na4FeO4 ?4 1.804 [TD] 1
Magnetite Fe3O4 ?2,?3 2.06 [OH]
1.89 [OH]
2
Wustite FeO ?2 2.15 [OH] 3
Hematite Fe2O3 ?3 1.95–2.12 [OH] 4
Fayalite FeSiO4 ?3 2.12–2.24 [OH]
2.06–2.29 [OH]
5
Tetra-ferriphlogopite ?3
?2
1.86 [TD] 2.22 [OH]
6
typical of octahedral sites where the crystal field is stron-ger) and the higher energy of the cell found from DFT make this situation unlikely. Nonetheless, the present XANES and most of the literature agree to point out that Fe occurs mainly in the trivalent state. The experimental Fe–O distance, conceivably smaller than that expected for triva-lent Fe in pure substitutional coordination (Table2), could be related to the presence of complexes involving charge compensating cations (Li?
, H?
) that were proposed in literature (Mombourquette et al. 1989; Halliburton et al.
1989) to realize charge neutral complexes with Fe3? . Indeed the calculation on the Fe3?
–H?
complex matches well the experimental data both for the first and the second shell providing a strong evidence of the realization of this structure in amethyst.
The agreement of the DFT calculation performed assuming four-valent Fe with the experimental EXAFS Fe– O distance is also particularly interesting. These results, in fact, fully agree with the Mo¨ssbauer results of Dedushenko et al. (2004). Moreover, it is noteworthy to recall that the present data are not in contrast with the available EPR literature (e.g. Corteza˜o et al. 2003; Weil 1994) which point to a variety of Fe3?
species in quartz. Indeed, Fe4? being an integer spins species, is usually silent at room temperature and X-band EPR spectroscopy.
As noted by Rossman (1994), the controversial data about valence states of Fe in amethyst deserves further experimental confirmations to be fully unravelled. We are aware that, on the basis of the present data, a final assess-ment of the existence of Fe4?
in natural amethyst cannot unambiguously be proposed. Nevertheless, the most rele-vant aspects of the present study allow us to constrain the hypotheses on Fe speciation in amethyst. Accordingly, we suggest that most of Fe occurs in the trivalent state in replacement of Si. The availability of several charge com-pensating ions (Mombourquette et al. 1986, 1989; Halli-burton et al.1989; Minge et al.1990; Weil1994), allows Fe3?
to be accommodated in several ways, with own local structural distortions. Fe4?
, responsible of the appearance of the purple colour in amethyst, occurs in subordinate amount (natural crystals can, of course, present different ratios with respect to the synthetic analysed by Dedushenko et al.2004). Thecirradiation, indicated as oxidising agent
producing Fe4?
(e.g. Rossman 1994; Dedushenko et al.
2004), can act on trivalent Fe ions presenting a very favourable local arrangement, with metal–oxygen distances perfectly suitable for four-valent Fe (Fig.4).
Further high-frequency high-field EPR investigation at very low temperatures are in progress, to verify if appro-priate spectra for Fe4?
can be detected. The combination of high magnetic fields and low temperature, in fact, allows to specifically investigate spin systems with even number of
unpaired electrons (e.g. Telser et al.1998; Nesterova et al.
2008).
A qualitative relationship can be established between the present experimental data and the results proposed by Corteza˜o et al. (2003) on the Fe behaviour when amethyst crystals are crushed or ground. These authors, in fact, observed the complete disappearance of Fe(III) EPR sig-nals of amethyst, and the corresponding appearance of a new broad signal attributed to Fe-oxide clusters. This behaviour could be easily interpreted on the basis of the local structural features of Fe presented here. Fe, replacing Si in a very small site, can act as local centre of crystal fragility when mechanical energy is provided. Accord-ingly, Fe ions would be preferably enriched at the newly generated surfaces, and thus available for further chemical evolution towards thermodynamically more stable phases (as Fe-oxides).
On the basis of the present results, structural and crystal chemical features of Fe in quartz severely modulate its bioavailability, especially when dust inhalation is associ-ated with mechanical and/or thermomechanical treatments.
Acknowledgments The authors acknowledge the Tuscany Admin-istration for funding this research under the programme ‘‘Progetto di ricerca per l’individuazione delle cause di variazione della reattivita` superficiale della silice cristallina, nei principali comparti di lavoro toscani, in relazione alla sua potenziale patogenicita`’’. Italian CNR is also acknowledged for support. Authors acknowledge the European Synchrotron Radiation Facility for provision of synchrotron radiation facilities during experiments SI1593 and SI1773. Authors are also indebted to L. Pellicci of the Ce.Ri.Col Lab. for the ICP-AES investigations, and to N. Capolupo and P. A. Pozzi of the University of Florence and G. Saviozzi for sample preparation. F. dA. acknowledges E. Gliozzo for kindly permitting the publication of the data relative to the glassy sample. The manuscript benefited of the stimulating review by Y. Pan and an anonymous reviewer to whom authors express their warmest thanks.
References
Adekeye JID, Cohen AJ (1986) Correlation of Fe4?
optical anisot-ropy, Brazil twinning and channels in the basal plane of amethyst quartz. Applied Geochem 1(1):153–160
Ankudinov AL, Ravel B, Rehr JJ, Conradson SD (1998) Real-space multiple-scattering calculation and interpretation of X-ray-absorption near-edge structure. Phys Rev B58:7565–7576 Bappu MKV (1953) Spectroscopic study of amethyst quartz in the
ultraviolet and infrared regions. Indian J Phys 27:385–392 Bearden JA, Burr AF (1967) Re-evaluation of X-ray atomic energy
levels. Rev Mod Phys 39:125–142
Blacke RZ, Hessevick RE, Zoltai T, Finger LW (1966) Refinement of the hematite structure. Am Mineral 51:123–129
Bragg L, Claringbull GF (1965) Crystal structure of minerals. In: Bragg L, Claringbull GF (eds) The crystalline state, vol 4. Bell and Sons, London
Burkhard DJM (2000) Iron bearing silicate glasses at ambient conditions. J Non-Cryst Solids 275:175–188
Burkov VI, Egorysheva AV, YuF Kargin, Mar’in AA, Fedotov EV (2005) Circular dichroism spectra of synthetic amethyst crystals. Crystallogr Rep 50(3):461–464
Cohen AJ (1985) Amethyst color in quartz, the result of radiation protection involving iron. Am Mineral 70(11–12):1180–1185 Cohen AJ, Hassan F (1974) Ferrous and ferric ions in synthetic
a-quartz and natural amethyst. Am Mineral 59:719–728 Corteza˜o SU, Pontuschka WM, Da Rocha MSF, Blak AR (2003)
Depolarisation currents (TSDC) and paramagnetic resonance (EPR) of iron in amethyst. J Phys Chem Solids 64:1151–1155 Cox RT (1976) ESR of an S=2 centre in amethyst quartz and its
possible identification as the d4ion Fe4?
. J Phys C Solid State Phys 9:3355–3361
Cox RT (1977) Optical absorption of the d4 ion iron(4?) in pleochroic amethyst quartz. J Phys C Solid State Phys 10(22):4631–4643
Cressey G, Henderson CMB, van der Laan G (1993) Use of L-edge X-ray absorption spectroscopy to characterize multiple valence states of 3d transition metals; a new probe for mineralogical and geochemical research. Phys Chem Miner 20:111
d’Acapito F, Colonna S, Pascarelli S, Antonioli G, Balerna A, Bazzini A, Boscherini F, Campolungo F, Chini G, Dalba G, Davoli I, Fornasini P, Graziola R, Licheri G, Meneghini C, Rocca F, Sangiorgio L, Sciarra V, Tullio V, Mobilio S (1998) GILDA (Italian Beamline) on BM8. ESRF Newsl 30:42–44
Dedushenko SK, Makhina IB, Marin AA, Mukhanov VA, Perfiliev YD (2004) What oxidation state of iron determines the amethyst colour? Hyperfine Interact 156(157):417–422
Donaldson K, Borm PJA (1998) The quartz hazard a variable entity. Ann Occup Hyg 42(5):287–294
Farges F, Lefrere Y, Rossano S, Berthereau A, Calas G, Brown GE Jr (2004) The effect of redox state on the local structural environment of iron in silicate glasses: a combined XAFS spectroscopy, molecular dynamics, and bond valence study. J Non-Cryst Solids 344:176–188
Fubini B, Otero Area`n C (1999) Chemical aspects of the toxicity of inhaled mineral dusts. Chem Soc Rev 28:373–381
Fujino K, Sasaki S, Take´uchi Y, Sadanaga R (1981) X-ray determination of electron distributions in forsterite, fayalite and tephroite. Acta Crystallogr B37:513–518
Galoisy L, Calas G, Arrio MA (2001) High-resolution XANES spectra of iron in minerals and glasses: structural information from the pre-edge region. Chem Geol 174:307–319
Giuli G, Paris E, Wu Z, Brigatti MF, Cibin G, Mottana A, Marcelli A (2001) Experimental and theoretical XANES and EXAFS study of tetra-ferriphlogopite. Eur J Mineral 13:1099–1108
Giuli G, Pratesi G, Cipriani C, Paris E (2002) Iron local structure in tektites and impact glasses by extended X-ray absorption fine structure and high-resolution X-ray absorption near-edge struc-ture spectroscopy. Geochim Cosmochim Acta 66:4347–4353 Gliozzo E, Santagostino Barbone A, D’Acapito F, Turchiano M,
Turbanti Memmi I, Volpe G (2009) The sectilia panels of Faragola (Ascoli Satriano, Southern Italy): a multi-analytical study of the green, marbled (green and yellow), blue and blackish glass slabs. Archaeometry (in press). doi:10.1111/ j.1475-4754.2009.00493.x
Halliburton LE, Hantehzadeh MR, Minge J, Mombourquette MJ, Weil JA (1989) EPR study of Fe3?
ina-quartz: a reexamination of the lithium-compensated center. Phys Rev B40:2076–2081 Hamilton WC (1958) Neutron diffraction investigation of the 119°K
transition in magnetite. Phys Rev 110:1050–1057
Hutton DR, Troup GJ (1966) Paramagnetic resonance centres in amethyst and citrine quartz. Nature 211:621
Jeannot C, Malaman B, Ge´rardin R, Oulladiaf B (2002) Synthesis, crystal, and magnetic structures of the sodium ferrate (IV) Na4FeO4 studied by neutron diffraction and Mo¨ssbauer tech-niques. J Solid State Chem 165:266–277
Jiang X, Guo GY (2004) Electronic structure, magnetism, and optical properties of Fe2SiO4 fayalite at ambient and high pressures: a GGA?U study. Phys Rev B69:155108, 6 pp
Kihara K (1990) An X-ray study of the temperature dependence of the quartz structure. Eur J Mineral 2:63–77
Krause MO, Oliver JH (1979) Natural widths of atomic K and L levels, Ka X-ray lines and several KLL Auger lines. J Phys Chem Ref Data 8:329–338
Kresse G, Hafner J (1993) Ab initio molecular dynamics for liquid metals. Phys Rev B47:558–561
Lehmann G, Moore WJ (1966) Color center in amethyst quartz. Science 152:1061–1062
Minge J, Mombourquette MJ, Weil JA (1990) EPR study of Fe3? in a-quartz: the sodium-compensated center. Phys Rev B42:33–36 Mombourquette MJ, Tennant WC, Weil JA (1986) EPR study of Fe3? ina-quartz: a reexamination of the so-called/center. J Chem Phys 85:68–79
Mombourquette MJ, Minge J, Hantehzadeh MR, Weil JA, Halliburton LE (1989) EPR study of Fe3?
ina-quartz: hydrogen-compen-sated center. Phys Rev B39:4004–4008
Nesterova OV, Petrusenko SR, Kokozay VN, Skelton BW, Jezierska J, Linert W, Ozarowski A (2008) Structural, magnetic, high-frequency and high-field EPR investigation of double-stranded heterometallic [{Ni(en)2}2(l-NCS)4Cd(NCS)2]nnCH3CN poly-mer self-assembled from cadmium oxide, nickel thiocyanate and ethylenediamine. Dalton Trans 2008:1431–1436. doi:10.1039/ b713252b
Pascarelli S, Boscherini F, D’Acapito F, Hrdy J, Meneghini C, Mobilio S (1996) X-ray optics of a dynamical sagittal-focusing monochromator on the GILDA beamline at the ESRF. J Syn-chrotron Rad 3:147–155
Ravel B, Newville M (2005) ATHENA, ARTEMIS, HEPHAESTUS: data analysis for X-ray absorption spectroscopy using IFEFFIT. J Synchrotron Radiat 12:537–541
Rossman G (1994) Coloured varieties of the silica minerals. In: Heaney PJ, Prewitt CT, Gibbs GV (eds) Rev Mineral 29:433– 467
Rovezzi M, D’Acapito F, Navarro-Quezada A, Faina B, Li T, Bonanni A, Filippone F, Amore Bonapasta A, Dietl T (2009) Local structure of (Ga,Fe)N and (Ga,Fe)N:Si investigated by X-ray absorption fine structure spectroscopy. Phys Rev B79:195209. doi:10.1103/PhysRevB.79.195209
Schofield PF, Henderson CMB, Cressey G, van der Laan G (1995) 2p X-ray absorption spectroscopy in the earth sciences. J Synchro-tron Radiat 2:93–98
Telser J, Pardi LA, Krzystek J, Brunel L-C (1998) EPR spectra from ‘‘EPR-silent’’ species: high field EPR spectroscopy of aqueous Chromium(II). Inorg Chem 37:5769–5775
Tumuklu A, Gumus H, Sen S (2008) Role of trace elements in natural amethysts in colouring. Asian J Chem 20(5):4138–4140 Weil JA (1994) EPR of iron centres in silicon dioxide. Appl Magn
Reson 6:1–16