Analyzing Co-Creation Process in Cluster
Industry using Agent-Based Simulation:
Case Study of Cluster Industry Batik Solo
Abstract
At the beginning of 2008, the amount of cluster industry batik in Solo start to grew, with so many innovations, big market (consumers), low cost and high progit margin. The condition is so much different compared to the late 1980. Thus, with agent-based simulation for industrial cluster, the aims of the research are to understand what mechanism can describe the formation of cluster industry batik in Solo. There are three agents modeled in the simulation; consumers, producers, and suppliers. Each agent has own attributes and decision rule. As the result, the simulation can describe that industrial cluster is formed as bottom-up interaction between agents with interdependency decision-making. In the long term, only producer agent that agglomerate with other industry can survive and the average wealth of each agent will increase along with the density cluster of certain industrial cluster. Several policies can be implemented to stimulate the industrial cluster formation are creating join-showroom, build waste-water treatment for several industries, renovate the facilities (access) to the cluster industries.
Keywords:service science, cluster industry, agent-based simulation, cluster industry batik Solo
Abstrak
Di awal tahun 2008, jumlah pengusaha batik di Solo mulai berkembang, dengan beragam inovasi yang dimiliki, jumlah konsumen yang banyak, biaya produksi yang murah dan tingkat keuntungan yang tinggi.Kondisi tersebut sangat jauh berbeda dibandingkan pada tahun 1980-an. Oleh karena itu, dikembangkanlah simulasi berbasis agen untuk klaster industry dengan tujuan untuk memahami mekanisme yang dapat menjelaskan proses terbentuknya klaster industri batik di Solo. Terdapat tiga
Utomo Sarjono Putro Pri Hermawan Dhanan Sarwo Utomo
Shimaditya Nuraeni Khrisna Ariyanto
jenis agen yang dimodelkan dalam simulasi ini, yaitu :konsumen, produsen dan supplier. Setiap agen memiliki atribut dan role keputusan yang berbeda-beda.Hasil dari simulasi ini dapat menjelaskan bahwa industry klaste rterbentuk sebagai akibat dari interaksi bottom-up antar agen dan role keputusan yang dimiliki oleh masing-masing agen. Dalam jangka panjang, hanya industri yang mengelompok dengan industry lainnya yang dapat bertahan dan berkelanjutan. Beberapa strategi yang dapat diimplementasi dalam rangka mempercepat pertumbuhan klaster industry adalah dengan membangun showroom bersama, pengolahan air limbah bersama, dan memperbaiki akses menuju lokasi klaster industri.
Kata kunci:service science, klaster industri, simulasi berbasis agen, klaster industri batik Solo
1. Introduction
Batik is traditional clothing that has become an identity of Indonesian, especially in Java areafor hundreds of years. Among various batik craft centers in Java, Solo (Surakarta) batik is considered as the appropriate representative of Javanese traditional culture. This can be understood since the past, Solo was known as a center of a great empire of Mataram that controlled most of Java region. There are some centers of batik crafts and commerce in Surakarta, such as Laweyan, Kauman and PasarKlewer.
Table 1. Solo Industrial Data in 2006
Urgency of Industrial Cluster Industry
In 2006 data from Biro Pusat Statistik/ BPS (Central Bureau of Statistic), Sensus Ekonomi 2006 :Analisa Ketenagakerjaan, most of business units (99.4%) in Indonesia were in small and micro scale.
Table 3. Number of Business Units and Workers Based on Sector and Scale
No Item Number of 1 Small Industry 24,954 57,859,790 4,239,889,800 1,061 2 Medium Industry 7,560 45,870,748 1,127,798,350 85 3 Large Industry 10,608 297,795,960 1,017,089,000 41 4 Non Formal 12,055 15,071,040 1,592,397,420 4,070 TOTAL 55,177 416,633,538 7,977,174,570 5,257 Source :(Soebagiyo, 2008)
By 2006, more than 80% of workers in Solo private sector were absorbed by micro, small and medium business units. Among those units, batik industry contributes to more than 65% of total industrial value. It reflects role important of batik industry to regional income of Solo.
Table 2. Product of Micro, Small, and Medium Industries in Solo (2006)
No Product/ Industry
Production Value/Year (in 000)
Investment Business Unit Number of Workers Capacity/Year Production
1 Musical Instrument 270,225 138,380,000 2 68 3,603
2 Batik and Batik Product 48,008,448,000 672,333,340 7 108 480,084,480
3 Workshop 480,334,240 772,350,000 13 91 12,008,356
24 Textile and Textile Product 25,271,415,000 663,385,000 10 2,523 336,952,200
25 Scale 72,750 251,560,000 4 34 4,850
26 Transportation 22,000 40,000,000 1 7 400
Source :(Soebagiyo, 2008)
No. Sector
Micro and Small Medium and Large Total Business 2 Processing Industry 3,194,461 7,817,110 29,468 4,755,703 3,223,929 12,572,813 3 Electricity, Gas, and Clean Water 10,677 23,370 749 89,648 11,426 113,018
4 Property 157,381 819,271 4,609 68,365 161,990 887,636 5 Trading, Hotel, and Restaurant 13,221,453 22,679,805 61,705 891,230 13,283,158 23,571,035 6 Transportation and
Communication
2,684,486 3,327,107 10,704 258,361 2,695,190 3,585,468
7 Financial, Rental, and Corporate Service
851,747 1,668,103 23,629 2,170,317 875,376 3,838,420
8 Services 2,147,567 7,048,682 11,752 620,682 2,159,319 7,669,364 Total 22,513,552 43,911,721 143,194 8,932,437 22.656.746 52,844,158
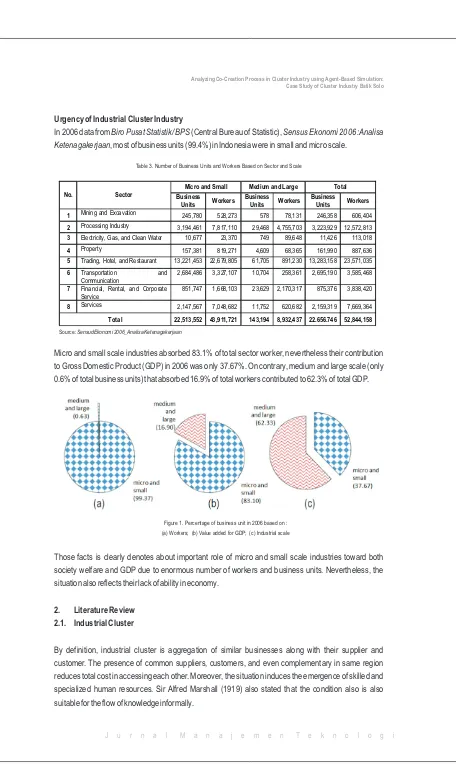
Micro and small scale industries absorbed 83.1% of total sector worker, nevertheless their contribution to Gross Domestic Product (GDP) in 2006 was only 37.67%. On contrary, medium and large scale (only 0.6% of total business units) that absorbed 16.9% of total workers contributed to 62.3% of total GDP.
Source :SensudEkonomi 2006_Analisa Ketenagakerjaan
Figure 1. Percentage of business unit in 2006 based on : (a) Workers; (b) Value added for GDP; (c) Industrial scale
Those facts is clearly denotes about important role of micro and small scale industries toward both society welfare and GDP due to enormous number of workers and business units. Nevertheless, the situation also reflects their lack of ability in economy.
2. Literature Review 2.1. Industrial Cluster
jenis agen yang dimodelkan dalam simulasi ini, yaitu :konsumen, produsen dan supplier. Setiap agen memiliki atribut dan role keputusan yang berbeda-beda.Hasil dari simulasi ini dapat menjelaskan bahwa industry klaste rterbentuk sebagai akibat dari interaksi bottom-up antar agen dan role keputusan yang dimiliki oleh masing-masing agen. Dalam jangka panjang, hanya industri yang mengelompok dengan industry lainnya yang dapat bertahan dan berkelanjutan. Beberapa strategi yang dapat diimplementasi dalam rangka mempercepat pertumbuhan klaster industry adalah dengan membangun showroom bersama, pengolahan air limbah bersama, dan memperbaiki akses menuju lokasi klaster industri.
Kata kunci:service science, klaster industri, simulasi berbasis agen, klaster industri batik Solo
1. Introduction
Batik is traditional clothing that has become an identity of Indonesian, especially in Java areafor hundreds of years. Among various batik craft centers in Java, Solo (Surakarta) batik is considered as the appropriate representative of Javanese traditional culture. This can be understood since the past, Solo was known as a center of a great empire of Mataram that controlled most of Java region. There are some centers of batik crafts and commerce in Surakarta, such as Laweyan, Kauman and PasarKlewer.
Table 1. Solo Industrial Data in 2006
Urgency of Industrial Cluster Industry
In 2006 data from Biro Pusat Statistik/ BPS (Central Bureau of Statistic), Sensus Ekonomi 2006 :Analisa Ketenagakerjaan, most of business units (99.4%) in Indonesia were in small and micro scale.
Table 3. Number of Business Units and Workers Based on Sector and Scale
No Item Number of
1 Small Industry 24,954 57,859,790 4,239,889,800 1,061
2 Medium Industry 7,560 45,870,748 1,127,798,350 85
3 Large Industry 10,608 297,795,960 1,017,089,000 41
4 Non Formal 12,055 15,071,040 1,592,397,420 4,070
TOTAL 55,177 416,633,538 7,977,174,570 5,257
Source :(Soebagiyo, 2008)
By 2006, more than 80% of workers in Solo private sector were absorbed by micro, small and medium business units. Among those units, batik industry contributes to more than 65% of total industrial value. It reflects role important of batik industry to regional income of Solo.
Table 2. Product of Micro, Small, and Medium Industries in Solo (2006)
No Product/ Industry
Production Value/Year (in 000)
Investment Business Unit Number of Workers Capacity/Year Production
1 Musical Instrument 270,225 138,380,000 2 68 3,603
2 Batik and Batik Product 48,008,448,000 672,333,340 7 108 480,084,480
3 Workshop 480,334,240 772,350,000 13 91 12,008,356
24 Textile and Textile Product 25,271,415,000 663,385,000 10 2,523 336,952,200
25 Scale 72,750 251,560,000 4 34 4,850
26 Transportation 22,000 40,000,000 1 7 400
Source :(Soebagiyo, 2008)
No. Sector
Micro and Small Medium and Large Total
Business
2 Processing Industry 3,194,461 7,817,110 29,468 4,755,703 3,223,929 12,572,813 3 Electricity, Gas, and Clean Water 10,677 23,370 749 89,648 11,426 113,018
4 Property 157,381 819,271 4,609 68,365 161,990 887,636
5 Trading, Hotel, and Restaurant 13,221,453 22,679,805 61,705 891,230 13,283,158 23,571,035
6 Transportation and
Communication
2,684,486 3,327,107 10,704 258,361 2,695,190 3,585,468
7 Financial, Rental, and Corporate Service
851,747 1,668,103 23,629 2,170,317 875,376 3,838,420
8 Services 2,147,567 7,048,682 11,752 620,682 2,159,319 7,669,364
Total 22,513,552 43,911,721 143,194 8,932,437 22.656.746 52,844,158
Micro and small scale industries absorbed 83.1% of total sector worker, nevertheless their contribution to Gross Domestic Product (GDP) in 2006 was only 37.67%. On contrary, medium and large scale (only 0.6% of total business units) that absorbed 16.9% of total workers contributed to 62.3% of total GDP.
Source :SensudEkonomi 2006_Analisa Ketenagakerjaan
Figure 1. Percentage of business unit in 2006 based on :
(a) Workers; (b) Value added for GDP; (c) Industrial scale
Those facts is clearly denotes about important role of micro and small scale industries toward both society welfare and GDP due to enormous number of workers and business units. Nevertheless, the situation also reflects their lack of ability in economy.
2. Literature Review 2.1. Industrial Cluster
Good-dominant logic paradigm is indicated by:
a) transactional approach that counts heavily in selling frequency,
b) stress on both production and distribution efficiency that consequent to both standardization and keeping,
c) value-in-exchange, that regards a consumer as a value-destructor.
The paradigm put the achievement of customer needs to low priority.
On the other hand, service-dominant logic emphasizes on value-in-use, customer satisfaction during the use of a good. The approach also treats a consumer as a value-creator. Collaboration between producer and consumer will then emerge value co-creation. Strict status boundary between producer and consumer also made obscure, since it considers that both producer and consumer supply service to teach other. On one side, a consumer needs a producer capability in delivering service (both direct and indirect). On the other side, a producer also exacts a customer that has capability to utilize his (producer's) service.
The development of information and communication technology permits faster and unbridled information. The situation eases the process in searching of new reliable supplier. Moreover, information about disillusionment also can be obtained easily. Contrary to good-dominant logic approach, service-dominant logic stresses on the achievement of severe consumer needs (Vargo, Lusch, Akaka, 2010).
2.3. Relation between Industrial Cluster and Service Science
An individual (or group of individuals) status in a society cannot be categorized strictly. An individual is not only a service provider (producer), rather he also acts as consumer of other products (services). Various economical systems in a society both interact to and support each other. Granovetter (1985) stated that an economical system cannot be isolated from social system in a society. Kumar (2005) exhibited the textile industrial cluster in Tirupur, Southern India where the people had been forged historically as suppliers of cluster elements, such as artist, production machines technician, and labor.
Research conducted by Piore and Sabel (1984) showed that the marketing of mass product had reached saturation state. Otherwise, various consumers demand some products that can fulfill their needs specifically. The facts indicate that service science is expected to play more important roles in future industrial cluster development.
2.4. Agent-Based Simulation
Agent-based simulation can be defined as a simulation of a system that consists of a number of software individuas, called agent. In this simulation, agentscan interact with each other and with their environment (Gilbert, 2004; Smith &Conrey, 2007). In agent based model, an agent can have one to one relationshipwith an actor in the real world while, interactions among agents can likewisecorrespond to the interactions between real world actors (Gilbert, 2004). In agent based simulation, agents are programmed to have the followingcharacteristics:
a) Discrete: An agent is self contained individual with identifiableboundaries (Smith & Conrey, 2007).
b) Interdependent: Agents live in an environment that is inhabited otheragents (Smith & Conrey, 2007).
The development of industrial cluster is marked by some substantial factors such as technological transfer, knowledge transfer, the development of skilled workers, and infrastructure (Kumar, 2005). Piore and Sabel (1984) reported that market had been saturated with mass products. They found that small industrial cluster in Italy successfully produced and marketed some handicrafts such as textile and furniture. The success was made possible by their flexibility in responding market demand in several areas, while maintaining the quality.
Porter (1990) declared that competition is a driving force of the growth of industrial cluster, since clustering is a dynamic process. Fruitfulness of a company in a competition increases customer demand, the growth generates contagion effect toward other companies in the cluster to develop. Nadvidan Schmitz (1999) argued that the flow of both human and physical resources reduced investment risk, since the companies in the cluster support each other whether consciously or not. Arrow (1962) concluded that externality of Marshall-Arrow-Romer exhibits that knowledge accumulation of a company in a cluster would trig the technological development of surrounding companies.
He also mentioned that localized industries gain from knowledge stream and consequence to their rapid growth. Close location with both supplier and customer (and also other cluster components) eases their interaction as written by Porter (1990). In his book, the Competitive Advantage of Nations, Porter stated: “The cluster is the manifestation of the diamond at work. Proximity, arising from the co-location of companies, customers, suppliers, and other institutions, amplifies all of the pressures to innovate and upgrade.”
Easiness to interact allows cluster elements to respond each demand and even technical problem effectively and efficiently. New Okhla Industrial Development Area, an automotive industrial cluster in India provided the evidence (Kumar, 2005). Evans (1985) addressed that cost reduction is permitted by some similar business that locate in same region. An industrial cluster often has unique character that is different to other clusters (even if their business is in the same sector). Interaction among some companies in the beginning of cluster development and the events faced evolve their identity. Therefore, industrial cluster would be very difficult to re-orient industrially (Nadvi, 1999).
Reputation of a cluster in both innovating and maintaining their quality plays a very important role to sustainability of customer arrival and afterward affects the development of the cluster. Saxenian (1994) appointed Silicon Valley which is known as an industrial cluster that specializes in both designing and innovating. He also addressed Harley Street and Saville Row in London that fames by its medical quality and sewing service (Panditet.al., 2001). Jacob (1969, 1984) put forward that people tend to visit a location that allows them to find most of their needs, rather than travelling from area to area. He cited both Manchester and Glasgow that were influenced by the condition.
2.2. Service Science
The first advantage of agent based simulation lays on its communicative ability.Basically, any researcher who tries to make a projection or imagining a socialdynamics is running a model (Epstein, 2008). The most important thing fora researcher is, whether he/she is able to make an explicit model or not (Epstein, 2008). Before simulations method become famous, there are two generalways to specify a model namely, verbal representation and mathematical equation.The difficulty with verbal representation is that is it hard for the researcher andthe reader to determine precisely the implication of the ideas being put forward(Gilbert & Terna, 2000). Mathematical equations can communicate a modelwith much more precision than the verbal representation.
Representation also has weakness. Many of the mathematical equations are toocomplicated to be analytically tractable (Gilbert & Terna, 2000). The commonsolution is to make simplifications (for example, by ignoring the heterogeneity ofthe actual population an only looking for the mean behavior) until the equationsbecome solvable (Gilbert & Terna, 2000; Axtell, 2003). Unfortunately,sometimes these assumptions are implausible and can make the resulted theoriesseriously misleading (Gilbert & Terna, 2000).
To create a simulation model, it is a must to specify every assumption very clearly(Axelrod, 2003; Gilbert, 2004). This means that the model is potentially opento inspection by other researchers, in all its detail (Gilbert, 2004). Furthermore,after the simulation is run, the model can be calibrated with the current data and agents based models can vary in the complex rules usually adopt. But, this kind ofsensitivity analysis can be carried out so researchers can test the impacts of everyassumption .
Agent based simulation can minimize the number of simplifications used byits ability to fully represents individuals and model bounded rational behavior(Axelrod, 2003). Besides, there is no difficulty to represent non linear interactionwithin a computer simulation (Gilbert & Terna, 2000). In short, agent basedsimulation can offer alternative solution when mathematical equation isintractable (Axelrod, 2005). Many social phenomena require multidisciplinary study (Epstein, 1999;Axelrod, 2005). The nature of programming language that is more expressivethan verbal language and less abstract than mathematical equation , enableresearcher to model both quantitative and qualitative theories (Gilbert & Terna,2000). Therefore, agent based simulation can facilitate the collaboration amongdisciplines (Axelrod, 2005).
Another advantage of agent based simulation is that it places much lowerdemands on data. It is very difficult to acquire appropriate data to understand thedynamics within the society (Gilbert, 2004). Qualitative data from interviews,records and observations can describe effectively the emergence institutionfrom individual actions. But, due the nature of the data most analysis inevitablyremains somewhat impressionistic (Gilbert, 2004; Johnson & Onwuegbuzie,2004; Johnson & Christensen, 2007).
Studies based on quantitative data canprovide more precision (Gilbert, 2004; Johnson & Onwuegbuzie, 2004). But,most survey data treats peoples as isolated atom and pay little attention to theinteractions among people (Gilbert, 2004). Another weakness of survey methodis that they come from measurements made at one moment of time (Gilbert,2004). This way, individual changes and effect of these changes are invisible forthe analysis (Gilbert, 2004; Zawawi, 2007).
The behavior of an agent will changesome aspect of the inveronment which in turn affect the behavior of otheragents (Macy & Willer, 2002).
c) Active: Each agent have their own rules and strategies to interact withanoher agents and the
environment (Jennings, Faratin, Johnson, Norman,O'Brien, & Wiegand, 1996; Epstein J. M., 1999; Smith & Conrey, 2007).
d) Limited information: Each agents have only limited information. They areonly able to gaher informations from their local environment (for example:neighboring agents) (Epstein J. M., 1999; Smith & Conrey, 2007).
e) Autonomous: An agent has its own internal goals and is self directedin choose behaviors to pursue those goals (Jennings, Faratin, Johnson,Norman, O'Brien, & Wiegand, 1996; Epstein J. M., 1999; Macy & Willer,2002; Smith & Conrey, 2007).
f) Agent follow simple rule: Agents are assumed to gather information andgenerate behaviors by
relatively simple rules (Macy & Willer, 2002; Smith& Conrey, 2007).
g) Adaptation: Some models assume that agent can modify their rules basedon agent's experience
(Jennings, Faratin, Johnson, Norman, O'Brien, &Wiegand, 1996; Macy & Willer, 2002; Smith & Conrey, 2007).
Usually, a simulation model aims to produce a prediction. But, the aim of agentbased simulation is rather different. The main reason for this is because, thesocial processes are complex and a simulation model will hardly poses sufficientaccuracy for prediction (Srbljinoviæ & Škunca, 2003). But, there are many
usefulpurposes other than prediction that can be achieved by creating a simulationmodel, for example:
a) Explanation:process (Hartmann, 1996; Epstein, 2008). For example, the electrostaticmodel can
explain how a lightning occur, however, it cannot predict whenand where the lightning will appear. Specific for agent based simulation,the model aims to explain the emergence pattern caused by the interactionsamong agents (Srbljinoviæ & Škunca, 2003).
b) Illuminate core dynamics: A model can be used to clarify an abstraction,and strengthen human
basic intuition (Smith & Conrey, 2007; Epstein,2008)that explore plausible mechanism that may underline observed patterns( Hartmann, 1996; Macy & Willer, 2002). Experiment can generate hypotheses (Hartmann, 1996; Carley, 1999)or even discover new relationship (Gilbert & Terna, 2000; Axelrod, 2003).
c) To guide data collection: Considering the ability of simulation model togenerate hypotheses and discover new relationship, its ability to guide datacollection process can be realized (Carley, 1999; Epstein, 2008).
d) Suggest analogies:seem related can have the same formal form. For example, the algebraicform
of Coulomb law is identical to the Newton's law of gravity. Bycreating a model, researcher can make an analogy of a process by the otherprocess and compare the behavior of both processes.
A model can have a goal to explain a phenomenon or agent based simulation model can aid thought experiments by conducting thought a number of varieties of processes that does notis possibility that laws and theories in the analogical can also be appliedthe target process (Epstein,2008).
The first advantage of agent based simulation lays on its communicative ability.Basically, any researcher who tries to make a projection or imagining a socialdynamics is running a model (Epstein, 2008). The most important thing fora researcher is, whether he/she is able to make an explicit model or not (Epstein, 2008). Before simulations method become famous, there are two generalways to specify a model namely, verbal representation and mathematical equation.The difficulty with verbal representation is that is it hard for the researcher andthe reader to determine precisely the implication of the ideas being put forward(Gilbert & Terna, 2000). Mathematical equations can communicate a modelwith much more precision than the verbal representation.
Representation also has weakness. Many of the mathematical equations are toocomplicated to be analytically tractable (Gilbert & Terna, 2000). The commonsolution is to make simplifications (for example, by ignoring the heterogeneity ofthe actual population an only looking for the mean behavior) until the equationsbecome solvable (Gilbert & Terna, 2000; Axtell, 2003). Unfortunately,sometimes these assumptions are implausible and can make the resulted theoriesseriously misleading (Gilbert & Terna, 2000).
To create a simulation model, it is a must to specify every assumption very clearly(Axelrod, 2003; Gilbert, 2004). This means that the model is potentially opento inspection by other researchers, in all its detail (Gilbert, 2004). Furthermore,after the simulation is run, the model can be calibrated with the current data and agents based models can vary in the complex rules usually adopt. But, this kind ofsensitivity analysis can be carried out so researchers can test the impacts of everyassumption .
Agent based simulation can minimize the number of simplifications used byits ability to fully represents individuals and model bounded rational behavior(Axelrod, 2003). Besides, there is no difficulty to represent non linear interactionwithin a computer simulation (Gilbert & Terna, 2000). In short, agent basedsimulation can offer alternative solution when mathematical equation isintractable (Axelrod, 2005). Many social phenomena require multidisciplinary study (Epstein, 1999;Axelrod, 2005). The nature of programming language that is more expressivethan verbal language and less abstract than mathematical equation , enableresearcher to model both quantitative and qualitative theories (Gilbert & Terna,2000). Therefore, agent based simulation can facilitate the collaboration amongdisciplines (Axelrod, 2005).
Another advantage of agent based simulation is that it places much lowerdemands on data. It is very difficult to acquire appropriate data to understand thedynamics within the society (Gilbert, 2004). Qualitative data from interviews,records and observations can describe effectively the emergence institutionfrom individual actions. But, due the nature of the data most analysis inevitablyremains somewhat impressionistic (Gilbert, 2004; Johnson & Onwuegbuzie,2004; Johnson & Christensen, 2007).
Studies based on quantitative data canprovide more precision (Gilbert, 2004; Johnson & Onwuegbuzie, 2004). But,most survey data treats peoples as isolated atom and pay little attention to theinteractions among people (Gilbert, 2004). Another weakness of survey methodis that they come from measurements made at one moment of time (Gilbert,2004). This way, individual changes and effect of these changes are invisible forthe analysis (Gilbert, 2004; Zawawi, 2007).
The behavior of an agent will changesome aspect of the inveronment which in turn affect the behavior of otheragents (Macy & Willer, 2002).
c) Active: Each agent have their own rules and strategies to interact withanoher agents and the environment (Jennings, Faratin, Johnson, Norman,O'Brien, & Wiegand, 1996; Epstein J. M., 1999; Smith & Conrey, 2007).
d) Limited information: Each agents have only limited information. They areonly able to gaher informations from their local environment (for example:neighboring agents) (Epstein J. M., 1999; Smith & Conrey, 2007).
e) Autonomous: An agent has its own internal goals and is self directedin choose behaviors to pursue those goals (Jennings, Faratin, Johnson,Norman, O'Brien, & Wiegand, 1996; Epstein J. M., 1999; Macy & Willer,2002; Smith & Conrey, 2007).
f) Agent follow simple rule: Agents are assumed to gather information andgenerate behaviors by relatively simple rules (Macy & Willer, 2002; Smith& Conrey, 2007).
g) Adaptation: Some models assume that agent can modify their rules basedon agent's experience (Jennings, Faratin, Johnson, Norman, O'Brien, &Wiegand, 1996; Macy & Willer, 2002; Smith & Conrey, 2007).
Usually, a simulation model aims to produce a prediction. But, the aim of agentbased simulation is rather different. The main reason for this is because, thesocial processes are complex and a simulation model will hardly poses sufficientaccuracy for prediction (Srbljinoviæ & Škunca, 2003). But, there are many
usefulpurposes other than prediction that can be achieved by creating a simulationmodel, for example:
a) Explanation:process (Hartmann, 1996; Epstein, 2008). For example, the electrostaticmodel can
explain how a lightning occur, however, it cannot predict whenand where the lightning will appear. Specific for agent based simulation,the model aims to explain the emergence pattern caused by the interactionsamong agents (Srbljinoviæ & Škunca, 2003).
b) Illuminate core dynamics: A model can be used to clarify an abstraction,and strengthen human basic intuition (Smith & Conrey, 2007; Epstein,2008)that explore plausible mechanism that may underline observed patterns( Hartmann, 1996; Macy & Willer, 2002). Experiment can generate hypotheses (Hartmann, 1996; Carley, 1999)or even discover new relationship (Gilbert & Terna, 2000; Axelrod, 2003).
c) To guide data collection: Considering the ability of simulation model togenerate hypotheses and discover new relationship, its ability to guide datacollection process can be realized (Carley, 1999; Epstein, 2008).
d) Suggest analogies:seem related can have the same formal form. For example, the algebraicform of Coulomb law is identical to the Newton's law of gravity. Bycreating a model, researcher can make an analogy of a process by the otherprocess and compare the behavior of both processes.
A model can have a goal to explain a phenomenon or agent based simulation model can aid thought experiments by conducting thought a number of varieties of processes that does notis possibility that laws and theories in the analogical can also be appliedthe target process (Epstein,2008).
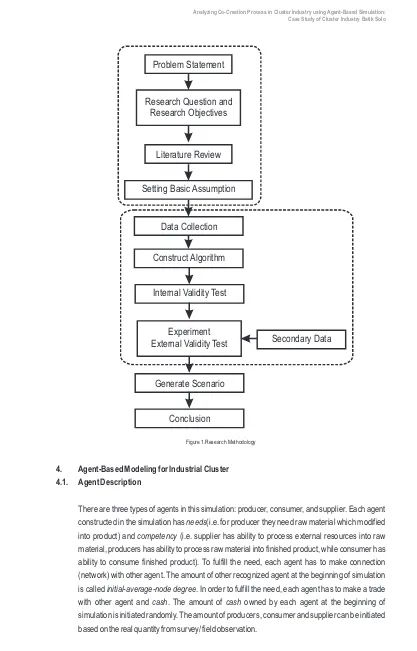
Figure 1.Research Methodology Agents based approach start with the deductive perspective by constructingsimulation correspond to
one's theory about society (Gilbert, 2004). Constructing a simulation, input data can be calibrated from whatever data isavailable and then used to derive testable propositions and relationships (Gilbert,2004). Data generated by the simulation runs then summarized, so it can betested against the real data (inductive part of agent based approach) (Carley, 1999;Gilbert, 2004). This way, agent based simulation approach places much lowerdemands on the data while, the models can truly reflect the complex nature of thesociety (Epstein, 1999; Gilbert, 2004).
Of course agent based model approach also has weaknesses. Most agent basedmodel and the theory on which they are based, are stochastic (they are based inpart on random chance) (Carley, 1999; Gilbert, 2004). Its means that it will be difficult to determinewhether, the observed pattern is the general pattern or just anomalies.Besides, many different agent-based models can show the same emergencepattern. Therefore, similarity between the pattern in the real world and one thatemerges from the model is not sufficient to conclude that, mechanism used in themodel is the same mechanism that applies in the real world (Gilbert, 2004).
3. Research Methodology
The research starts from defining the problem, construct the research questions and research objectives. Then literature reviews done to collect information of the previous research related to agent-based modeling, sustainable small and medium enterprise (SSME), and cluster industry. Based on the literature review, several basic assumptions for the model is set. Literature review can be used as guidance to identified necessary variable on the data collection process or survey.
The second phase of the research is collecting data. The data are collected through observation and discussion with stakeholders in industrial cluster Batik Solo.
The third phase is constructing the agent-based simulation model. On this phase, the algorithms of the model are deducted using information from the second phase. Then those mechanisms are built in computer simulation. Internal validation for the model is necessary to test the validation of simulation conceptually, and verify the simulation model. Conceptual validation test the whether proposed model is proper to fulfill the research objectives , while verification aims to eliminate errors from the programs.
The next phase of this research is do experiment. The aims of the experiment are to explore the possible dynamics results of several policy scenarios. It also aims to test the external validation of the model.
Last phase of the research is generated initiative strategy that will improve the cluster industry formation (i.e. municipal government rule, resource allocation, communication strategy, marketing strategy, etc).
4. Agent-Based Modeling for Industrial Cluster 4.1. Agent Description
There are three types of agents in this simulation: producer, consumer, and supplier. Each agent constructed in the simulation has needs(i.e. for producer they need raw material which modified into product) and competency (i.e. supplier has ability to process external resources into raw material, producers has ability to process raw material into finished product, while consumer has ability to consume finished product). To fulfill the need, each agent has to make connection (network) with other agent. The amount of other recognized agent at the beginning of simulation is called initial-average-node degree. In order to fulfill the need, each agent has to make a trade with other agent and cash. The amount of cash owned by each agent at the beginning of simulation is initiated randomly. The amount of producers, consumer and supplier can be initiated based on the real quantity from survey/ field observation.
Problem Statement
Research Question and
Research Objectives
Literature Review
Data Collection
Internal Validity Test
Secondary Data
Experiment
External Validity Test
Generate Scenario
Conclusion
Setting Basic Assumption
5. Experiment
Experiment in this research aims to (1) test whether the simulation can describethe phenomenon of cluster industry formation, (2) to analyze the benefit of cluster industry formation to each agent. At the beginning of the experiment process, each agent's position is set randomly. From all the amount of agents set into the simulation, the proportion of each agent will be producers, suppliers or consumers were dividing equally. After setting up the agent and the average-node-degree, then the simulation run for more than 6000 ticks. One tick represents one process of trading.
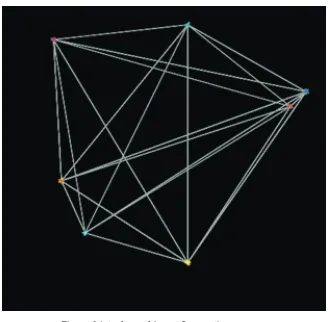
Figure 3 below show how each agent connect each other. The link between each node represents how far each agent located to other agent. The node represents the agent. The further the link between the agent, the higher the delivery cost between each agent. If one agent has negative balance sheet, they will be eliminated from the simulation, along the the creation of new agent (randomly) and their netwok (connection to other agent) randomly.
4.2. Simulation Mechanism
There are five submodels constructed in Agent-Based Simulation for Industrial Cluster. First is
agent's business and economic model, consist of how the price determination, and profit and capital calculation. Second is agent's network model, which consists of how the network is build,
decision to choose producer/ supplier). Third is agent's skill specialization model, where
differentiate the basic skill for consumer agent, producer agent, and supplier agent. Fourth is
product and production model consists of how to decide the quantity of needed material, how many products will be made, and production cost and selling price calculation. Last is trading mechanism among agents.
The numbers of agents (producers, consumers, and suppliers) are fixand each agents has their own needs and competencies. At the beginning of simulation, each agentare connected randomly, and only able to interact through these connections. Then, there will be production process and trading mechanism between agents (to fulfill their needs). For agents with negative balance sheet, they will be eliminated from the simulation, along with the creation of new agent (randomly). The simulation runs for several years with the monitored output are density of the industrial cluster and average wealth (of consumers, producers, and suppliers).
4.3. Decision Rule Mechanism
For consumer agent, at first they generate their current needs. Then they choose the producer. From all alternative producers, the consumer will sort producers that sell the cheapest product and cheapest shipping/ delivery cost. If the amount of finished products owned by certain producer with the cheapest price and cheapest shipping/ delivery cost equal or more than the amount of products needed by the consumer, then the consumer only buy the finished product from one producer. If the amount of finised product from certain producer with the cheapest price and cheapest shipping/ delivery cost less than the amount of product needed by the consumer, then the consumer will buy the rest of they need from the second-cheapest producers. Trading between consumer and producer happens after the consumer chose the producer.
For producer agent, after the agent generates their need, they choose suppliers from their connected network. The role for choosing the supplier similar with the consumer, which is choose the supplier with the cheapest price and cheapest shipping/ delivery cost. If the amount of raw material owned by the cheapest supplier equal or more than the producer need,then the producer will buy from one supplier. Otherwise the producer will buy the rest of they need from the second-cheapest supplier. The products made by producer are based on the amount of raw material the producer has. Then, the producer set the price for the product as a function of total production cost with 10% profit margin.
For supplier agent, they convert the external resourves into raw material. The cost for this process is assumed constant (fix). Then, the supplier set the price for raw material as a function of total production cost with 10% profit margin.
Figure 4a below show the average-agent wealth because of the trading. On the long term, the average wealth for agents will increase.
Figure 4b below show the density of agents in certain area formed cluster industry. The denser of one cluster industry is the higher average wealth of agent in the cluster industry.
Figure 3.Interface of Agent Connection
5. Experiment
Experiment in this research aims to (1) test whether the simulation can describethe phenomenon of cluster industry formation, (2) to analyze the benefit of cluster industry formation to each agent. At the beginning of the experiment process, each agent's position is set randomly. From all the amount of agents set into the simulation, the proportion of each agent will be producers, suppliers or consumers were dividing equally. After setting up the agent and the average-node-degree, then the simulation run for more than 6000 ticks. One tick represents one process of trading.
Figure 3 below show how each agent connect each other. The link between each node represents how far each agent located to other agent. The node represents the agent. The further the link between the agent, the higher the delivery cost between each agent. If one agent has negative balance sheet, they will be eliminated from the simulation, along the the creation of new agent (randomly) and their netwok (connection to other agent) randomly.
4.2. Simulation Mechanism
There are five submodels constructed in Agent-Based Simulation for Industrial Cluster. First is agent's business and economic model, consist of how the price determination, and profit and capital calculation. Second is agent's network model, which consists of how the network is build, decision to choose producer/ supplier). Third is agent's skill specialization model, where differentiate the basic skill for consumer agent, producer agent, and supplier agent. Fourth is product and production model consists of how to decide the quantity of needed material, how many products will be made, and production cost and selling price calculation. Last is trading mechanism among agents.
The numbers of agents (producers, consumers, and suppliers) are fixand each agents has their own needs and competencies. At the beginning of simulation, each agentare connected randomly, and only able to interact through these connections. Then, there will be production process and trading mechanism between agents (to fulfill their needs). For agents with negative balance sheet, they will be eliminated from the simulation, along with the creation of new agent (randomly). The simulation runs for several years with the monitored output are density of the industrial cluster and average wealth (of consumers, producers, and suppliers).
4.3. Decision Rule Mechanism
For consumer agent, at first they generate their current needs. Then they choose the producer. From all alternative producers, the consumer will sort producers that sell the cheapest product and cheapest shipping/ delivery cost. If the amount of finished products owned by certain producer with the cheapest price and cheapest shipping/ delivery cost equal or more than the amount of products needed by the consumer, then the consumer only buy the finished product from one producer. If the amount of finised product from certain producer with the cheapest price and cheapest shipping/ delivery cost less than the amount of product needed by the consumer, then the consumer will buy the rest of they need from the second-cheapest producers. Trading between consumer and producer happens after the consumer chose the producer.
For producer agent, after the agent generates their need, they choose suppliers from their connected network. The role for choosing the supplier similar with the consumer, which is choose the supplier with the cheapest price and cheapest shipping/ delivery cost. If the amount of raw material owned by the cheapest supplier equal or more than the producer need,then the producer will buy from one supplier. Otherwise the producer will buy the rest of they need from the second-cheapest supplier. The products made by producer are based on the amount of raw material the producer has. Then, the producer set the price for the product as a function of total production cost with 10% profit margin.
For supplier agent, they convert the external resourves into raw material. The cost for this process is assumed constant (fix). Then, the supplier set the price for raw material as a function of total production cost with 10% profit margin.
Figure 4a below show the average-agent wealth because of the trading. On the long term, the average wealth for agents will increase.
Figure 4b below show the density of agents in certain area formed cluster industry. The denser of one cluster industry is the higher average wealth of agent in the cluster industry.
Figure 3.Interface of Agent Connection
Johnson, R. B., and Onwuegbuzie, A. J. (2004). Mixed Methods Research: A Research Paradigm Whose Time Has Come. Educational Researcher, 33 (7), 14–26.
Kumar, S. (2007). Development of Industrial Cluster, Munich Personal RePEc Archive (MPRA), November .
Macy, M. W., and Willer, R. (2002). From Factors to Actors: Computational Sociology and Agent-based Modeling. Annual Review of Sociology , 143-166.
th
Marshall, A. (1920). Principles of Economics, 8 Edition, London: MacMillan, .
Nadvi, Khalid., and Schmitz, Hubert. (1994). Industrial Cluster in Less Developed Countries : review of experiences and research agenda. University of Sussex, Institute of Development Studies Nadvi. (1999). Collective Efficiency and Collective Failure: The Response of the Sialkot Surgical
Instrument Cluster to Global Quality Pressure-World Development 9.
Vargo, S.L., Lusch, R.F., and Akaka, M.A. (2010). Advancing Service Science with Service Dominant Logic, Handbook of Service Science,133-156.
Pandit, N.R., Cook, G.A.S., and Swann G.M.P. (2001). The Dynamics of Industrial Clustering in British Financial Services Industries. The Service Industries Journal 1 ( 4): 33-61.
Pandit, N.R., Cook, G.A.S., and Swann, G.M.P. (1984). A Comparison of Clustering Dynamics in the British Broadcasting and Financial Services Industries, International Journal of The Economics
nd of Business, 2001Piore, M., Sabel, C., The Second Industrial Divide, 2 Edition. Porter, M. (1990). The Comparative Advantage of Nations.
Saxenian, A. (1994). Regional Advantage: Culture and Competition in Silicon Valley and Route 128, Massachusetts, Harvard University Press.
Schmidt, A. (2005). “What is the truth of simulation?”Journal of Artificial Societies and Social Simulation 8 (4).
Smith, E. R., and Conrey, F. R. (2007). Agent-Based Modeling: A New Approach for Theory Building in Social Psychology. Personality and Social Psychology Review, 11 (87):87-104.
Zawawi, D. (2007). Quantitative Versus Qualitative Methods in Social Sciences: Bridging the Gap. Integration & Dissemination , 3-4.
The experiments show that for all agents' variation and eventhough at the beginning of simulation the amount of agent initiated randomly, at the end of simulation, the agent that agglomerate with other agent will survive and sustain.
6. Conclusion
The simulation can describe that industrial cluster is formed as bottom-up interaction between agent with interdependency decision making. The basic decision making role is choosing the business partner (either producer or supplier) such that the lower price of the product be obtained. In long term, if there are so many industry produce similar product, only the producer that agglomerate with other industry can survive. As a result of the agglomeration, the average wealth of each agent will increase.
Considering the interaction pattern of industrial cluster there are several policy can be implemented to stimulate the industrial cluster formation, such as join-showroom, create waste-water treatment plant for several industries, renovate the facilities (access) to the cluster industries.
Reference
Arrow, K.J. (1962). The Economic Implications of Learning by Doing, Review of Economic Studies, 29 :155-173.
Axelrod, R. (2005). Agent-Based Modeling as a Bridge Between Disciplines. In K.L. Judd, &L.Tesfatsion (Eds.), Handbook of Computational Economics 2 : Agent-Based Computational Economics. North Holland
Axtell, R.L. (2003). The New Coevolution of Information Science and Social Science : From Software Agents to Artificial Societies and Back or How More Computing Became Different Computing. Retrieved November 5, 2008, from
http://www.econ.iastate.edu/tesfatsi/comsoc.axtell.pdf
Carley, K.M. (1999). On Generating Hypotheses Using Computer Simulations.Proceedings of 1999 International Symposium on Command and Control Research and Technology. Vienna Epstein, J.M. (1999). Agent-Based Computational Models And Generative Social Science. Complexity,
4 (5), 41-60.
Evans, A.W. (1985). Urban Economics: An Introduction, Oxford: Basil Blackwell . Gilbert, Nigel. (2008). Agent-Based Models.Los Angeles : SAGE Publications.
Gilbert, N., and Terna, P. (2000). How to Build and Use Agent-based Models in Social Science. Retrieved M a r c h 3 , 2 0 0 8 , f r o m F a c o l t à d i E c o n o m i a T o r i n o : http://web.econ.unito.it/terna/deposito/gil_ter.pdf
Granovetter. (1985). Economic Action and Social Structure, The Problem of Embeddedness, The American Journal of Sociology 91 (3;Nov): 481-510.
Jacobs, J. (1969). The Economy of Cities, London: Penguin Books.
Jacobs, J. (1984). Cities and The Wealth of Nations: Principle of Economic Life, New York: Vintage. Jennings, N. R., Faratin, P., Johnson, M. J., Norman, T. J., O'Brien, P., and Wiegand, M. E. (1996).
Agent-Based Business Process Management. International Journal of Cooperative Information Systems , 105-130.
Johnson, R. B., and Onwuegbuzie, A. J. (2004). Mixed Methods Research: A Research Paradigm Whose Time Has Come. Educational Researcher, 33 (7), 14–26.
Kumar, S. (2007). Development of Industrial Cluster, Munich Personal RePEc Archive (MPRA), November .
Macy, M. W., and Willer, R. (2002). From Factors to Actors: Computational Sociology and Agent-based Modeling. Annual Review of Sociology , 143-166.
th
Marshall, A. (1920). Principles of Economics, 8 Edition, London: MacMillan, .
Nadvi, Khalid., and Schmitz, Hubert. (1994). Industrial Cluster in Less Developed Countries : review of experiences and research agenda. University of Sussex, Institute of Development Studies Nadvi. (1999). Collective Efficiency and Collective Failure: The Response of the Sialkot Surgical
Instrument Cluster to Global Quality Pressure-World Development 9.
Vargo, S.L., Lusch, R.F., and Akaka, M.A. (2010). Advancing Service Science with Service Dominant
Logic, Handbook of Service Science,133-156.
Pandit, N.R., Cook, G.A.S., and Swann G.M.P. (2001). The Dynamics of Industrial Clustering in British Financial Services Industries. The Service Industries Journal 1 ( 4): 33-61.
Pandit, N.R., Cook, G.A.S., and Swann, G.M.P. (1984). A Comparison of Clustering Dynamics in the
British Broadcasting and Financial Services Industries, International Journal of The Economics
nd
of Business, 2001Piore, M., Sabel, C., The Second Industrial Divide, 2 Edition. Porter, M. (1990). The Comparative Advantage of Nations.
Saxenian, A. (1994). Regional Advantage: Culture and Competition in Silicon Valley and Route 128, Massachusetts, Harvard University Press.
Schmidt, A. (2005). “What is the truth of simulation?”Journal of Artificial Societies and Social Simulation 8 (4).
Smith, E. R., and Conrey, F. R. (2007). Agent-Based Modeling: A New Approach for Theory Building in Social Psychology. Personality and Social Psychology Review, 11 (87):87-104.
Zawawi, D. (2007). Quantitative Versus Qualitative Methods in Social Sciences: Bridging the Gap.
Integration & Dissemination , 3-4.
The experiments show that for all agents' variation and eventhough at the beginning of simulation the amount of agent initiated randomly, at the end of simulation, the agent that agglomerate with other agent will survive and sustain.
6. Conclusion
The simulation can describe that industrial cluster is formed as bottom-up interaction between agent with interdependency decision making. The basic decision making role is choosing the business partner (either producer or supplier) such that the lower price of the product be obtained. In long term, if there are so many industry produce similar product, only the producer that agglomerate with other industry can survive. As a result of the agglomeration, the average wealth of each agent will increase.
Considering the interaction pattern of industrial cluster there are several policy can be implemented to stimulate the industrial cluster formation, such as join-showroom, create waste-water treatment plant for several industries, renovate the facilities (access) to the cluster industries.
Reference
Arrow, K.J. (1962). The Economic Implications of Learning by Doing, Review of Economic Studies, 29 :155-173.
Axelrod, R. (2005). Agent-Based Modeling as a Bridge Between Disciplines. In K.L. Judd, &L.Tesfatsion (Eds.), Handbook of Computational Economics 2 : Agent-Based Computational Economics.
North Holland
Axtell, R.L. (2003). The New Coevolution of Information Science and Social Science : From Software Agents to Artificial Societies and Back or How More Computing Became Different Computing.
Retrieved November 5, 2008, from
http://www.econ.iastate.edu/tesfatsi/comsoc.axtell.pdf
Carley, K.M. (1999). On Generating Hypotheses Using Computer Simulations.Proceedings of 1999
International Symposium on Command and Control Research and Technology. Vienna
Epstein, J.M. (1999). Agent-Based Computational Models And Generative Social Science. Complexity,
4 (5), 41-60.
Evans, A.W. (1985). Urban Economics: An Introduction, Oxford: Basil Blackwell . Gilbert, Nigel. (2008). Agent-Based Models.Los Angeles : SAGE Publications.
Gilbert, N., and Terna, P. (2000). How to Build and Use Agent-based Models in Social Science. Retrieved M a r c h 3 , 2 0 0 8 , f r o m F a c o l t à d i E c o n o m i a T o r i n o : http://web.econ.unito.it/terna/deposito/gil_ter.pdf
Granovetter. (1985). Economic Action and Social Structure, The Problem of Embeddedness, The American Journal of Sociology 91 (3;Nov): 481-510.
Jacobs, J. (1969). The Economy of Cities, London: Penguin Books.
Jacobs, J. (1984). Cities and The Wealth of Nations: Principle of Economic Life, New York: Vintage. Jennings, N. R., Faratin, P., Johnson, M. J., Norman, T. J., O'Brien, P., and Wiegand, M. E. (1996).
Agent-Based Business Process Management. International Journal of Cooperative
Information Systems , 105-130.
Johnson, B., and Christensen, L. (2007). Educational Research Quatitative, Qualitative and Mixed