Research of Model Scale Seawater Intrusion
using Geoelectric Method
Supriyadi, Agus Yulianto, and Andi Haryanto1
Abstract—A depth experience and knowledge are needed in analyzing the prediction of seawater intrusion. We report here a physical modelling for monitoring the model scale of seawater intrusion. The model used in this research is glass basin consists of two parts; soil and seawater. The intrusion of seawater into soil in the glass basin is modelled. The results of 2-D inversion by using software Res2DInv32 showed that the monitoring of seawater intrusion, in soil model scale, can be detected by using Schlumberger configuration resistivity method. The watering process of freshwater into soil caused the electric resistivity value decreased. This phenomenon can be seen from the transition of the resistivity pseudo section before and after the watering process using different cummulative volume of freshwater in different soil. After being intruded by the seawater, the measured soil resistivity is 2.22 Ωm –5.69 Ωm which means that the soil had been intruded.
Keywords—geoelectrical method, seawater intrusion
Abstrak—Pendugaan intrusi air laut di lapangan memerlukan pengalaman dan pengetahuan dalam menganalisis, sehingga dalam penelitian ini dilakukan suatu pemodelan fisik untuk monitoring intrusi air laut skala model. Model yang digunakan adalah bak kaca yang memiliki dua bagian, bagian pertama berisi medium tanah dan bagian kedua berisi air laut. Pada bak kaca tersebut dimodelkan intrusi air laut ke dalam tanah. Hasil inversi 2-D menggunakan software Res2DInv32 menunjukkan bahwa monitoring intrusi air laut dalam medium tanah skala model dapat dideteksi menggunakan metode resistivitas konfigurasi Schlumberger. Penyiraman air tawar ke dalam tanah menyebabkan nilai resistivitas listrik tanah menurun. Hal ini dapat dilihat dari perubahan penampang isoresisivitas sebelum dan sesudah penyiraman air dengan volume kumulatif air tawar dalam tanah yang berbeda. Saat diintrusikan air laut, resistivitas tanah yang terukur adalah 2,22 Ωm – 5,69 Ωm yang berarti bahwa lapisan tanah telah mengalami intrusi.
Kata Kunci—metode geolistrik, intrusi air laut
I.INTRODUCTION3
roundwater is a renewable natural resource that has important role towards living. The higher the population growth, the higher the exploitation of groundwater. The high number of groundwater exploitation caused the imbalance condition between the exploitation and the groundwater formation. This condition can decrease the groundwater surface level [1]. In coastal areas, the decreasing of groundwater surface level will cause intrusion of seawater to the land because groundwater pressure is lower than seawater pressure.
As a result, in dry season an area suffers from drought and in rainy season it suffers from flood. A problem which may occur in this condition is whether the stored water is still in the reservoir we want or have been moved to another place. The migration of seawater is a problem which interferes with the provision of drinking water supplies [2].
The seawater intrusion causes a huge damage in environment, health and economics. Therefore, the monitoring of seawater intrusion is needed in order to decrease the negative impacts of seawater intrusion for example water quality and corrosion in the building foundation.
On the other hand, in measuring and acquisitioning field data, experience and knowledge about the accurate configuration in analyzing the appearance of geological condition in the field is needed. The physical and of Physics, Universitas Negeri Semarang, Semarang, 50229, Indonesia. E-mail: [email protected]
Based on Law and Kelton, a model makes the predict and analysis of a problem in the field become easier[3].
In the previous research done by Juandi [4], it has been showed that geoelectrical method can be used for determining groundwater pollution. He succeeded in analyzing oil palm waste by applying geoelectrical method. Moreover, Ngadimin and Handayani [5] also performed a monitoring research on the seepage of physical modelling waste in laboratory. They had succeeded in predicting the spread of liquid contaminant in the soil which was associated with conductive fluid which showed the accumulation of seepage waste groundwater pollution enabling the rise of.
In addition, the geoelectrical method has been proven as the best method in detecting the groundwater quality and also as a method which is suitable for shallow exploration. Therefore, this method is extensively used in geophysics exploration such as determining the depth of basement rock, searching of groundwater aquifer, the geothermal exploration, etc.[6].
Most rocks are poor conductors and hence have very high resistivity. Commonly, rocks are porous with fluid (especially water) filling them. The characteristics of electrical conductivity of rock, are strongly influenced by water amount, salinity, and distribution in the rocks. Those rocks become electrical conductor where the conduction of electric current is carried by the electrolytic ions in the water.
The simplest approach, in the study of electricity indication in the earth, is by regarding the Earth as an isotropic homogenous medium. With this treatment, the electric field from point sources in the earth is considered to have spherical symmetry (Figure 1). The value of electric resistivity of a formation under surface can be determined by using Equation 1.
r isotropic homogenous medium, i is the electric current, ρ is resistivity of rock, and 3.14.
Th Earth’s surface which electrified (Figure 2) is a half spherical area, so the Equation 1 becomes,
r measurement of potential difference between point M and N from electric current source A and B on the surface. The difference is computed by
N
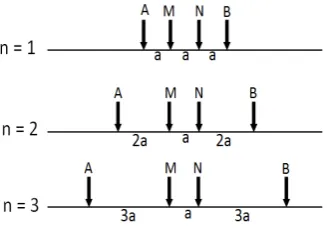
The electrode line sketch used in this research is drawn in Figure 4 and the resistivity values of some materials are shown in the Table 1.
The seawater intrusion is a phenomenon which happens a lot in coast aquifer. Generally, this phenomenon happens when the groundwater surface on freshwater aquifer is lower than the average sea surface causing seawater push the fresh water to land. If the groundwater surface is higher than the average sea surface, the freshwater will push it to the sea [9]. In analysing sea water intrusion in current place, it is better for the researchers to have a depth study about sea water measurement by conducting an early analysis in lab by using model scale. This model scale method is expected to give the researcher an experience on how to conduct sea water intrusion measurement and it is expected also could give the same result as field measurement.
II.METHOD
The instrument used in this study is a set of resistivity meter with electrodes. The research material was a glass vessel with a length of 150 cm, width 104 cm, 45 cm high, and filled with clay and seawater which was arranged as in the Figure 5.
The scale between the model and the condition in the field was 1 cm: 5 m. The geoelectric was activated, measuring the electric current and the potential difference at the dry soil early condition before being intruded by the seawater (settled up by covering the inlet of the seawater into the soil and covering the hole out of the freshwater).
The soil then being watered using freshwater with the cumulative volume of water in the soil is 150 liters, 300 liters, and so on. It was done continuously until the saturated water can not absorb the freshwater. Each dose of water which was sprinkled was measured using geoelectric method. Once, the water in the saturated
state, 100 liters of fresh water was removed by opening the fresh water vessel.
To intrude the soil to saturation condition, the inlet of the seawater into the soil was opened. When the procedure is completed, the electrical current and potential difference in the soil, which had been intruded by the seawater, can be measured. The measured data were then analyzed and interpreted using software Res2dinv [10].
III.RESULT AND DISCUSSION
1. Th land’s r sistivity ps udo s ction before being watered by the freshwater
The large porosity of the dry soil had caused the contact electrode injected into the medium could not flow properly. This was causing the resistivity meter G-Sound Portable could not work properly. The electrical current could not pass through the air cavities that filled the spaces between soil particle interfaces. Therefore, the wet soil medium was given over the dry soil medium in order to give a better electrode contacts so that the current was able to flow to the bottom of the dry soil medium.
Data processing that resistivity section inverse model of soil early before the fresh water watering is as shown in Figure 6 (Appendix). Soil resistivity measurement results were obtained by using geoelectric obtained value of the soil as about 79.4 Ωm – 93.87 Ωm ith 18% resistivity from data computation result. Th r sistivity’s value range in pseudo section can bee seen in the right column and the materials is in the left.
2. The resistivity pseudo section of the soil with cummulative volume of the freshwater in the soil 150 liters.
Figure 7 (Appendix) showed the cross-sectional resistivity of the soil after being watered using 150 liters freshwater. The value of the soil resistivity measured as about 54.55 Ωm – 78.08 Ωm ith 19.6 % iteration error. It showed that the soil resistivity value had decreased from its initial.
3. The resistivity pseudo section of soil with cummulative volume of freshwater in the soil 300 liters
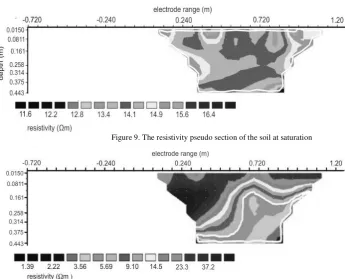
the soil. This third freshwater watering was done until the soil was saturated and could not absorb the freshwater anymore because the spaces between soil grains were filled with the freshwater. Figure 10 (Appendix) showed the value of soil resistivity in a saturat d stat as about 13.4 Ωm – 15.25 Ωm ith 8.4% iteration error. It means that soil resistivity value had decreased from the resistivity value on the first and second watering.
From Figure 6 to 9 (Appendix) it can be concluded that the watering process in the soil affects the decreasing of the soil resistivity value. The watering process by using freshwater on the dried soil, which made it became saturated, caused the resistivity value decreased. The more cummulative volume of the freshwater in the soil, the resistivity value would decrease further. This decreasing occurred because water is conductive and always filled the interface space of soil that previously filled with air. The research performed [2] for modeling application of Schlumberger geoelectric configuration method to investigate the groundwater existence indicated that the modeling can be used for that purpose with indicator obtained from water resistivity range between 0.5 m – 100 m the same as listed in the Table 1.This proves that the soil is electrolytic where the conduction of electric current carried by the electrolytic ions in the water. The soil resistivity values after watering were shown in the Table 2.
5. Soil resistivity pseudo section that intruded by seawater
In Figure 10 (Appendix) the moves of seawater seepage is tent from the centre-right side to the bottom left. This tendency happened as the effect of the soil density different caused by the location of the water inlet which is located in the bottom left and right centre of the constrictor glass (Figure 5), so that the seawater filled all the spaces around the water discharge hole.
The soil resistivity of the seawater intrusion was approximately 2.22 Ωm - 5.69 Ωm. This r sistivity valu was different from that in Table 1. The resistivity value in the Table 1 is the resistivity value of pure seawater whereas in this study the measured resistivity value is the value of resistivity of brackish water. This is because the seawater mixed with fresh water in the soil. The difference resistivity value obtained from the measurement process, with it’s valu in th Tabl 1, as caused by the electrodes arrangement. As explained by [2] which stated that big change of resistivity pattern occurred when the measurement electrodes arrangement
was near the water injection spot. In the contrary, the small change of resistivity pattern occured when the measurement electrodes arrangement was further away from the water injection spot. This reinforces the conclusión that the water existence affects the material resistivity.
IV.CONCLUSION
Based on lab-scale measurement, the soil resistivity value before the watering is equal to 79.4 Ωm – 93.87 Ωm. Th at ring by using fr sh at r into th soil caus the soil resistivity value decreases. The resistivity soil values after the watering respectively are 54.55 Ωm –
The results showed that the geoelectric Schlumberger configuration model can be used as substitute medium in the seawater intrusion measurement. The result of the study had proved that this method can measure the seawater intrusion as well as the directly measurement in the field. The research result performed by [11] about the mapping of sea water intrusion distribution by using geoelectric method showed that the soil intruded by sea water had variations resistivity type which tent to experienced a big difference where the lowest value which spread laterally centered, in the middle of this, suspected as the central of sea water in the soil with the value of resitivity distribution patterns ranging 0.0178 Ωm – 14.0 m. This result was difference from the measurement results because the soil layer used for modelling could not exactly the same as the soil layer in the field.
This model scale also can help a researcher to have an initial measurement before they go to the research field and make it easier to do. So that, without directly going to the field, the researchers are able to analyze the seawater intrusion by using the same kind of soil in the field.
ACKNOWLEDGMENT
Thanks to the Directorate General of Higher Education, Ministry of National Education, Republic of Indonesia in accordance with the letter of agreement implementation
research grant number of Hibah Bersaing
Figure 1. The current point A in isotropic homogenous medium,
current source B is considered to be at the point of infinity Figure 2. The source of single current A in homogenous half space medium. Current B is considered to be at the point of infinity
Figure 3. Th curr nt flo ’s patt rn and quipot ntial fi ld
between two current electrodes with opposite polarity Figure 4. The electrode line sketch for [7] Schlumberger configuration
Figure 5. The physical model of seawater intrusion on the scale model
APPENDIX
` Figure 6. The resistivity pseudo section of the soil before watering freshwater
Seawater The homogenous layer made of clay Hole out of
freshwater
Constrictor glass
Figure 7. The resistivity pseudo section of the soil with cummulative volume of freshwater in the soil of 150 liters
Figure 8. The resistivity pseudo section of the soil with cummulative volume of freshwater in the soil of 300 liters
Figure 9. The resistivity pseudo section of the soil at saturation
TABLE 1.
THE RESISTIVITY VALUES OF SOME GEOLOGICAL MATERIALS [8]
TABLE 2.
SOIL RESISTIVITY AFTER WATERING FRESHWATER
REFERENCES
[1] Fahrudin, “Penentuan zona campuran akibat intrusi air laut dengan pendekatan kimia,” Jurnal Teknik, vol. 17, no. 2, pp.117-125, 2006.
[2] T. Zubaidah dan B. Kanata, “Pemodelan fisika aplikasi metode geolistrik konfigurasi schlumberger untuk investigasi keberadaan air tanah,”Teknologi Elektro, vol. 7, no. 1, pp. 20-24, 2008. [3] A. M. Law and W. D. Kelton, Simulation Modeling and Analysis
3rd, Mc Graw Hill Pers, USA, 1991.
[4] M. Juandi, “Aplikasi metode geolistrik dalam menganalisis distribusi limbah kelapa sawit,”Jurnal Natur Indonesia, vol. 5, no. 2, pp. 119–123, 2003.
[5] Ngadimin dan G. Handayani, “Aplikasi metode geolistrik untuk alat monitoring rembesan limbah (penelitian model fisik di laboratorium),”JMS, vol. 6, no. 1, pp. 43–53, 2001.
[6] W. K. Kosinki and W. E. Kelly, “Geoelectric soundings for predicting aquifer properties,”Journal Groundwater, vol. 19, no. 2, pp. 163-171, 1981.
[7] Geotomo Software, “Manual software Res2DInv ver. 3.54. Geoelectrical Imaging 2D and 3D, Geotomo Software”, Penang, 2004.
[8] W. M. Telford, Applied Geophysics 2nd ed, Cambridge University,
1990.
[9] Supriyadi, “Pendugaan kandungan air tanah dan air asin dengan geolistrik”,Majalah Lonawarta, vol. 15, no. 1, pp. 51-67, 1991. [10] M. H. Loke, “Electrical imaging surueys for environmental and
engineering studies, a practical guide to 2-D and 3-D Surueys: Manual of RES2DINV and RES3DINV softwares”, 2000. [11] A. Wahab, Pemetaan distribusi intrusi air laut dengan
menggunakan metode geolisrtik, 2008. [Online]. Available : http: //library.um.ac.id/freecontents/index.php/detail/
Materials Resistivity (
m
)Air (in earth) ~
Quartz 4 x10¹⁰
Calcite 5.5 x10¹³
Rock salt 102 s/d 105
Granite 5x10³ s/d 5x10⁷
Limestone 60 s/d 3x10³
Sandstone 1s/d 103
Stone flakes 20 s/d 2x10³
Clay and soil 1 s/d 104
Distilled water 2x10⁵
Water surface 30s/d 3x10³
Groundwater 40 s/d 6x10²
Seawater 0.21
Dry soil resistivity before
wat ring (Ωm)
Cummulative volume of water (liters)
Soil resistivity after watering (Ωm)
79.40 – 93.87
150 54.55 – 78.08
300 31.6 – 37.8