A Servqual Measurement of Public Service from Motor Vehicle
Taxation Office (SAMSAT) In Indonesia
Dayal Gustopo Setiajit 1, Ady Utomo 2
1. Department of Industrial Engineering, Faculty of Industrial Technology, Institut Teknologi Nasional, Malang 65145, Indonesia.Tel: 0341-551431 (Hunting)
2. Language Laboratorium of Institut Teknologi Nasional, Malang, 65145, Indonesia. * E-mail of the corresponding author : [email protected]
Abstract
The purpose of this research is implementing Service Quality instruments while at the same time obtaining a description of public service given by Motor Vehicle Taxation office (similar to Department of Motor Vehicle/DMV) in Indonesia. This research is using expectation and perception data which put into SERVQUAL instruments that derived from A.Pasuraman as a tool to measure service quality (Service Quality Score). This is a survey research with random sampling technique. There were 400 taxpayers selected as samples of the research. Validity and Reliability Test was conducted to the instruments before the researchers do perceived service quality measurement. The result of this research displayed that five dimensions applied in the SERVQUAL instruments were valid and reliable to be used as instruments to measure the working performance of services provided by SAMSAT office. Tangible and Assurances dimension are generating good service quality range whereas Reliability, Responsiveness and Empathy dimensions are generating problematic service quality range that fall below customer’s expectations.
Keywords : Expectations, Perceptions, Service Quality Score, Validity & Reliability
1. Introduction
The implementation of public service is one of its primary function from government as an act of real actualization of social contract who was given by society to its government. Related to this condition, government as the organization who has duty as implementer of public service to its society will always gives continous efforts to upgrade its working performance in many sectors, such as in business services, health services, education and also in tax payment sectors. Ilhaamie (2010) Suggest that service quality performance on governmental organization service quality is the major dimension in public sector as the output of an organization is public services.
A guidance of public services in Indonesia has been arranged in Ministrial Decree of Government Apparatus Reforms (Keputusan Menteri Pendayagunaan Aparatur Pemerintah/ KEPMENPAN) in Act. 63/ KEP/M.PAN/7/2003 about one single administrative system under one roof which briefly called as SAMSAT (Sistem Administrasi Manunggal di Bawah Satu Atap). This department is similar to DMV (Department of Motor Vehicle) office. SAMSAT is a public service organization that runs in tax payment division for any motor vehicles that was built by government as a synergy collaboration between three governmental organizations which are: Republic Indonesia’s Police Department (Kepolisian Republik Indonesia/ POLRI), Income Office Region Department (Dinas Pendapatan Daerah) and Life Insurance Department (PT. Jasa Raharja). The Indonesia government has put adequate men power and facilities to every SAMSAT office throughout Indonesia’s areas. Motor vehicle tax payers are the prime costumers of this office, which hereafter will be addressed as customers. Tax services can be divided in to two major components, technique quality and function quality. The description of technique quality is cost amount of tax based on manufacture date, cylinder content (CC) and type of motor vehicle which must be paid by the customers, while function quality is how does the deliverance of that service to the customers.
Arawati, Baker & Kandampully(2007) state that Profit is not the goal of public organizations since they are playing such different roles as becoming facilitators, giving fast response, and developing socio-economy. Service quality is determine by the customers, only them who can able to express whether the service delivery has a good or bad quality.
Figure 1 Flow Process Chart of Service given by SAMSAT
The payment scheme to pay taxes of consumer’s motor vehicle as stated in flowchart above can be explained as follow: 1) Taxpayer must prepare and submit three copies of necessary documents which has been prepared earlier to the SAMSAT officials. These documents are ID Card, Vehicle’s Registration Number (Surat Tanda Nomor Kendaraan/STNK), and Certificate of Ownership (Bukti Kepemilikan Kendaraan Bermotor/BPKB). 2) Then, these documents will be legalize by SAMSAT officials to be registered into the next process, 3) Doing the physical check on the motor vehicle. This physical check consists of two activities which are swiping the machine’s identity number and chassis’s identity number of that motor vehicle. 4) After the physical check on the motor vehicle is done, document files will be identified to calculate the tax fees that must be paid by the vehicle owner, 5) When the identification process is done, consumer will be called in to queue line to wait his or her turn to pay, and the last step is 6) Pay the tax fee according to the number that stated in the payment form. It will take 55 minutes on the average time for the customer to be served by SAMSAT officials to finish the payment process in SAMSAT office.
The objective of this research is to test five dimensions of Service Quality on public service sectors and at the same time to obtain the description or image of service delivery from SAMSAT office in Indonesia through customer’s perspective.
2. Review of The Related Literatures
Public service is one of many form of end product from service activities. The main characteristics of service product is a simultaneous activity of production and consumption that happens in the same time. What is happens during that interaction (moment of truth) will have a big influence to the quality of the service that felt by its customers. The role of customer is important, as it stated by Nagata et.al, (2004) only the customer/user can judge quality, but on what criteria he/she judge it, or which aspect he/she values has not been made clear. Zeithaml, Pasuraman, and Berry, (1990) also added similar opinion that ccustomerss talked about many things – their expectations, their priorities, their experiences. They told us about high quality and low quality. They talked about many different attributes, some dealing with the service itself; others dealing with the person delivering the service.
In relation to Public Service, Zamil (2011) explains that the government as a big organization has its customers; those customers are citizens, businesses and public. Government through it agencies, departments, and ministries provides information and services for each group of its customers, and as a result this performance can be judge fairly only by the customers.
Nor et al (2010) states that public sector organizations, which provide customer service is one of the important factors that gives significant contribution to build good reputation and credibility in the community. Public complaints of long queues, poor service and poor physical facilities are not adequate to affect the image and the quality level of public sector.
quality is the major dimension in public sector as the output of an organization is public services. However, performance measurement in the public sector s not easy. Many activities in the public sector precisely because of measurement problems; if everything was clear and every benefit so easily attributable, those activities are well known in the private sector since a long time ago (Low and Others, 2008 in Ahmad M.Zamil, 2011).
These argumentations are strengthened by statement of Farrel et al, (1991) in Smith et al,(2007) about there is a need for service quality models to enable management to identify high quality and to determine where problem exist, and it has been argued that attempts to improve quality management are being prevented because of the lack of instruments designed to measure quality.
By taking these reasons into consideration, it is clear that public service is a product of service business and this type of product will be best measured by SERVQUAL model.
SERVQUAL is a technique to measure service quality with 22 instruments for measuring customer’s expectations and perceptions along five quality dimensions: tangibles, reliability, responsiveness, assurance, and empathy (Zeithalm, Pasuraman, Berry, 1990).
While in conceptual definition, SERVQUAL is describing as “the extent of discrepancy between customers’expectations and their perceptions. (Zeithaml, Parasuraman, Berry 1990).
Cui, Lewis, and Park (2003) reinforced this opinion with statement of “in other words, the assessment of service quality is conceptualized as a gap between what the customer expects from a class of service providers and their evaluations of the performance of a particular service provider within that class. The development of the SERVQUAL scale by Pasuraman et al (1988) has provided an istrument for measuring functional service quality applicable across a broad range of services” .
The original SERVQUAL used an expectation score (the customer’s expected service level), a perception score (the customer’s agreement that something was provided), and the gap score (the difference between the customer’s expectation score and perception score for service).
SERVQUAL measurement has 22 items of statements to reflect and to gauge expectation and perception of service deliverance on a five points Likert scale then evaluate them based on gaps between expectation and perception scores.
The central idea in SERVQUAL model is the quality of service product is a function of differences between perception score and expectation score ( P – E ). To measure this service product quality, there are 5 instruments will be employed in this research which composed from several groups of service attribution. This service attribute will be categorize into several dimensions as follow (Parasuraman, 1998)
• Reliability, Ability to perform the promised service dependably and accurately. • Responsiveness, Willingness to help consumer and provide prompt service
• Assurance, Knowledge and courtesy of employees and their ability to convey trust and confidence
• Empathy, Caring, individualized attention the firm provides its consumer.
• Tangibles, Appearance of physical facilities, equipment, personnel, and communication materials.
This instrument has been used widely in many studies about service quality, whether profit oriented services or non profit services such as in banking sectors reported by Cui (2003) and Muyeed (2012), in university sectors as reported by Smith and Smith, (2007), and in hospital service sectors as reported by Lam (1997).
As a conclusion for this sub chapter, Nagata (2004: 53-65) stated that the working presuppositions is that the service is good if perceptions meet or exceed expectations and problematic if perceptions fall below expectations.
3. Research Methods
SERVQUAL uses a scale to rate service expectations and performance by asking customers a set of questions on attributes that reflect the five dimensions of quality. This model places emphasis on the views of customers in defining service quality. Just as Pasuraman et al (1988) stated that SERVQUAL has been designed to be “applicable across broad spectrum of services” and the format could be adapted to fit specific needs and that it would be most valuable when used to track service quality trends periodically. (Smith. G & Smith. A, 2007).
of consumers and 22 statement items to access expectation of consumers. This research also has a purpose to test validity of the SERVQUAL instruments and rely on the result summary of perceived service quality (SQ Score).
3.1 Population, Samples and Sampling
Population of this research is motor vehicle tax payers as the consumers from SAMSAT offices.
For measuring the consumers opinion or attitude about its service quality, the writer selected samples up to 400 respondents or motor vehicle taxpayers which was taken in the month of January to April 2016. The respondent criteria to be elected as sample of this research was taxpayers who have made tax payment for their motor vehicle in that related year.
Before data samples were collectively taking, the writer conducted a Pre Test Questionairre to 30 respondents. The result from this Pre Test then will be used to find the appropriate validity and reliability of SERVQUAL instruments for this research. The significance level is set to 95 % with probability / opportunity of different value from parameter as big as 5 % with 0.05 proportion or ρ = 0.05. This number has meaning where of 5 from 100 samples taken in this research, it will be out of range from the real value.
Database for this research is using primary data with target population of all respondents of motor vehicle taxpayers in 2016. Data of customer’s attitude will be gathered by using SERVQUAL instruments and application of 5 Points Likert’s Scale ( 5 points responses measurement, starting from Strongly Disagree = 1, Disagree = 2, Hesitate = 3, Agree = 4, and Strongly Agree= 5).
Data collection was gathered from January to April 2016 by spreading questionnaire sheets to all selected respondents. The questionnaire is filled with 22 variables related to the five dimensional structure in SERVQUAL. The approaching method of this research is using a “personal contact” strategy where all respondents are giving a detailed explanation about the purpose of this research, meaning of every instrument variables and direction to answer or giving their opinions about the related variables. Then, all respondents can begin to give their opinions on the statements in the questionnaire sheets by using 5 Points Likert’s Scale. These respondents are free to call the researcher anytime they want when they experience any troubles that relate to the questionnaire filling.
3.2 Data Analysis
For the next step, data will be analyze by applying validity and reliability tests to find out about consistency and accuracy of the measurement instruments that employed in this research. The researchers chose Alpha Cronbach coefficients as the technique analysis in this research. After that as the final step, the researcher will be conducting a Gap Measurement Process of the quality that have been accepted by motor vehicle taxpayers as the consumers of SAMSAT offices.
4. Result and Discussions
From 401 questionnaire sheets that have been distributed to all respondents (motor vehicle taxpayers), 400 sheets return to the researcher with fully complete data. The result of this research is reporting several findings: 4.1 Validity Test
Validity test is used to measure or testing the applied SERVQUAL instruments in this research. These tested variables are coming from five dimensions: a) tangible dimension, consists of four items: (1) has up to date equipment, (2) physical facilities are visually appealing, (3) employees are neat in appearance, and (4) materials are visually appealing), b) reliability dimension, consists of five items: (1) when promises to do something, it does so, (2) shows sincere interest to solve your problems, (3) performs the service right the first time, (4) provides services at the time it promises, and (5) keep accurate records), c) responsiveness dimension, consists of four items: (1) tells you when the service will be performed, (2) give prompt services, (3) always willing to help, (4) never too busy to respond to your requests), d) assurance dimension, consists of four items: 1) employees can be trusted, 2) feels safe in your interaction with employees, 3) consistently courteous, 4) has knowledge to answer your questions, and e) empathy dimension, consists of five items: (1) gives individual attention, (2) has operating hours convenient to you, (3) employees gives personal attention, (4) has your best interest at heart, and (5) employees understand your specific needs.
Table 1. Alpha Cronbach Score for Five Dimensions of SERVQUAL Measurement (n=400)
Source: Primary Data Tabulation, 2016.
Table 1 is showing result that indicates these five dimensional structures of SERVQUAL measurement producing Alpha Cronbach value higher than (>) 0,6, therefore every dimension that will be use as tool measurement in this research can be declared as valid and reliable.
4.2 SERVQUAL Score (Gap Measurement)
After its five dimensions were declared as valid and reliable, the writer conduct the third step; begin to start gap measurement by using SERVQUAL instruments. As stated above, gap score is the difference between the customer’s expectation score and perception score about the services. Gap score will determine the quality of service deliverance. It will be put in good category if the score meet the customer’s expectation (mean SQ score is ranging from 0.00 – 1.00 or positive score) and it will be put in problematic category if the score falls below customer’s expectation (mean SQ score is in minus score). The result of this measurement is displaying in table 2.
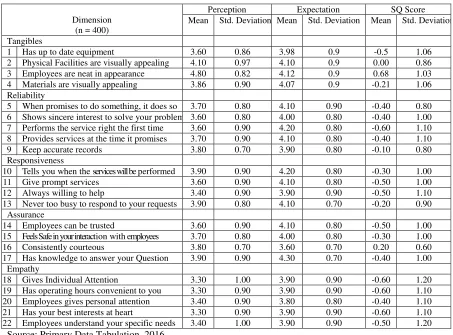
Table 2 Mean of Perceptions, Expectations and The SERVQUAL Scores
Dimension (n = 400)
Perception Expectation SQ Score Mean Std. Deviation Mean Std. Deviation Mean Std. Deviation
Tangibles
1 Has up to date equipment 3.60 0.86 3.98 0.9 -0.5 1.06 2 Physical Facilities are visually appealing 4.10 0.97 4.10 0.9 0.00 0.86 3 Employees are neat in appearance 4.80 0.82 4.12 0.9 0.68 1.03 4 Materials are visually appealing 3.86 0.90 4.07 0.9 -0.21 1.06 Reliability
5 When promises to do something, it does so 3.70 0.80 4.10 0.90 -0.40 0.80 6 Shows sincere interest to solve your problem 3.60 0.80 4.00 0.80 -0.40 1.00 7 Performs the service right the first time 3.60 0.90 4.20 0.80 -0.60 1.10 8 Provides services at the time it promises 3.70 0.90 4.10 0.80 -0.40 1.10 9 Keep accurate records 3.80 0.70 3.90 0.80 -0.10 0.80 Responsiveness
10 Tells you when the services will be performed 3.90 0.90 4.20 0.80 -0.30 1.00 11 Give prompt services 3.60 0.90 4.10 0.80 -0.50 1.00 12 Always willing to help 3.40 0.90 3.90 0.90 -0.50 1.10 13 Never too busy to respond to your requests 3.90 0.80 4.10 0.70 -0.20 0.90
Assurance
14 Employees can be trusted 3.60 0.90 4.10 0.80 -0.50 1.00 15 Feels Safe in your interaction with employees 3.70 0.80 4.00 0.80 -0.30 1.00 16 Consistently courteous 3.80 0.70 3.60 0.70 0.20 0.60 17 Has knowledge to answer your Question 3.90 0.90 4.30 0.70 -0.40 1.00
Empathy
18 Gives Individual Attention 3.30 1.00 3.90 0.90 -0.60 1.20 19 Has operating hours convenient to you 3.30 0.90 3.90 0.90 -0.60 1.10 20 Employees gives personal attention 3.40 0.90 3.80 0.80 -0.40 1.10 21 Has your best interests at heart 3.30 0.90 3.90 0.90 -0.60 1.10 22 Employees understand your specific needs 3.40 1.00 3.90 0.90 -0.50 1.20
Source: Primary Data Tabulation, 2016
Five Dimensions of SERVQUAL Measurement
Number of Items Cronbach alpha
Tangible 4 0,687
Reliablity 5 0,771
Responsivenes 4 0,776
Assurance 4 0,800
Descriptive statistics for the items in the SERVQUAL scale is presenting in the table 2. According to the table the result from tabulation data can be explains as follows:
In Tangible dimensions, the gap score for variable 1 is – 0,5, variable 2 is 0,00, variable 3 is 0.68 and variable 4 is -0,21. From the result of tangible dimensions, the SERVQUAL score is consider to be good (meet the customer’s expectation).
In Reliability dimension, the gap score for variable 5 is -0,40, variable 6 is -0.40, variable 7 is -0.60, variable 8 is -0.40, and variable 9 is -0.10 From the result of reliability dimensions, the SERVQUAL score is consider to be problematic (fall below customer’s expectation)
In Responsiveness dimension, the gap score for variable 10 is -0.30, variable 11 is -0.50, variable 12 is -0.50 and variable 13 is -0.20. From the result of reliability dimensions, the SERVQUAL score is consider to be problematic (fall below customer’s expectation).
In Assurance dimension, the gap score for variable 14 is -0.50, variable 15 is -0.30, variable 16 is 0.20 and variable 17 is –0.40. From the result of reliability dimensions, the SERVQUAL score is consider to be good (meet the customer’s expectation).
In Empathy dimension, the gap score for variable 18 is -0.60, variable 19 is -0.60, variable 20 is -0.40, variable 21 is -0.60 and variable 22 is -0.50. From the result of reliability dimensions, the SERVQUAL score is consider to be problematic (fall below customer’s expectation)
In summary, for service deliverance to customers, the highest mean score of Perception is located in variable number 3 (employees are neat in appearance) from tangible dimension with value of 4.80, then followed by variable number 2 (physical facilities are visually appealing) with value of 4.10 and the last one is coming from assurance dimension in variable number 16 (consistently courteous) with value of 0.20, meanwhile the lowest mean score of Perception is located in variables number 18 (Gives Individual Attention) with value of 3.30, variable number 19 (Has operating hours convenient to you) with value of 3.30, and variable number 21 (Has your best interests at heart) from empathy dimension with value of 3.30.
From SERVQUAL score point of view, it can be concluded that tangible and assurance dimensions have a good service deliverance to the customers (motor vehicle taxpayers) while reliability, responsiveness and empathy dimensions are having a problematic service deliverance to the customers (motor vehicle taxpayers).
4.3 Discussions
From the score result of SERVQUAL measurement of Tangible dimension, variables that related to appearance of physical facilities, equipment, personnel, and communication materials are generating good score in its service quality.
In Assurance dimension, variables that related to kknowledge and courtesy of employees and their ability to convey trust and confidence are generating good score in its service quality.
However, in Reliability dimension, variables that related to ability to perform the promised service dependably and accurately are generating unfavorable score in its service quality, thus it is not able to meet the customer’s expectation.
In Responsiveness dimension, variables that related to willingness to help customer and provide prompt service are generating unfavorable score in its service quality, thus it is not able to meet the customer’s expectation.
In Empathy dimension, variables that related to caring, individualized attention the firm provides for its customer are generating unfavorable score in its service quality, thus it is not able to meet the customer’s expectation.
The three dimensions that have problematique result is align with the result from Flow Process Chart (Figure 1) in the aspect of time spent for service deliverance process. This time spend for paying the motor vehicle tax is assumed to influence these dimensions until they failed to meet customer’s expectation.
From the explanation and discussion above, this research tells about the usage of SERVQUAL instruments that able to get a depiction of managerial image from service delivery to customers. Therefore, it can answer the question of ‘How does my services accepted by my customer?, “What have we must do to fix our services in order to upgrade our credibility as civil/public servant?
4.4 Limitations and Further Questions
The result of this research is limited due to the nature of sample. Data was collected in random technique by inserting all motor vehicle taxpayers as the samples of this research, without distinguishing motor cycle taxpayers and four wheels/ car taxpayers, while experience from customers of motor cycle taxpayers may be different from car taxpayers.
Therefore, the researchers suggest to conduct further research that able to explore interwoven relationship between reliability, responsiveness, and empathy dimensions with service delivery for motor cycle tax payers and four wheels taxpayers.
5. Conclusion
SERVQUAL is instrument for gauge service quality based on customer’s perceptions and customer’s expectations by examining or measuring the SERVQUAL gap (perceived service quality). One of the advantage of this method is the instrument has been used widely in many studies about service deliverance. This research is held to obtain the image of public service along with its description from SAMSAT office in Indonesia. There are findings from tangible dimension in variables that related to appearance of physical facilities, equipment, personnel, and communication materials, and assurance dimension in variables related to knowledge and courtesy of employees and their ability to convey trust and confidence that able to generate a good score for their service quality. Finally, for upgrading the public service quality, we must focused on reliability, responsiveness, and empathy dimensions together with their construct item in the future research.
References:
Arawati, S.B., & Kandampully.J. (2007). An Exploratory Study of Service Quality In The Malaysian Public Service Sector. International Journal of Quality and Reliability Management. 24 (2), 177 – 190.
Cui, Chi, C. et al. (2003). Service Quality Measurement in The Banking Sector in South Korea. The International Business of Bank Marketing. 21 (4/5), 191-2001. http://dx.doi.org/10.1108/02652320310479187. Ilhaamie. (2008). Service Quality in Malaysian Public Organizations. International Journal of Electronic Business Management. 8 (5), 129-138.
Lam, Simon, S.K., (1997). SERVQUAL: A Tool For Measuring Patients’ Opinions of Hospital Service Quality in Hong Kong. Total Quality Management. 8 (4), 145-152.
Muyeed, Abdul, Md. (2012). Customer Perception on Service Quality in Retail Banking in Developing Countries–A Case Study. International Journal of Marketing Studies. 4 (1), 116-122.http://dx.doi.org/10.5539/ijms.v4n1p116.
Nagata H., et al. (2004). The Dimensions That Construct The Evaluation of Service Quality in Academic Libraries. Performance Measurement and Metrics. 5 (2) ,53–65. http://dx.doi.org/10.1108/14678040410546073.
Nor, M.N., Khalid, S.A., Razali, M.F.M., & Ramli, N.A (2010). Service Quality and Customer Satisfaction: The Public Sector Perspective.
Pasuraman, A., Zeithalm, V. And Berry, L.L (1988). SERVQUAL: A Multiple Item Scale for Measuring Customer Perceptions of Service Quality. Journal of Retailing. 64 (1), 12-40.
Smith, Gareth. et al. (2007). Evaluating Service Quality in Universities: A Service Department Perspective. Quality Assurance in Education. 15 (3), 334 – 351.http://dx.doi.org/10.1108/09684880710773200
Undang-Undang Nomor: 63/KEP/M/PAN/7/2003. General Guidelines of Public Service Implementation (Pedoman Umum Penyelenggaraan Pelayanan Publik ).
Zamil, Ahmad.M & Shammot, Marwan.M. (2011) Role of Measuring Customer Satisfaction Improving The Performance in The Public Sector Organization. Journal of Business Studies Quarterly. 2 (3), 32-41.