UNCORRECTED PR
OOF
1
Comparing a diffusion tensor and non-tensor approach to white matter
2
fi
ber tractography in chronic stroke
3
A.M. Auriat
a, M.R. Borich
b, N.J. Snow
a, K.P. Wadden
a, L.A. Boyd
a,*
4 a
Department of Physical Therapy, Faculty of Medicine, University of British Columbia, Vancouver, Canada
5 bDepartment of Rehabilitation Medicine, Division of Physical Therapy, Emory University School of Medicine, Atlanta, USA
a b s t r a c t
6
a r t i c l e
i n f o
7 Article history:
8 Received 5 November 2014
9 Received in revised form 21 February 2015 10 Accepted 11 March 2015
11 Available online xxxx
12 Keywords:
13 Diffusion weighted imaging 14 Constrained spherical deconvolution 15 Diffusion tensor imaging 16 Motor outcome 17 Stroke
18 Diffusion tensor imaging (DTI)-based tractography has been used to demonstrate functionally relevant
differ-19 ences in white matter pathway status after stroke. However, it is now known that the tensor model is insensitive
20 to the complexfiber architectures found in the vast majority of voxels in the human brain. The inability to resolve
21 intra-voxelfiber orientations may have important implications for the utility of standard DTI-based tract
recon-22 struction methods. Intra-voxelfiber orientations can now be identified using novel, tensor-free approaches.
23 Constrained spherical deconvolution (CSD) is one approach to characterize intra-voxel diffusion behavior. In
24 the current study, we performed DTI- and CSD-based tract reconstruction of the corticospinal tract (CST) and
cor-25 pus callosum (CC) to test the hypothesis that characterization of complexfiber orientations may improve the
ro-26 bustness offiber tract reconstruction and increase the sensitivity to identify functionally relevant white matter
27 abnormalities in individuals with chronic stroke. Diffusion weighted magnetic resonance imaging was performed
28 in 27 chronic post-stroke participants and 12 healthy controls. Transcallosal pathways and the CST bilaterally
29 were reconstructed using DTI- and CSD-based tractography. Mean fractional anisotropy (FA), apparent diffusion
30 coefficient (ADC), axial diffusivity (AD), and radial diffusivity (RD) were calculated across the tracts of interest.
31 The total number and volume of reconstructed tracts was also determined. Diffusion measures were compared
32 between groups (Stroke, Control) and methods (CSD, DTI). The relationship between post-stroke motor behavior
33 and diffusion measures was evaluated. Overall, CSD methods identified more tracts than the DTI-based approach
34 for both CC and CST pathways. Mean FA, ADC, and RD differed between DTI and CSD for CC-mediated tracts. In
35 these tracts, we discovered a difference in FA for the CC between stroke and healthy control groups using CSD
36 but not DTI. CSD identified ipsilesional CST pathways in 9 stroke participants who did not have tracts identified
37 with DTI. Additionally, CSD differentiated between stroke ipsilesional and healthy control non-dominant CST for
38 several measures (number of tracts, tract volume, FA, ADC, and RD) whereas DTI only detected group differences
39 for number of tracts. In the stroke group, motor behavior correlated with fewer diffusion metrics derived from the
40 DTI as compared to CSD-reconstructed ipsilesional CST and CC. CSD is superior to DTI-based tractography in
de-41 tecting differences in diffusion characteristics between the nondominant healthy control and ipsilesional CST.
42 CSD measures of microstructure tissue properties related to more motor outcomes than DTI measures did. Our
43 results suggest the potential utility and functional relevance of characterizing complexfiber organization using
44 tensor-free diffusion modeling approaches to investigate white matter pathways in the brain after stroke. 45 © 2015 Published by Elsevier Inc. This is an open access article under the CC BY-NC-ND license
46 (http://creativecommons.org/licenses/by-nc-nd/4.0/).
47 48
49 50
51
1. Introduction
52
Diffusion-weighted magnetic resonance imaging (DW-MRI) is
53a non-invasive imaging technique commonly used to evaluate the
mi-54
crostructural tissue properties of white matter
fi
ber pathways in the
55
human brain using tractography. DW-MRI has been extensively used
56
to relate changes in white matter microstructural properties
57
and motor function after stroke (
Jang, 2010
). Differences in
DW-58
MRI-based measures of corpus callosum (CC) (
Borich et al., 2012a
;
59
Lindenberg et al., 2012
) and corticospinal tract (CST) (
Borich et al.,
60
2014, 2012a
;
Lindenberg et al., 2010
;
Stinear et al., 2007
)
microstructur-61
al tissue properties are predictive of both motor function and motor
62
learning in individuals with chronic stroke (
Borich et al., 2014
;
63
Lindenberg et al., 2012
;
Stinear et al., 2007
). Indeed, recent work has
de-64
scribed DW-MRI-derived measures of white matter microstructural
65
properties as a more valid predictor of motor function than the
func-66
tional MRI (fMRI)-derived blood oxygen level dependent (BOLD) signal
NeuroImage: Clinical xxx (2015) xxx–xxx* Corresponding author at: University of British Columbia, 212-2177 Wesbrook Mall, Vancouver, British Columbia V6T 2B5, Canada. Tel.: +1 604 822 7392; fax: +1 604 822 1860.
E-mail address:[email protected](L.A. Boyd).
YNICL-00464; No. of pages: 11; 4C:
http://dx.doi.org/10.1016/j.nicl.2015.03.007
2213-1582/© 2015 Published by Elsevier Inc. This is an open access article under the CC BY-NC-ND license (http://creativecommons.org/licenses/by-nc-nd/4.0/).
Contents lists available at
ScienceDirect
NeuroImage: Clinical
UNCORRECTED PR
OOF
67in chronic stroke (
Qiu et al., 2011
). Moreover, DW-MRI has been touted
68
as a promising tool for rehabilitation planning and prognosis after
69
stroke (
Stinear et al., 2007
), and these data may predict capacity for
70
motor learning (
Borich et al., 2014
). Taken together, DW-MRI has
71
been established as both a useful and important non-invasive brain
im-72
aging technique; therefore, it is critical to ensure that DW-MRI provides
73
reproducible information that is both sensitive and speci
fi
c in order to
74
meaningfully inform future clinical decision-making.
75
At present, no
“gold standard”
DW-MRI-based approach for in vivo
76
fi
ber tractography exists (
Farquharson et al., 2013
;
Jones, 2008
;
77
Tournier et al., 2011
). The most widely-used approach to model white
78
matter diffusion anisotropy is currently diffusion tensor imaging (DTI)
79
(
Basser et al., 1994
). Brie
fl
y, DTI analysis provides voxelwise estimates
80
of
fi
ber orientation, by generating a single tensor model that can only
81
estimate a single three-dimensional orientation per voxel (
Basser
82
et al., 1994
;
Basser, 1995
;
Basser and Pierpaoli, 1996
). Therefore,
DTI-83
based
fi
ber tract reconstruction relies on a single tensor with single
84
principal orientation representing intra-voxel diffusion behavior
85
(
Basser, 1995
). As a result of the reliance on a single tensor, DTI is
insen-86
sitive to the presence of multiple
fi
bers within a single voxel (e.g., in the
87
case of crossing, kissing, merging, or branching
fi
bers) (
Basser et al.,
88
2000
). The result is a
fi
ber tract trajectory that may either not follow
89
its
“
true
”
anatomical course or be a non-real, spurious pathway
90
(
Tournier et al., 2011
), which may substantially affect the
interpre-91
tation of results. It is suggested that greater than 90% of white
92
matter voxels in the brain contain more than one population of
fi
bers
93
(
Jeurissen et al., 2013
). This issue becomes more complex in the case of
94
lesions and neural degeneration, where necrosis, edema, in
fl
ammation
95
or changes in extracellular matrices may in
fl
uence diffusion behavior
96
(
Pierpaoli et al., 2001
;
Tournier et al., 2011
). Accordingly, tensor-free
97
DW-MRI modeling techniques have been proposed to account for
com-98
plex intra-voxel
fi
ber architectures, several of which are more sensitive
99
than DTI to detecting multiple
fi
ber tract orientations in regions with
100
heterogeneous
fi
ber populations (
Farquharson et al., 2013
;
Tournier
101
et al., 2011
).
102
One novel method for tensor-free modeling of diffusion behavior is
103
constrained spherical deconvolution (CSD) (
Tournier et al., 2007
).
Brief-104
ly, the DW-MR signal is expressed as an estimate of the
fi
ber orientation
105
distribution (FOD) response function within each voxel (
Tournier et al.,
106
2007
) thus providing information regarding the orientations and
con-107
tributions of various
fi
ber populations to observed diffusion behavior.
108
The FOD does not loose any information by averaging to obtain a single
109
tensor, as DTI does. The FOD contains all the orientation information for
110
a single voxel allowing for multiple
fi
ber orientations to be identi
fi
ed
111
(
Tournier et al., 2012
). Unlike DTI, CSD is robust to the presence of
112
multiple
fi
ber populations and does not make assumptions regarding
113
uniform diffusion of water within a voxel (
Farquharson et al., 2013
;
114
Tournier et al., 2007
). The net result is a DW-MRI technique that is
115
more sensitive to multiple intra-voxel
fi
ber pathway trajectories
116
(
Tournier et al., 2011
).
117
While DTI and CSD have been directly compared in both healthy
118
human participants (
Besseling et al., 2012
;
Farquharson et al., 2013
)
119
and persons with Alzheimer
3
s disease (
Reijmer et al., 2012
), the two
ap-120
proaches have not been compared in persons with stroke. Although the
121
reproducibility of DTI has been established in a stroke population
122
(
Borich et al., 2012b
;
Danielian et al., 2010
), it is unknown how
DTI-123
based tractography compares to a CSD-based approach in the brain
124
after stroke. It is possible that the optimal tractography approach will
125
differ depending on the speci
fi
c
fi
ber tracts studied and whether or
126
not neuropathology is present. Given these uncertainties, it is important
127
to directly compare DW-MRI methods for tractography analysis
128
in patient populations, to investigate potential differences between
129
methods that may in
fl
uence data interpretation. In the present study
130
we compared DTI- and CSD-based DW-MRI approaches for
determinis-131
tic streamline tractography to reconstruct white matter
fi
ber tract
path-132
ways, CST and CC, which are important to stroke recovery (
Borich et al.,
133
2012a
;
Stinear et al., 2007
). We also conducted correlation analyses
be-134
tween diffusion measures and the level of physical impairment and
135
motor function in participants with chronic stroke. Our goals were:
136
1) to consider whether CSD and DTI-based tractography differ in the
137
ability to detect post-stroke differences in microstructural tissue
prop-138
erties of white matter tracts, and 2) to determine if the microstructural
139
tissue properties of
fi
ber tracts of interest are related to functional
out-140
comes after stroke using both analysis approaches. We hypothesize that
141
CSD will detect a greater number of
fi
bers because it is not restricted to
142
a single tensor in heterogeneous regions, which includes areas with
cross-143
ing
fi
bers; the increased detection of
fi
bers may result in enhanced
detec-144
tion of group differences and relationships with behavioral outcomes.
145
2. Methods
146
2.1. Participants
147
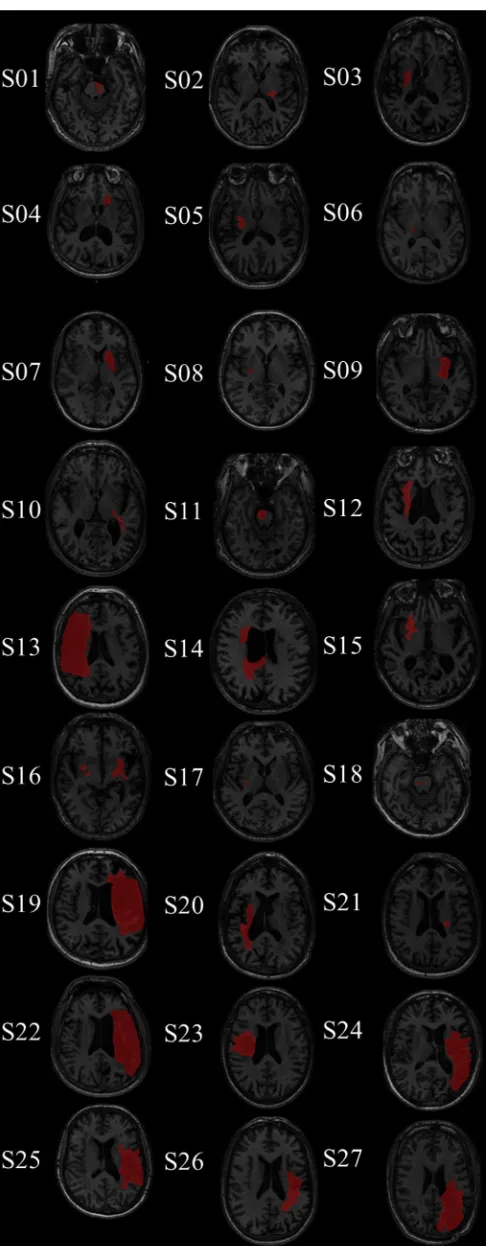
Twenty-seven individuals with chronic stroke (for demographics
148
see
Table 1
), and 12 right-handed controls (7 female, mean age 61.2 ±
149
SD 7.6 years) were recruited from the local community. We recruited a
150
heterogeneous stroke population, with no targeted site of lesion
151
(
Fig. 1
), and a diverse range of impairment (measured by the
Fugl-152
Meyer Upper Extremity Motor Assessment (
Fugl-Meyer et al., 1975
)).
153
The participants were part of an ongoing study assessing the effects of
in-154
tervention on long-term recovery after stroke. All imaging and
assess-155
ments in the current study were collected prior to the intervention.
156
Informed consent was obtained from each participant in accordance
157
with the Declaration of Helsinki. The University of British Columbia
158
(UBC) research ethics board approved all aspects of this study.
Partici-159
pants were excluded if they: 1) were outside the age range of 40
–
85;
160
2) were within 0–6 months post-stroke; 3) had a history of seizure/
161
epilepsy, head trauma, a major psychiatric diagnosis, neurodegenerative
t1 :1 Table 1
t1 :2 Demographic and behavioral characteristics of stroke participants.
t1 yr, years; mo, months; WMFT, Wolf motor functional test; UE-FM, upper extremity
UNCORRECTED PR
OOF
162
disorder, or substance abuse; 4) had aphasia (score
b
13 on the Frenchay
163
Aphasia Screen) (Enderby et al., 1987); or 5) reported any
contraindica-164
tions to MRI determined by screening by MR technologists.
165
2.2. Magnetic resonance imaging (MRI) acquisition
166
All MR imaging was completed at the UBC 3 T MRI Research Centre
167
with a Philips Achieva 3.0 T whole-body scanner (Philips Healthcare,
168
Andover, MD, USA), using an eight-channel sensitivity encoding head
169
coil (SENSE factor = 2.4) and parallel imaging. All participants received
170
a high-resolution three-dimensional T
1-weighted anatomical scan
171
(T
R= 7.47 ms, T
E= 3.65 ms,
fl
ip angle
θ
= 6°, FOV = 256 × 256 mm,
172
160 slices, 1 mm
3isotropic voxel). A high angular resolution diffusion
173
imaging (HARDI) scan was collected with a single shot echo-planar
im-174
aging (EPI) sequence (T
R= 7096 ms, T
E= 60 ms, FOV = 224 × 224 mm,
175
70 slices, voxel dimension = 2.2 × 2.2 × 2.2 mm). Diffusion weighting
176
was applied across 60 independent non-collinear orientations (b
=
177
700 s/mm
2) along with
fi
ve un-weighted images (b
= 0 s/mm
2).
178
2.3. Image processing
179
Diffusion data were processed using the MATLAB-based (Mathworks,
180
Natick, MA, USA) ExploreDTI software package (Leemans et al., 2009).
181
The DW images were corrected for subject motion and eddy
current-182
induced geometric distortions; signal intensity was modulated and
183
b-matrix was rotated during motion correction (Leemans and Jones,
184
2009). For DTI, the RESTORE approach was used for tensor estimation
185
(Chang et al., 2012). Because the degree of atrophy and lesion size in
186
several stroke participants may have resulted in signi
fi
cant distortions
187
if scans were transformed to standard space, all data were analyzed
188
in each participant
3
s native space. See
Fig. 2
for an overview of image
189
processing and tractography methods.
190
2.4. Tractography
191
Both standard CSD and DTI deterministic streamline tractography
192
were performed for all DW images using the ExploreDTI software
pack-193
age. With DTI the threshold for FA was set at 0.2. For both CSD and DTI
194
maximum turning angle was set at 30°, and the
fi
ber length range of
195
50
–
500 mm was selected (Reijmer et al., 2012). CSD-based
determinis-196
tic whole-brain
fi
ber tractography was initiated at each voxel using a
197Q4
seedpoint resolution of 2 mm
3, and 0.2 mm step size (Reijmer et al.,
198
2012). Tractography followed a
fi
ber alignment by continuous tracking
199
(FACT) algorithm approach (Mori et al., 1999).
200
2.4.1. Selection of ROIs
201
We selected two primary tracts previously shown to be important to
202
stroke recovery: 1) interhemispheric corpus callosum (CC) connections
203
(Lindenberg et al., 2012;
Mang et al., 2015), and 2) the corticospinal
204
tract (CST) (Borich et al., 2012a;
Stinear et al., 2007). ROIs were
205
delineated manually for all participants by a single experienced rater
206
(K.P.W.). To avoid errors due to the presence of lesions in the stroke
par-207
ticipants DW images, ROIs were drawn for each individual subject in
na-208
tive space; for consistency, identical processing steps were used for the
209
control group. The identical ROI masks were used for the both DTI and
210
CSD-based tractography approaches. FA color maps for each individual
211
were compared to a FA/white matter atlas (Oishi et al., 2011) to
manu-212
ally delineate corpus callosum and pontine ROIs on midsagittal and
213
axial planes, respectively. Transcallosal tracts were identi
fi
ed with a
sin-214
gle seed ROI placed in the midsagittal section of the CCs (Fig. 2, part 2).
215
The CST was independently assessed in each hemisphere with a SEED
216
ROI placed in the mid pons (Kwon et al., 2011) and an AND ROI placed
217
in the posterior limb of the internal capsule (PLIC) (Borich et al., 2012b).
218
These ROIs were selected based on previous work, in which we
con-219
ducted inter and intra rater reliability measurements, and found the
220
greatest speci
fi
city for the isolation of the CST (Borich et al., 2012b).
221
ROIs were manually delineated in the axial plane (Fig. 2, part 2). The
222
tracts were not con
fi
ned with any additional restrictions. Fiber tract
UNCORRECTED PR
OOF
223
reconstruction using the seed ROIs described was completed for both
224
the diffusion tensor and CSD with a deterministic streamline algorithm.
225
The diffusion-based measures of interest were fractional anisotropy
226
(FA), apparent diffusion coef
fi
cient (ADC), axial diffusivity (AD), radial
227
diffusivity (RD), number of tracts, and tract volume. ADC, AD, and
228
RD are all based on the eigenvalues of the apparent diffusion tensor
229
(
λ
1,
λ
2,
λ
3(
Basser, 1995
)). AD is an indicator of water diffusion along
230
the parallel, principal, direction of axonal water diffusion (AD =
λ
1231
(
Basser, 1995
)). RD is an index of water diffusion perpendicular to the
232
principal direction of water (RD =
λ
2+
λ
3/2 (
Basser, 1995
)). ADC is
233
the mean value of eigenvalues of the apparent diffusion tensor
234
(ADC =
λ
1+
λ
2+
λ
3/ 3 (
Basser, 1995
)). Mean values for FA, ADC,
235
AD and RD were calculated across all reconstructed
fi
bers for each
236
tract of interest.
237
2.5. Measures of motor outcome
238
Two licensed physical therapists conducted all functional
assess-239
ments (M.R.B., C.P.). The upper extremity motor portion of the
240
Fugl-Meyer assessment (FM) indexed physical impairment in the
241
hemiparetic arm (
Fugl-Meyer et al., 1975
). The FM scale contains
242
33 items scored from 0 to 2, with higher scores indicating less
im-243
pairment (range of total scores 0
–
66). This test is clinically used to
244
assess motor impairment in stroke rehabilitation (
van Wijck et al.,
245
2001
). Motor function in the hemiparetic upper extremity was
246
assessed using the Wolf Motor Function Test (WMFT;
Wolf et al.,
247
2001
). Movement time to complete each of the 15 items in the WMFT
248
with the hemiparetic and non-hemiparetic arms was assessed. The
249
time was used to calculate a projected mean rate per minute of task
per-250
formance. For each item on the WMFT the projected task rate was
calcu-251
lated as: Task rate = 60 s / performance time (s). If an individual could
252
not complete the task in 120 s, a mean rate of 0 was given for that task.
253
This method of calculating the WMFT is a valid and sensitive measure
254
of hemiparetic upper extremity motor function in individuals with
255
stroke (
Hodics et al., 2012
).
256
2.6. Statistical analysis
257
Results are displayed as mean ± SD. Diffusion measures for CC tracts
258
were compared using a two-way multivariate analysis of variance
259
(MANOVA), using Bonferroni correction for multiple comparisons,
260
with the independent factors Group (Control, Stroke) and Method
261
(CSD, DTI). For any signi
fi
cant interaction, additional analyses of
vari-262
ance (ANOVAs) and pairwise comparisons were conducted. For CST
263
analysis diffusion measures were compared in a three-way MANOVA,
264
with Group (Control, Stroke), Method (CSD, DTI) and Hemisphere
265
(Ipsilesional/Nondominant, Contralesional/Dominant) as independent
266
factors. When signi
fi
cant interactions were observed, additional ANOVAs
267
and pairwise comparisons were performed. An additional planned
268
comparison was made for each method (CSD and DTI) between the
269
ipsilesional stroke and non-dominant CST in healthy control for all the
270
diffusion measures (Bonferroni correction for multiple comparisons,
271
p
-value
≤
0.008 considered signi
fi
cant). To examine the relationship
272between CSD and DTI based diffusion measures, each measure was
com-273
pared across method with Bivariate Person correlations. Bivariate Pearson
274
correlation coef
fi
cients (
r
) were calculated between each measure of
275
motor behavior (WMFT rate and FM score) and the diffusion-based
276
measures of interest (FA, ADC, AD, RD, tract volume, tract number). For
277
all correlations (CSD vs. DTI and behavior vs. diffusion measures) the
cor-278
relations were considered signi
fi
cant by a
p
-value corrected for multiple
279
comparisons of
≤
0.008.
280
3. Results
281
3.1. CC tractography
282
The midsagittal CC ROI resulted in the identi
fi
cation of transcallosal
283
fi
ber tracts in all participants for both CSD and DTI (39/39). Sample CC
284
tracts for a subset of participants are shown in
Fig. 3
. MANOVA
identi-285
fi
ed signi
fi
cant main effects of Group (Control, Stroke;
p
b
0.001) and
286
Method (DTI, CSD;
p
b
0.001) and a signi
fi
cant Group × Method
UNCORRECTED PR
OOF
288
signi
fi
cantly more tracts in the midsagittal CC ROI (8817.74 ± 1580.72;
289
p
b
0.001) than the DTI method (3346.82 ± 1143.64). Tract volume
290
was also signi
fi
cantly greater with the CSD method (306,577.57 ±
291
46,750.36 mm
3;
p
b
0.001) than the DTI method (102,202.30 ±
292
25,521.26 mm
3). FA, ADC, and RD (p
≤
0.004) also differed signi
fi
cantly
293
between DTI and CSD (
Table 2
).
294
FA values from controls and stroke participants were signi
fi
cantly
295
different with CSD (p
b
0.001) but not with DTI (p
= 0.124;
Table 2
).
296Number of tracts, ADC, AD, and RD differed signi
fi
cantly between the
297
stroke and control groups using both methods (p
≤
0.0005). However,
298
tract volume differed between control and stroke groups with DTI
299
(p
≤
0.0005) but not CSD (p
= 0.057).
300
3.2. CST tractography
301
Fiber tract reconstruction using the CSD approach resulted in
suc-302
cessful tract reconstruction in 76/78 possible CST tracts across both
303
groups. DTI-based
fi
ber tractography resulted in the CST reconstruction
304
in 67/78 potential tracts. For both approaches unsuccessful
fi
ber tract
305
reconstruction occurred in the ipsilesional hemisphere of participants
306
in the stroke group. The CSTs identi
fi
ed in all stroke participants are
307
shown in
Fig. 4
. There was a signi
fi
cant effect of Group (Control, Stroke;
308
p
b
0.0005), Method (DTI, CSD;
p
b
0.0005), Hemisphere (Ipsilesional/
309
Non-dominant, Contralesional/Dominant;
p
b
0.0005), and signi
fi
cant
310
Group × Method (p
= 0.017) and Group × Hemisphere (p
= 0.002)
311
interaction effects. More tracts were identi
fi
ed with CSD (184.25 ±
312
160.22) than DTI (121.54 ± 80.45;
p
b
0.0005), and tract volume was
313
greater with CSD (12,868.03 ± 7865.26 mm
3;
p
b
0.0005) than DTI
314
(7226.11 ± 3093.87 mm
3). FA, ADC, AD and RD all differed between
315
the CSD and DTI (p
b
0.0005;
Table 3
).
316
A smaller number of tracts were generated for the stroke group
317
for both CSD (p
b
0.0005) and DTI (p
b
0.0005) methods. Mean
318
tract volume was signi
fi
cantly reduced in the stroke group as
com-319
pared to controls when using CSD (p
b
0.0005) and DTI (p
=
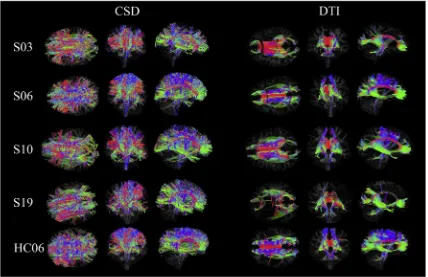
Fig. 3.Subset of stroke participants with axial, coronal and sagittal views of the tracts identified from the CC ROI with both CSD and DTI. The subset of participants was selected for their
variety in lesion location, right corona radiata (S03), bilateral diffusely appearing white matter (S06), left posterior corona radiata and pre-central gyrus (S10), and a large left middle cerebral artery infarct (S26).
t2
:1 Table 2
t2
:2 Diffusion-based measures for stroke and control participants in white matter tracts from the corpus callosum.
t2
:3 CSD-based tractography DTI-based tractography
t2
:4 Stroke (SD) Control (SD) Stroke (SD) Control (SD)
t2
:5 Mean FA 0.39* (0.03) 0.43* (0.01) 0.53 (0.02) 0.54 (0.02)
t2
:6 Mean ADC (E
−4
) (mm2
/s) 11.43* (0.83) 9.83* (0.17) 9.40# (0.45) 8.62# (0.16)
t2
:7 Mean AD (E
−4) (mm2/s) 16.25* (0.88) 14.69* (0.29) 15.65* (0.59) 14.52* (0.17)
t2
:8 Mean RD (E
−4
) (mm2
/s) 9.02* (0.84) 7.40* (0.13) 6.27@ (0.42) 5.67@ (0.19)
t2
:9 Number of tracts 8239.11* (1448.14) 10,119.67* (1002.06) 2796.44* (846.14) 4585.17* (639.94) t2
:10 Tract volume (mm 3
) 297,138.53 (49,030.57) 327,815.41 (34,019.55) 90,693.13* (20,763.37) 128,097.94* (13,205.43)
t2
:11 AD, axial diffusivity; ADC, apparent diffusion coefficient; FA, fractional anisotropy; RD, radial diffusivity. For significant differences between stroke and control groups. All measures were t2
:12 significantly different between CSD and DTI.
Q1
t2 :13
#
p= 0.005. t2
:14 *
pb0.0005. t2
:15 @
UNCORRECTED PR
OOF
320
0.044). Mean FA was signi
fi
cantly reduced in stroke as compared to
321HC with CSD (p
b
0.0005) and DTI (p
= 0.020). There are no group
322by method interactions for ADC (p
= 0.337), AD (p
= 0.755), or
323RD (p
= 0.240).
324
Total tract numbers differed between hemispheres in the stroke
325group (p
b
0.0005) but not in the controls (p
= 0.160). There were
326fewer tracts in the ipsilesional hemisphere of stroke participants than
327in the non-dominant hemisphere of controls (p
b
0.0005), but no
328
difference between contralesional hemisphere of the stroke participants
329
and the dominant hemisphere of the controls (p
= 0.081).
330
The planned comparison between the ipsilesional stroke CST and the
331
non-dominant CST of the healthy controls with CSD found signi
fi
cant
332
differences between all diffusion measures (p
≤
0.001) with the
excep-333
tion of AD (p
= 0.016) after correcting for multiple comparisons. Using
334
DTI, signi
fi
cant group differences were observed for only tract number
335
(p
b
0.0005).
UNCORRECTED PR
OOF
336
3.3. Functional measures
337
In the stroke group, there were no signi
fi
cant correlations between
338
diffusion measures (i.e., FA, ADC, AD, RD, tract number) for the
recon-339
structed CC tracts and FM score or WMFT rate using DTI (
Table 4
). FA
340
measures for CC tracts reconstructed with CSD positively correlated
341
with motor function (WMFT rate;
Fig. 5
). The DTI-based measures of
342
FA and RD in the ipsilesional CST correlated with motor impairment
343
(FM). However, there were signi
fi
cant correlations between several
dif-344
fusion measures (FA, ADC, and RD) of the ipsilesional CST
fi
bers
identi-345
fi
ed with CSD and both FM and Mean WMFT rate (
Table 5
,
Fig. 5
).
346
3.4. Correlation between methods
347
For colossal tracts each diffusion measure were strongly correlated
348
between methods (
p
≤
0.003). Correlation plots, Pearson
3
s correlation
349
values, and
p
-values are shown in Supplementary Fig. 1. Likewise, for
350
CST each diffusion measure was correlated between methods (
p
≤
351
0.001). Correlation plots, Pearson
3
s correlation values, and
p
-values are
352
shown in Supplementary Fig. 2.
353
4. Discussion
354
This study assessed DTI- and CSD-based tractography in persons
355
with chronic stroke and related each of these measures to motor
func-356
tion and impairment. CSD reconstructed ipsilesional CSTs for nine
357
stroke participants (33% of the total sample), who did not have identi
fi
-358
able tracts with DTI. Differences in microstructural tissue properties
359
(FA, ADC, RD, and tract volume) of CST white matter in chronic stroke
360
participants were identi
fi
ed with CSD but not DTI. Additionally, our
re-361
sults indicate that post-stroke paretic arm function and impairment
362
level are correlated with a greater number of CSD- than DTI-based
363
ipsilesional CST and CC diffusion measures.
364
Direct lesions to the CST and/or extreme cortical damage resulted in
365
the failure of CST detection for several stroke participants. Importantly
366
CSD reconstructed tracts in more individuals with a severely damaged
367
CST, which may offer new insights into the neuroanatomical substrates
368
of severe motor impairments after stroke. Additionally, the pattern of
369
cortical
fi
bers identi
fi
ed with CSD resembles known anatomy more
370
closely, where reconstructed
fi
bers are present in both the medial and
371
lateral regions of the primary motor cortex and underlying white matter
372
(
Ebeling and Reulen, 1992
). DTI-based tractography failed to
recon-373
struct
fi
bers projecting to the lateral aspect of the cortex (see
Figs. 3
374
and 4
), which is consistent with previous
fi
ndings (
Farquharson et al.,
375
2013
;
Jones, 2008
). A previous study in young, healthy individuals
376
also showed more robust results when reconstructing the CST with
377
CSD compared to DTI (
Farquharson et al., 2013
). Lateral projections of
378
the CST play a signi
fi
cant role in motor recovery after stroke (
Hallett
379
et al., 1998
), speci
fi
cally
fi
ne motor control of the hand (
Davidoff,
380
1990
). The detection of these lateral projections with CSD likely
contrib-381
uted to the signi
fi
cant correlation between diffusion measures and
382
motor function. If DW-MRI is to become a feasible tool for assessing
383
prognosis, functional potential, or rehabilitation strategies it is
impor-384
tant for this technique to be as sensitive and speci
fi
c to actual white
385
matter
fi
ber architecture as possible. Inability to detect an intact CST
386
or an under-estimation of the projection of
fi
ber populations may
under-387
mine patients
3
expected potential for recovery resulting in minimized
388
rehabilitation efforts. CSD may be a tool for optimizing tractography
strat-389
egies by identifying greater extent of
fi
ber projections in important
re-390
gions such as the CC and CST. However, it is dif
fi
cult to know if and to
391
what extent identi
fi
ed tracts may have been contaminated by non-CST
392
tracts. Although, given the strong relationship between motor outcome
393
and diffusion characteristics of the CST we are con
fi
dent that the majority
394
of the identi
fi
ed tracts were accurately identi
fi
ed.
t3
:1 Table 3 t3
:2 Diffusion-based measures of the CST for stroke and control participants.
t3
:3 CSD-based tractography DTI-based tractography
t3
:4 Stroke Control Stroke Control
t3
10.02# (1.09) 8.80 (0.55) 8.76# (0.66) 8.54 (0.44) 8.80 (0.91) 8.26 (0.38) 8.10 (0.17) 7.88 (0.13)
t3
14.61 (0.94) 13.92 (0.58) 13.83 (0.72) 13.72 (0.69) 14.16 (1.14) 13.82 (0.48) 13.46 (0.33) 13.39 (0.25)
t3
7.73# (1.23) 6.25 (0.58) 6.32# (0.61) 6.02 (0.49) 6.12 (0.84) 5.48 (0.36) 5.42 (0.19) 5.13 (0.16)
t3
:17 Number of t3
:18 tracts
86.80* (101.7) 183.48 (140.2) 366.17* (173.1) 250.75 (131.6) 68.87* (59.6) 122.19 (74.0) 160.92* (69.2) 156.42 (92.2)
t3
:19 Tract volume 8811.26* (6192.8) 13,093.75 (7998.2) 19,300.60* (6545.6) 16,046.07 (6379.0) 5450.7 (2955.0) 7474.78 (2951.0) 8626.20 (2760.8) 7984.53 (2764.1) t3
:20 Significance for comparison between ipsilesional and non-dominant hemispheres with each method. All measures were significantly different between methods:p≤0.015. t3
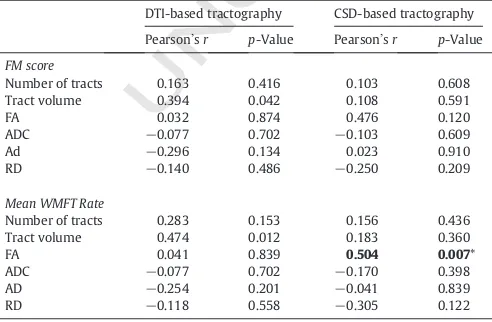
:2 Correlation of diffusion parameters of the CC and upper extremity motor behavior.
t4
:3 DTI-based tractography CSD-based tractography
t4
:4 Pearson3sr p-Value Pearson3sr p-Value
t4
:5 FM score t4
:6 Number of tracts 0.163 0.416 0.103 0.608
t4
:7 Tract volume 0.394 0.042 0.108 0.591
t4
:14 Number of tracts 0.283 0.153 0.156 0.436
t4
:15 Tract volume 0.474 0.012 0.183 0.360
t4
:20 AD, axial diffusivity; ADC, apparent diffusion coefficient; FA, fractional anisotropy; FM, t4
:21 Fugl-Meyer; RD, radial diffusivity; WMFT, Wolf motor function test. t4
:22 *
UNCORRECTED PR
OOF
Fig
.
5.
Corre
la
ti
o
n
b
e
tw
een
upper
ex
tremit
y
behavioural
b
ehav
iora
l
o
u
tcom
e
s
and
fractional
anisotropy.
*
signi
fi
ca
nt
corre
la
ti
o
n
,s
ee
Ta
bl
e
4
(CC)
an
d
Ta
bl
e
5
(CST
)
fo
r
sp
eci
fi
cP
e
ar
so
n
3
s
r
and
p
UNCORRECTED PR
OOF
395The differences identi
fi
ed between the diffusion measures for the
396
tracts identi
fi
ed with DTI and CSD support previous
fi
ndings (Reijmer
397
et al., 2012). However, direct comparison between the methods is
com-398
plicated by the fact that there is no lower FA bound for CSD but the
min-399
imum value for DTI is selected as part of the tractography protocol
400
(FA
N
0.2). CSD uses a tensor-free method, which relies on FOD, to
iden-401
tify tracts. It is only after tract identi
fi
cation that the tensor is used to
cal-402
culate the eigenvalues required to determine FA and the other diffusion
403
measures. While the differences in FA range impacts differences in
dif-404
fusion measures between methods several other factors potentially
405
contribute to the observed method differences. DTI can fail to identify
406
tracts in regions with crossing
fi
bers (Basser et al., 2000), resulting in
407
tract numbers and volumes that are signi
fi
cantly less than those
identi-408
fi
ed with CSD (Reijmer et al., 2012). Voxels from regions with crossing
409
fi
bers will have a lower FA values because the diffusion behavior in
410
these white matter regions is less uniform. Thus, CSD tractography
pro-411
ducing tracts with lower mean FA values may be due to the presence of
412
a greater number of
fi
ber populations with different architectural
char-413
acteristics, such as smaller axonal diameter (Tournier et al., 2011) or
414
smaller crossing angles (Tournier et al., 2008) as opposed to differences
415
in white matter microstructural tissue properties (Basser and Pierpaoli,
416
1996) or myelination (Song et al., 2002). Regardless of the
methodolog-417
ical differences between the identi
fi
cation of tracts and quanti
fi
cation of
418
the diffusion measures, CSD and DTI methods are strongly correlated
419
with each other. Which suggests that although the diffusion values
420
differ, both methods are measuring similar aspects of microstructural
421
tissue properties.
422
CSD was able to distinguish differences in callosal FA between
con-423
trol and stroke groups, whereas DTI failed to identify a signi
fi
cant
424
group difference. Previous work utilizing DTI-based tractography
de-425
tected lower callosal FA in persons with chronic stroke compared to
426
age-matched controls (Gupta et al., 2006). However, this study utilized
427
callosal segmentation, and found region-speci
fi
c reductions in callosal
428
FA (rostrum, genu, rostral body, anterior midbody, and splenium)
oc-429
curred in acute and sub-acute stroke with reductions increasing with
430
time since stroke (Gupta et al., 2006).
Borich et al. (2012a)
used a
431
cross-sectional ROI approach to examine FA differences in persons
432
with chronic stroke and controls and found that stroke participants
433
had reduced FA in the sensory sub-region of the CC compared to controls.
434
However, no work to date has examined diffusion behavior in
recon-435
structed transcallosal pathways across the entire callosum of individuals
436
with chronic stroke. It is possible that by basing tractography on the entire
437
CC, as opposed to following a parcellation scheme, we were not able to
438
detect a difference between stroke and control participants in callosal
439
FA when DTI was used. The ability of CSD to detect a greater proportion
440
of anatomically known transcallosal
fi
bers (i.e.,
fi
bers that extend out to
441
lateral cortex) likely contributed to enhanced ability to differentiate
442
stroke and control participants and to identify a relationship between
443
FA and motor function after stroke. To the best of our knowledge, our
cur-444
rent study is the
fi
rst to assess post-stroke FA in the entire CC using either
445
CSD or DTI-based tractography in stroke.
446
The ability of CSD and DTI to detect differences between health
con-447
trol and post stroke microstructural tissue properties is particularly
im-448
portant for stroke recovery research. Differences in mean FA of the
449
ipsilesional CST of stroke participants and the non-dominant CST of
450
the healthy controls were detected with CSD but not with DTI. It is
pos-451
sible that in participants with stroke, CSD was able to identify a greater
452
number of tracts with altered microstructural properties, which
con-453
tributed to the reduced FA values observed. CSD was also able to detect
454
tracts in several individuals who had no ipsilesional CST detected with
455
DTI; it is possible that these individuals had CSTs with lower FA relative
456
to the other participants, and these individuals could have driven the
457
detected differences between healthy control and stroke. The reduced
458
number of participants with tracts detected with DTI likely contributed
459
to the inability to detect a stroke/healthy control group difference,
460
which emphasizes the importance of selecting a tractography method
461
capable of detecting tracts in participants with a severely affected CST.
462
For transcallosal tracts, mean ADC, AD, and RD were all increased in
463
chronic stroke. The magnitude of difference between groups, although
464
still signi
fi
cant, was smaller with DTI. Speci
fi
c to the comparison of
465
ipsilesional (stroke) and non-dominant (healthy control) CST, CSD
466
again detected greater ADC, AD, and RD values in chronic stroke
partic-467
ipants; however, DTI failed to detect these differences. ADC represents
468
the overall magnitude of water diffusion (Basser and Pierpaoli, 1996),
469
and has been extensively studied in individuals with stroke (Schlaug
470
et al., 1997;
Schwamm et al., 1998;
Wang et al., 2006;
Yang et al.,
471
1999;
Yoshioka, 2008). Consistent with the present study, ADC in the
472
CST appears to be elevated above normal in the chronic stage of stroke
473
(Schlaug et al., 1997;
Schwamm et al., 1998), and has been related to
474
functional outcomes (Jang, 2010;
Schwamm et al., 1998). AD and RD
475
have been less frequently studied after stroke. Nonetheless, studies
476
using DTI-based tractography of the CST found acute post stroke AD to
477
be related to motor outcomes (Grässel et al., 2010;
Groisser et al.,
478
2014). Recently, one study found increased RD in several regions,
in-479
cluding the posterior CC, in acute stroke patients compared to controls;
480
however, increased AD occurred only in the corona radiata (Bozzali
481
et al., 2012). These results are consistent with work by Lindenberg
482
et al., who assessed persons with chronic stroke in comparison to
con-483
trols (Lindenberg et al., 2012). To the best of our knowledge, these
mea-484
sures (ADC, AD, RD) have not been assessed in stroke using CSD. Our
485
results suggest that ADC, AD, and RD are elevated in chronic stroke,
486
and CSD may prove to be more sensitive to these changes in diffusivity
487
than DTI; this observation is consistent with our
fi
ndings that
CSD-488
based FA was better able to differentiate stroke/healthy control groups,
489
relative to DTI.
490
CSD-based anisotropy (FA) and diffusivity (ADC, RD) in the CST
491
correlated with both motor function (WMFT Rate) and level of motor
492
impairment (FM score) in the paretic arm. Whereas, DTI based
anisotro-493
py (FA) and RD in the CST only correlated with the level of motor
im-494
pairment (FM score) in the paretic arm. The primary observation that
495
CSD and DTI-based anisotropy and diffusion measures of the CST
corre-496
late with motor function and impairment is in agreement with existing
497
DTI literature (Borich et al., 2012a;
Lindenberg et al., 2010;
Schaechter
498
et al., 2009). Several studies found correlations between DTI-based
499
tractography measures and post-stroke function. For instance Lindenberg
500
et al. found a correlation between
fi
ber number asymmetry (ipsi
−
501
contralesional/ipsi + contralesional) and motor outcome in chronic
502
stroke (Lindenberg et al., 2010). Cho et al. used DTI tractography to
503
classify CST integrity after corona radiata infarct (Cho et al., 2007a) and
504
intra-cerebral hemorrhage (Cho et al., 2007b), and found a relationship
505
between tract involvement and functional outcome. In the current
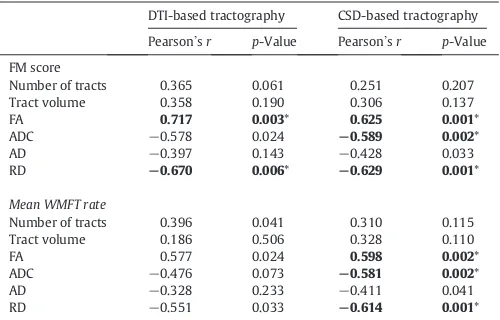
t5:1 Table 5 t5
:2 Correlation of diffusion parameters of the CST and upper extremity motor behavior.
t5
:3 DTI-based tractography CSD-based tractography
t5
:4 Pearson3sr p-Value Pearson3sr p-Value t5
:5 FM score t5
:6 Number of tracts 0.365 0.061 0.251 0.207 t5
:7 Tract volume 0.358 0.190 0.306 0.137
t5
:14 Number of tracts 0.396 0.041 0.310 0.115 t5
:15 Tract volume 0.186 0.506 0.328 0.110
t5
:20 AD, axial diffusivity; ADC, apparent diffusion coefficient; FA, fractional anisotropy; FM, t5
:21 Fugl-Meyer; RD, radial diffusivity; WMFT, Wolf motor function test. t5
:22 *
UNCORRECTED PR
OOF
506study both DTI and CSD-based tractography in chronic stroke
partic-507
ipants showed a relationship between ipsilesional CST
microstruc-508
tural tissue properties and motor outcomes where more normal
509
diffusion behavior was associated with less physical impairment.
510
However, CSD-based tractography also related to improved motor
511
function.
512
In the CCs, only CSD-derived mean FA values were related to motor
513
function. All DTI-derived measures failed to correlate with motor
func-514
tion or impairment. Previous reports on the relationship between CC
515
DW-MRI-related measures and behavioral outcomes utilized
segmenta-516
tion of the CC into regions of
fi
ber populations with distinct projections
517
or utilized an ROI or voxel-based approach instead of tractography
518
(
Bozzali et al., 2012
;
Lindenberg et al., 2012
;
Takenobu et al., 2014
).
Ad-519
ditionally, literature assessing the relationship between CC diffusion
mea-520
sures and motor behavior post-stroke utilized DTI-based tractography.
521
Nevertheless, FA measurements from CC tracts identi
fi
ed using CSD
cor-522
related with motor function in chronic stroke participants.
523
Several reasons may explain why DTI-derived measures of diffusion
524
metrics of the CST and CC tracts did not relate as well as CSD-derived
525
measures did to motor function or impairment in the current work.
526
DTI failed to reconstruct many of the tracts to lateral cortex that were
527
identi
fi
ed with CSD, this likely contributed to the lack of signi
fi
cant
cor-528
relations between DTI measures and motor function. Additionally,
pop-529
ulations with stroke tend to have heterogeneous characteristics such as,
530
varied time since stroke onset, wide-range of functional and cognitive
531
impairments, and differences in lesion size and location. Many of the
532
previous studies, which have identi
fi
ed a relationship between
DTI-533
based diffusion measures of the CST and functional outcomes, relied
534
on homogeneous stroke populations (
Cho et al., 2007a,b
). However, in
535
the current study we utilized a heterogeneous stroke population with
536
variable lesion location, time post-stroke, and level of upper extremity
537
impairment (
Fig. 1
,
Table 1
). In diverse groups of stroke patients,
espe-538
cially with greater levels of impairment represented, CSD may be
neces-539
sary to detect a suf
fi
cient number of tracts in order to demonstrate
540
relationships with behavior. These possibilities, should be evaluated
541
and accounted for in future work to mitigate some of the inherent
chal-542
lenges demonstrated in conducting and comparing research involving
543
DW-MRI in stroke, regardless of the tractography technique employed.
544
Our study has some limitations. Primarily, several methods exist for
545
tractography and the comparison of DWI measures. Alternative methods
546
such as probabilistic tractography, which samples many possible
fi
ber
547
paths, as compared to deterministic tractography, which samples one
548
possible
fi
ber path, may have yielded different results (
Jones, 2008
).
Fre-549
quently, diffusion measures are extracted from regions of interest, and are
550
expressed either independently (
Liang et al., 2007
) or as a ratio (
Puig
551
et al., 2010
;
Radlinska et al., 2010
) of lesioned to unlesioned hemispheres.
552
In contrast, tractography takes into consideration the diffusion measures
553
along the entire tract of interest, which may miss very localized changes
554
along a
fi
ber bundle. However, our
fi
ndings suggest that tractography
555
utilizing CSD can overcome the limited ability of DTI identi
fi
ed tracts
556
to correlate with function following stroke (
Borich et al., 2012b
). Our
557
method for tractography required drawing individual seed points for
558
tractography, which was more time consuming than automated voxel
559
based or atlas based analysis, but it is less susceptible to errors that can
560
occur when normalizing lesioned brains into a standard space. In the
cur-561
rent study we were particularly concerned with the ability to identify
562
tracts in individuals with chronic stroke, some of whom had extensive
563
lesion encroachment into regions of the CST and/or extensive cortical
564
involvement. These factors made it important to draw ROIs and perform
565
tractography in native space. An additional restriction to our tractography
566
methods, was our choice to retain spurious
fi
bers rather than trying to
567
create additional exclusion masks to omit these
fi
bers. Additional studies
568
will need to develop approaches that capture only
‘
real
’
pathways.
How-569
ever, we do not believe that the inclusion of these tracts adversely affected
570
our data as we were able to discover signi
fi
cant correlations between
dif-571
fusion measures and measures of functional outcome. Finally, our imaging
572
protocol utilized a b-value of 700 s/mm
2which is lower than the standard
573
1200 typically utilized for DWI analysis (
Jeurissen et al., 2013
). The lower
574
b-value reduced our scanning time but may have reduced the ability to
575
separate crossing-
fi
bers (
Jeurissen et al., 2013
); even with this limitation
576
CSD was still able to detect signi
fi
cant differences between stroke and
577
control participants which DTI failed to identify.
578
5. Conclusion
579
The current study compared CSD- and DTI-based
fi
ber tractography
580
techniques in persons with chronic stroke. Results showed that
fi
ber
581
tractography with CSD can be used to identify functionally-relevant
582
white matter tracts in the post-stroke brain, and can be considered in
583
future work. CSD-based tractography was able to detect CST
fi
bers in
584
nine more individuals with stroke compared to the DTI-based approach.
585
This may be critical when attempting to evaluate neuroanatomical
sub-586
strates for recovery from severe CST damage. CSD was better able to
587
distinguish differences in diffusion and anisotropy between
stroke-588
affected participants and controls. It appears that CSD is useful for
589
studying white matter microstructural properties after stroke. If
DW-590
MRI is to continue to be a valuable tool for assessing prognosis or
591
predicting potential for motor recovery after stroke, state-of-the-art
592
techniques for tract identi
fi
cation should be utilized.
593
Supplementary data to this article can be found online at
http://dx.
594
doi.org/10.1016/j.nicl.2015.03.007
.
595
Uncited references
596
No citations were found for the following references:
Kristo et al.
597
(2013)
;
Nagesh et al. (1998)
598
Acknowledgements
599
The Canadian Institutes of Health Research (CIHR) supported this
600
work (MOP-1066551 to LAB). LAB is a Canada Research Chair and
re-601
ceives support from the Michael Smith Foundation for Health Research
602
(MSFHR). AMA receives support from the CIHR
and MSFHR. The Natural
Q5 603Sciences and Engineering Research Council of Canada and MITACS
604
provided support to KPW. Courtney Pollock (CP), a certi
fi
ed physical
605
therapist, completed a portion of the functional assessments included
606
in this study.
607
References
608 Basser, P.J., 1995. Inferring microstructural features and the physiological state of tissues
609 from diffusion-weighted images. N.M.R. Biomed. 8 (7–8), 333–344.http://dx.doi.org/
610 10.1002/nbm.19400807078739270.
611 Basser, P.J., Mattiello, J., LeBihan, D., 1994. MR diffusion tensor spectroscopy and imaging.
612 Biophys. J. 66 (1), 259–267.
http://dx.doi.org/10.1016/S0006-3495(94)80775-613 18130344.
614 Basser, P.J., Pajevic, S., Pierpaoli, C., Duda, J., Aldroubi, A., 2000. In vivofiber tractography
615 using DT-MRI data. Magn. Reson. Med. 44 (4), 625–632.http://dx.doi.org/10.1002/
616
1522-2594(200010)44:4b625::AID-MRM17N3.0.CO;2-O11025519.
617 Basser, P.J., Pierpaoli, C., 1996. Microstructural and physiological features of tissues
eluci-618 dated by quantitative-diffusion-tensor MRI. J Magn Reson B 111 (3), 209–219.http://
619 dx.doi.org/10.1006/jmrb.1996.00868661285.
620 Besseling, R.M., Jansen, J.F., Overvliet, G.M., Vaessen, M.J., Braakman, H.M., Hofman, P.A.,
621 Aldenkamp, A.P., Backes, W.H., 2012. Tract specific reproducibility of tractography
622 based morphology and diffusion metrics. PLOS One 7 (4), e34125.http://dx.doi.org/
623 10.1371/journal.pone.003412522485157.
624 Borich, M.R., Brown, K.E., Boyd, L.A., 2014. Motor skill learning is associated with diffusion
625 characteristics of White matter in individuals with chronic stroke. J. Neurol. Phys.
626 Ther. 38 (3), 151–160.http://dx.doi.org/10.1097/NPT.0b013e3182a3d35323934017.
627 Borich, M.R., Mang, C., Boyd, L.A., 2012a. Both projection and commissural pathways are
628 disrupted in individuals with chronic stroke: investigating microstructural white
629 matter correlates of motor recovery. B.M.C. Neurosci. 13, 107.http://dx.doi.org/10.
630 1186/1471-2202-13-10722931454.
631 Borich, M.R., Wadden, K.P., Boyd, L.A., 2012b. Establishing the reproducibility of two
632 approaches to quantify white matter tract integrity in stroke. Neuroimage 59 (3),
633 2393–2400.http://dx.doi.org/10.1016/j.neuroimage.2011.09.00921945470.
634 Bozzali, M., Mastropasqua, C., Cercignani, M., Giulietti, G., Bonnì, S., Caltagirone, C., Koch,