Comparative Assessment of Electricity Supply Strategies in Indonesia
1Agus Sugiyono [email protected] Agus Cahyono Adi [email protected]
Agency for the Assessment and Application of Technology (BPPT), Indonesia
Abstract
The objective of the study is design an optimal strategies for the national electricity supply in Indonesia for the long term (1996-2021). The situation of the fossil energy reserves is characterized by limited oil reserves, sufficient gas reserves and abundant coal reserves. The GDP grows on average by 6 % per annum. The electricity demand grows by 8.2 % per annum from about 52 TWh in 1991 to 556 TWh in the year 2021. About 70 % is consumed in the industrial sector, which has an average growth rate in electricity consumption of 8.5 % annually. Abundant coal reserves make coal attractive as the major fuel for power plant in Indonesia under the BAU scenario. The ERC scenario carried out in this study showed that clean coal power plants, equipped with desulphurization, denox, and dust filter units, generate electricity at lower costs than LWR nuclear power plants. Coal is by far the most economic supply option even under the conditions of the ERC scenario. For the CRC scenario nuclear power plant would be necessary in 2006 with installed capacity 1.34 GW and grow to 6.72 GW by the year 2021.
1. Introduction
This study is part of the inter-agency joint project on data bases and methodologies for comparative assessment of different energy sources for electricity generation (DECADES). In case of Indonesia, known as Comparative Assessment of Electricity Supply Strategies in Indonesia, are being carried out within the Research Contract between IAEA and Agency for the Assessment and Application of Technology (BPPT), Indonesia.
The objective of the study is design an optimal strategies for the national electricity supply in Indonesia for the long term (1996-2021). Taking into account economic and environmental aspect, and to analyze the impacts of alternative strategies. In this study three scenario has been introduced to make strategies for electricity supply, i.e. :
- Business as Usual Case (BAU)
The BAU is a worst case scenario for estimating the environmental consequences if pollution control will not be implemented.
- Emission Reduction Case (ERC)
The emission reduction technologies for Suspended Particulate Matter (SPM), NOx and SO2 considered in the ERC scenario.
- CO2 Reduction Case (CRC)
1
In the CRC scenario, CO2 reduction target was applied for the year 2006 by 12.5 % and
the year 2021 by 25.0 % base on the ERC.
2. Economic and Energy Indicators
According to the 1990 census the population has reached 179.3 million, which is the third largest group in Asia after People's Republic of China and India. The population growth rate has declined from 2.2 % per annum in the early eighties to 1.8 % at present due to the success with the family planning program. Compared to other countries, and in particular to industrialized countries, this growth rate is considered very high. About 37 % of the population is in the under 15 age group. The creation of job opportunities is a tremendous challenge for the government.
In the 1970, the country experienced relatively high Gross Domestic Product (GDP) growth of around 7.8% per annum mainly due to the high oil prices in the international market. Average economic growth rate for the last 10 years is about 6 % per annum. In early 1983, a series of economic reforms were undertaken to develop and promote exports of agricultural, forestry, and manufacturing that aggregatedly designated as non oil and gas commodities. Strong international competition and the economic momentum of previous achievements prompt Indonesia to broaden industrial base.
The energy sector is one of the most importance sub-sectors in Indonesia because it has been a major source of technological development, to drive economic activity and also as an export commodity. It accounted for slightly over 20 % of GDP in 1990 and approximately 40 % of the export earnings.
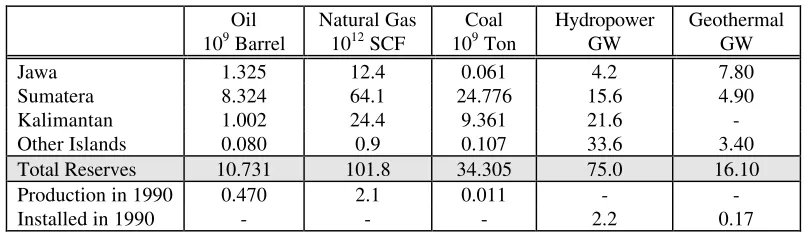
Table 2-1 summarizes the energy resource compared to utilization in 1990. The situation of the fossil energy reserves is characterized by limited oil reserves, sufficient gas reserves and abundant coal reserves. The Indonesia's oil reserves were estimated by Minister of Mine and Energy to be 10.731 billion barrels. Petroleum geologists believed that the not yet explored basins within the Indonesian archipelago contain resources of 30 to 40 billion barrels. The possible oil reserves may be located in remote areas or in the deep sea. High risk exploration and intensive capital investment may be necessary to prove at least part of these resources.
The proven and potential gas reserves are estimate at about 101.8*1012 scf. Unfortunately, the most of the reserves have a 70 % CO2 content that need large
investments to develop the field, to process the gas, and to dispose CO2 into the reservoir.
Table 2-1. Energy reserves compared to utilization in 1990 Oil
Jawa 1.325 12.4 0.061 4.2 7.80
Sumatera 8.324 64.1 24.776 15.6 4.90
Kalimantan 1.002 24.4 9.361 21.6
-Other Islands 0.080 0.9 0.107 33.6 3.40
Total Reserves 10.731 101.8 34.305 75.0 16.10
Production in 1990 0.470 2.1 0.011 -
The domestic primary energy supply in 1991 was accounted around 52 MTOE and was dominated by crude oil with 41 % and by biomass, as a traditional form of energy, which contributed 31 %. Natural gas supplied 18 % of the domestic energy consumption. The remainder was shared by coal (6 %) and hydropower together with geothermal energy (4 %) as shown in Fig. 2-3. The main consumption of biomass is in the rural and urban peripheral residential sector.
3. Electricity Generation Plan
The electricity demand in Indonesia is supplied by State Electricity Company (PLN) and captive power plants. The electricity generation increase from 19.3 TWh in 1980 to 47.7 TWh in 1989, or by 9.5 % per annual on average. The generation of captive power plants was higher than PLN’s generation up to 1986. This is mainly due to PLN’s lack of generation, transmission and distribution capacity. Another often cited reason, low domestic prices of diesel, is a consequence of this shortcoming. Faced with the dilemma that industries need electricity and that PLN cannot meet the industrial demand, the government of Indonesia set the diesel price at low level in order to enable industries to generate electricity at a competitive price.
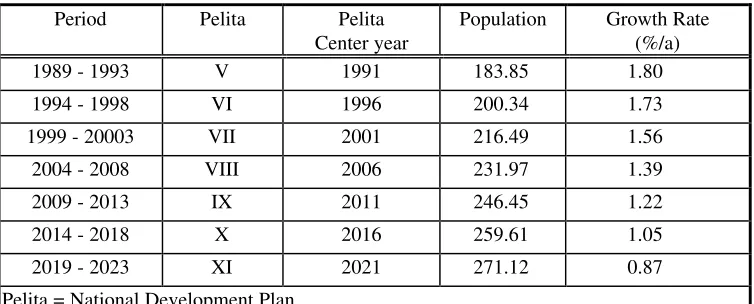
The population forecast is shown in Table 3-1. A continue decline in the population growth rate is expected because family planning policy is attempting to further reduce this rate. The population growth rate decline to 0.87 % per annum by the end of Pelita XI.
Table 3-1. Population Forecast
Period Pelita Pelita
Center year
Population Growth Rate (%/a)
1989 - 1993 V 1991 183.85 1.80
1994 - 1998 VI 1996 200.34 1.73
1999 - 20003 VII 2001 216.49 1.56
2004 - 2008 VIII 2006 231.97 1.39
2009 - 2013 IX 2011 246.45 1.22
2014 - 2018 X 2016 259.61 1.05
2019 - 2023 XI 2021 271.12 0.87
Pelita = National Development Plan
Table 3-2 shows the GDP growth rates until the end of the national development plan (Pelita) XI. The GDP grows on average by 6 % per annum. Because of the still increasing population the GDP per capita grows at a rate of 4.6 % per annum. It will increase from U.S.$ 630 per capita in the year 1991 up to about U.S $ 2,430 per capita in the year 2021 (in 1991 prices).
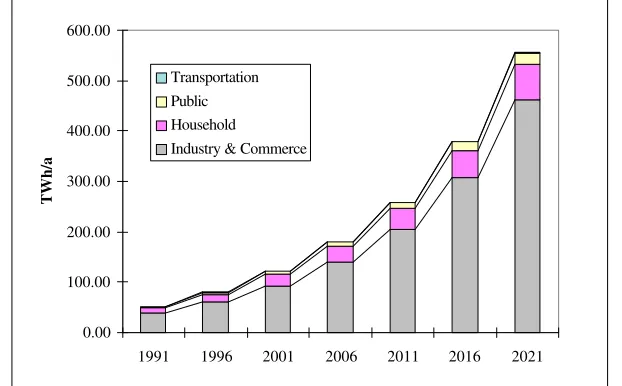
The electricity demand grows by 8.2 % per annum from about 52 TWh in 1991 to 556 TWh in the year 2021 (see Figure 3-1). About 70 % is consumed in the industrial sector, which has an average growth rate in electricity consumption of 8.5 % annually.
rural households. Electricity consumption by electrified households is much lower in rural areas.
Table 3-2. Economic Growth
Pelita Real GDP (%/a)
GDP/Capita (%/a)
Real GDP (Billion Rupiah 1985)
V 6.4 4.5 140.033,10
VI 5.7 3.9 184.823,70
VII 6.3 4.7 248.503,60
VIII 5.1 3.7 332.006,80
IX 6.0 4.7 428.336,70
X 6.1 5.0 574.134,30
XI 6.2 5.4 777.568,90
Average 6.0 4.6
In 1989, rural households consumed only 350 kWh as compared to 750 kWh by urban households. Thus, there is an enormous growth potential in rural areas and the existence of local operators clearly demonstrates that rural households want to have access to electricity. It has been assumed for the projections of this study that the connection rate of rural households reaches 80 % in Pelita XI (center year 2021) with an annual electricity consumption in the order of 1,000 kWh per electrified household. The corresponding figures for urban households are 100 % and 1,200 kWh, which will already be reached earlier.
0.00 100.00 200.00 300.00 400.00 500.00 600.00
1991 1996 2001 2006 2011 2016 2021
TWh/a
Transportation Public Household
Industry & Commerce
Figure 3-1. Electricity Demand by Sector (the BAU & ERC scenario)
In the CRC scenario the electricity demand is projected growing slightly than in the BAU and ERC scenario. This is based on the following assumption :
- The electricity use in boiler will be substituted with direct heat because of using Combined Heat and Power (CHP) technology.
4. Electricity Supply Strategies
4.1. Business as Usual Case (BAU)
There is a remarkable expansion of coal-fired steam power plants from 1.7 GW in the year 1991 (mid five year development plan, Pelita V) to 80 GW in the year: 2021 (mid year Pelita XI). The average growth rate is 14 % per annum, which means a doubling of the generation capacity every 5 year. In line with this base load and intermediate load capacity development is the growth of the peak load gas turbines, which will reach 20 GW in the year 2021. The growth rate of gas turbine including the field gas turbine in the outside Jawa will reach almost 10% p.a. With the data chosen in this study the electric high voltage line from Sumatera to Jawa is not economically competitive.
COAL
Figure 4-1 Development of Power Plant Capacities (the BAU case)
4.2 Emission Reduction Case (ERC)
COAL
Figure 4.2 Development of Power Plant Capacities (the ERC case)
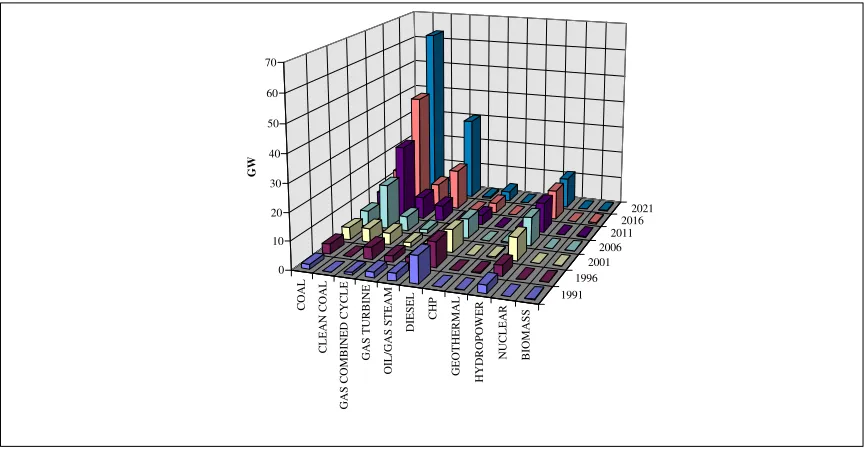
4.3 CO2 Reduction Case (CRC)
The major greenhouse gases are CO2 (carbon dioxide), methane, and nitrous oxide.
Only CO2 emission is taken into account in this study. Although the CO2 emission in
Indonesia is still low comparing with the total CO2 emission in the world, Indonesia is
aware of this issue. As one of the 150 signatory states of the Rio Convention, Government of Indonesia agreed to report on the status and tendency of CO2 emission in its territory.
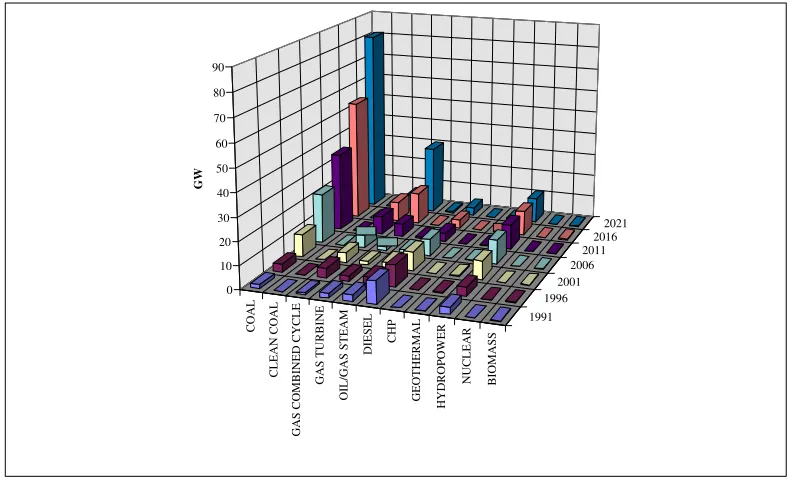
With that constraints the power plant capacity mix after year 2011 have very different figure. In 2021 the capacity will still be dominated by coal power plant but accompanied by gas turbine with similar share 23% of total national capacity respectively. Most coal fired steam power plan in this scenario for the year 2021 is already using denitrification and desulfurization units. As the optimization result, that capacity followed by gas combined cycle, geothermal, hydropower, and oil-gas fired with share 15%, 10%, 9% and 8% respectively. Nuclear power plant chosen with 5% share of the total capacity. Another power plan chosen are combined heat power(CHP), diesel, and biomas steam with total share 7%. The capacity utilization factor without combined heat-power (CHP) will be increase from 35% in 1991 to 50% in 2021.
COAL
CLEAN COAL
GAS COMBINED CYCLE
GAS TURBINE
OIL/GAS STEAM
DIESEL
CHP
GEOTHERMAL
HYDROPOWER
NUCLEAR BIOMASS 1991
1996 2001
2006 2011
2016 2021
0 5 10 15 20 25 30
GW
Figure 4-3 Development of Power Plant Capacities (the CRC case)
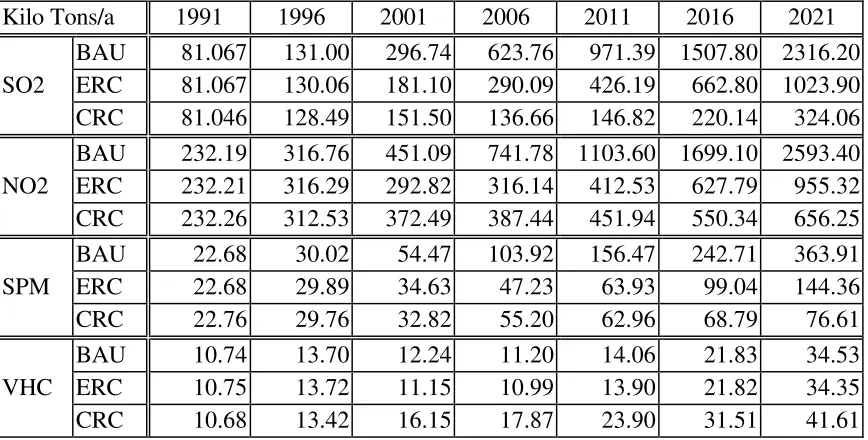
4.4 Environmental Indicator
Even if the expansion of capacity from electric power is accomplished with technologies which meet the relevant standards, pollution will still be released into the atmosphere because the so-called clean technology are not 100 % effective in removing air pollutants.
Table 4-1 Total Pollutant Emission
Kilo Tons/a 1991 1996 2001 2006 2011 2016 2021
BAU 81.067 131.00 296.74 623.76 971.39 1507.80 2316.20 SO2 ERC 81.067 130.06 181.10 290.09 426.19 662.80 1023.90 CRC 81.046 128.49 151.50 136.66 146.82 220.14 324.06 BAU 232.19 316.76 451.09 741.78 1103.60 1699.10 2593.40 NO2 ERC 232.21 316.29 292.82 316.14 412.53 627.79 955.32 CRC 232.26 312.53 372.49 387.44 451.94 550.34 656.25 BAU 22.68 30.02 54.47 103.92 156.47 242.71 363.91
SPM ERC 22.68 29.89 34.63 47.23 63.93 99.04 144.36
CRC 22.76 29.76 32.82 55.20 62.96 68.79 76.61
BAU 10.74 13.70 12.24 11.20 14.06 21.83 34.53
VHC ERC 10.75 13.72 11.15 10.99 13.90 21.82 34.35
Table 4-2 Total CO2 Emission
million Tons/a 1991 1996 2001 2006 2011 2016 2021
BAU 154 218 292 406 559 794 1139
ERC 154 218 289 404 555 787 1126
CRC 154 218 280 336 444 612 840
5. Conclusion
Abundant coal reserves make coal attractive as the major fuel for power plant in Indonesia under the BAU scenario. The ERC scenario carried out in this study showed that clean coal power plants, equipped with desulphurization, denox, and dust filter units, generate electricity at lower costs than LWR nuclear power plants. Coal is by far the most economic supply option even under the conditions of the ERC scenario.
According to this study for the CRC scenario nuclear power plant would be necessary in 2006 with installed capacity 1.34 GW and grow to 6.72 GW by the year 2021. On the other hand, fuel swithces and changes of the technology mix cause significant rise of the total electricity supply cost.
Bibliography
[1] Asean Development Bank (1992), Key Indicators on Developing Asian and Pacific Countries, Vol. XXIII.
[2] BPPT-KFA (1992), Electricity Generation and Consumption 1980-1989 : Data and
Modeling Report, Joint Indonesia/German Research Project on Environmental
Impacts of Energy Strategies for Indonesia ,KFA-STE, Julich, Germany.
[3] BPPT-KFA (1991), Updating of Demographic and Economic Models, Joint Indonesia/German Research Project on Environmental Impacts of Energy Strategies for Indonesia ,KFA-STE, Julich, Germany.
[4] Directorate General of Electricity and Energy Development (1994), General Planning of National Electricity (RUKN) : Electricity Development Program 1993/94 - 2003/04, in Indonesian, Jakarta.
[5] Ermansyah Jamin (1995), Regulation of Electricity Supply for Sustainable Competitiveness and Efficiency, Presented on National Electricity Day Seminar, in Indonesian, Jakarta, PLN.
[6] International Energy Agency (1993), The IEA, Energy Balance and Statistics Databases, on diskette.
[7] J.A. Donahue and R.L. Hauth (1995), Cooperation Prospects in Power Project :
Partnership in Transmission, Presented on Jawa Sumatera Power System
Interconnection for Regional and Industrial Development Seminar, BPPT, Jakarta. [8] Manfred Kleemann, editor (1994), Energy Use and Air Pollution in Indonesia,
Avebury Studies in Green Research, England.
[9] MIGAS (1991), Oil and Gas Reserves, unpublished paper, Directorate of Oil and Gas, Department of Mines and Energy of Indonesia, Jakarta.